Fig. G.1
Download original image
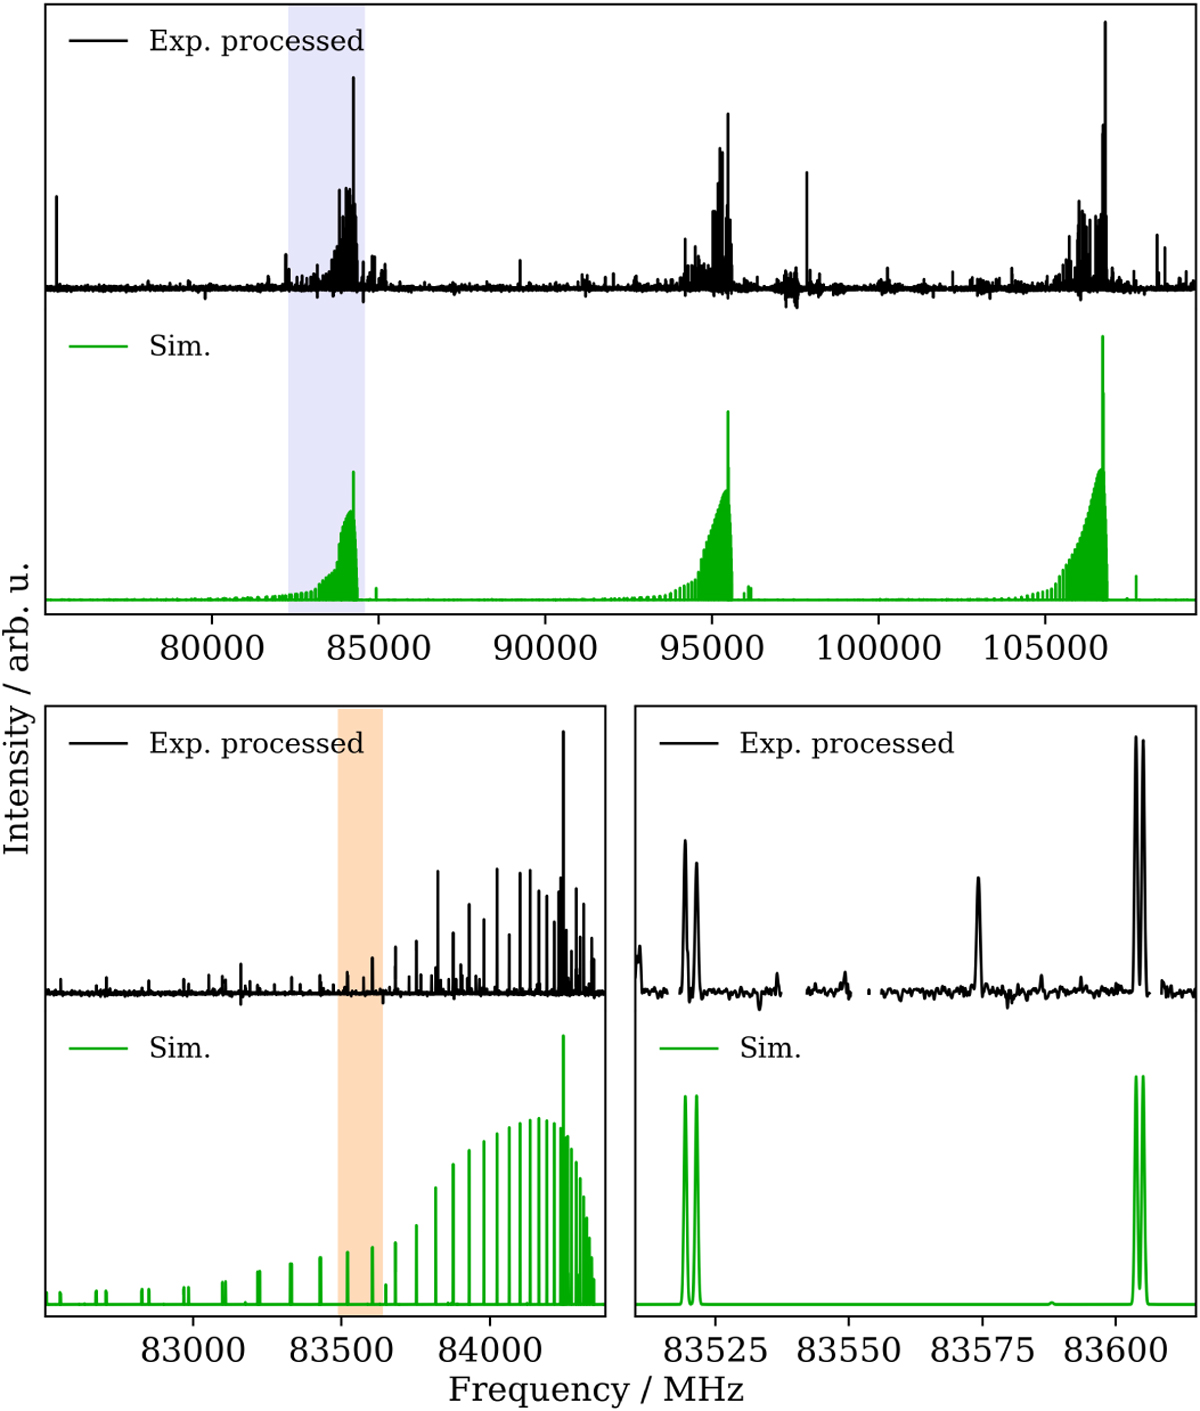
CP experimental spectrum after processing allowed the removal of contributions from known close-shell species (upper trace), and comparison with a PGOPHER simulation for FC(O)NH2 in υ = 0. The simulation was obtained using the final set of spectroscopic parameters (see Table G.1), a temperature of 300 K, and a Gaussian profile with a full width at half maximum of 0.6 MHz. The shaded area in light purple in the upper panel is zoomed in on in the bottom left panel; that in orange is zoomed in on in the lower right panel. Discontinuities in the processed experimental spectrum correspond to regions where lines of other molecules were lying.
Current usage metrics show cumulative count of Article Views (full-text article views including HTML views, PDF and ePub downloads, according to the available data) and Abstracts Views on Vision4Press platform.
Data correspond to usage on the plateform after 2015. The current usage metrics is available 48-96 hours after online publication and is updated daily on week days.
Initial download of the metrics may take a while.