Fig. 4
Download original image
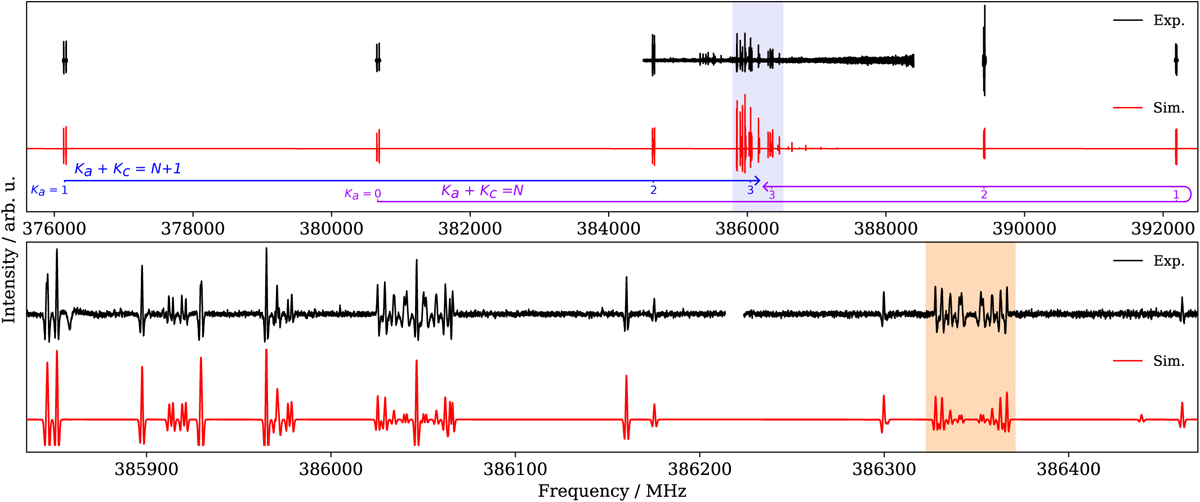
Overview of the N′ − N″ = 18–17 a-type transition of H2NCO observed experimentally and comparison with a 300 K simulation obtained using the final spectroscopic constants (Table 1). The lowest Ka values are reported for both asymmetric components in the upper panel (in blue and purple). The lower panel corresponds to a zoom into the Ka = 3–12 region highlighted in light purple in the upper panel. The area highlighted in orange displays a partially resolved hyperfine structure (Ka = 3). The simulation was obtained using a Gaussian profile with a full width at half maximum of 1.3 MHz; the second derivative of the PGOPHER trace is plotted for visual comparison with the experimental spectrum.
Current usage metrics show cumulative count of Article Views (full-text article views including HTML views, PDF and ePub downloads, according to the available data) and Abstracts Views on Vision4Press platform.
Data correspond to usage on the plateform after 2015. The current usage metrics is available 48-96 hours after online publication and is updated daily on week days.
Initial download of the metrics may take a while.