Fig. D.2
Download original image
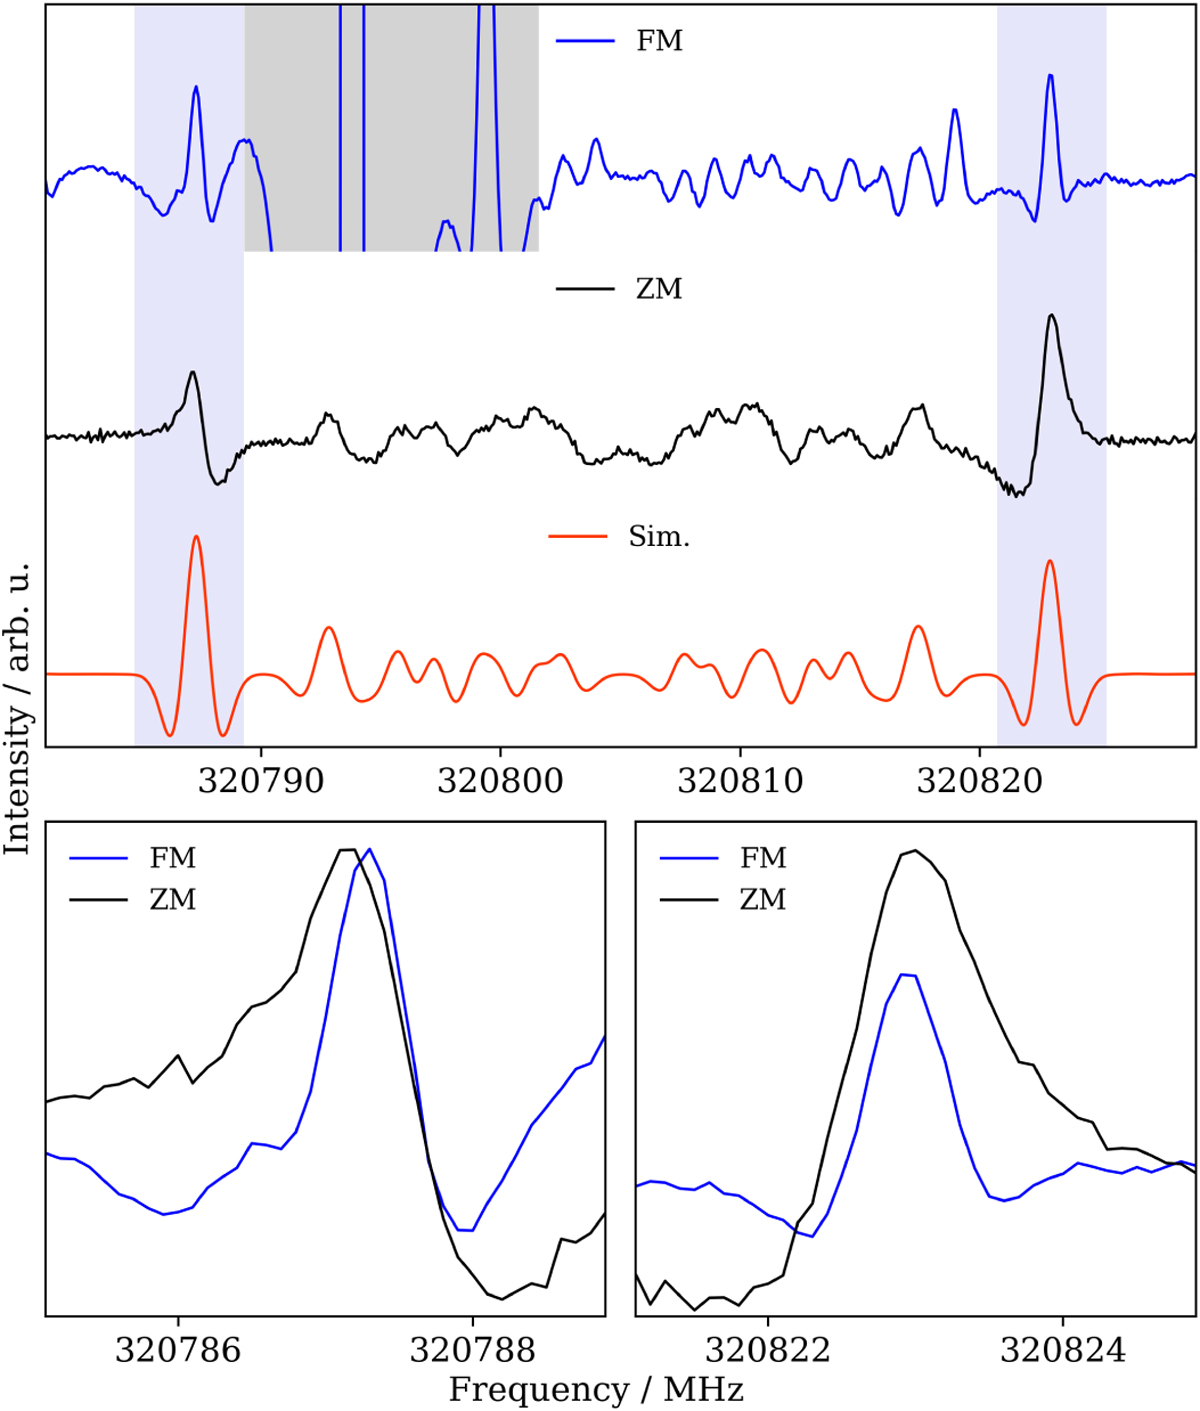
Experimental spectra recorded around the ![]() a-type transition of H2NCO using source-frequency-modulation spectroscopy (FM, second harmonics detection) and Zee-man modulation spectroscopy (ZM), and comparison with a 300 K simulation obtained with PGOPHER using the final set of spectroscopic parameters (see Table 1) and a Gaussian profile with a full width at half maximum of 1.5 MHz. The bottom panels show an overlap of the experimental spectra in the region highlighted in light blue in the top panel. The grey area in the upmost panel indicates a region where the strong lines of the precursor prevent observation of the radical product using the source-frequency-modulation experiment.
a-type transition of H2NCO using source-frequency-modulation spectroscopy (FM, second harmonics detection) and Zee-man modulation spectroscopy (ZM), and comparison with a 300 K simulation obtained with PGOPHER using the final set of spectroscopic parameters (see Table 1) and a Gaussian profile with a full width at half maximum of 1.5 MHz. The bottom panels show an overlap of the experimental spectra in the region highlighted in light blue in the top panel. The grey area in the upmost panel indicates a region where the strong lines of the precursor prevent observation of the radical product using the source-frequency-modulation experiment.
Current usage metrics show cumulative count of Article Views (full-text article views including HTML views, PDF and ePub downloads, according to the available data) and Abstracts Views on Vision4Press platform.
Data correspond to usage on the plateform after 2015. The current usage metrics is available 48-96 hours after online publication and is updated daily on week days.
Initial download of the metrics may take a while.