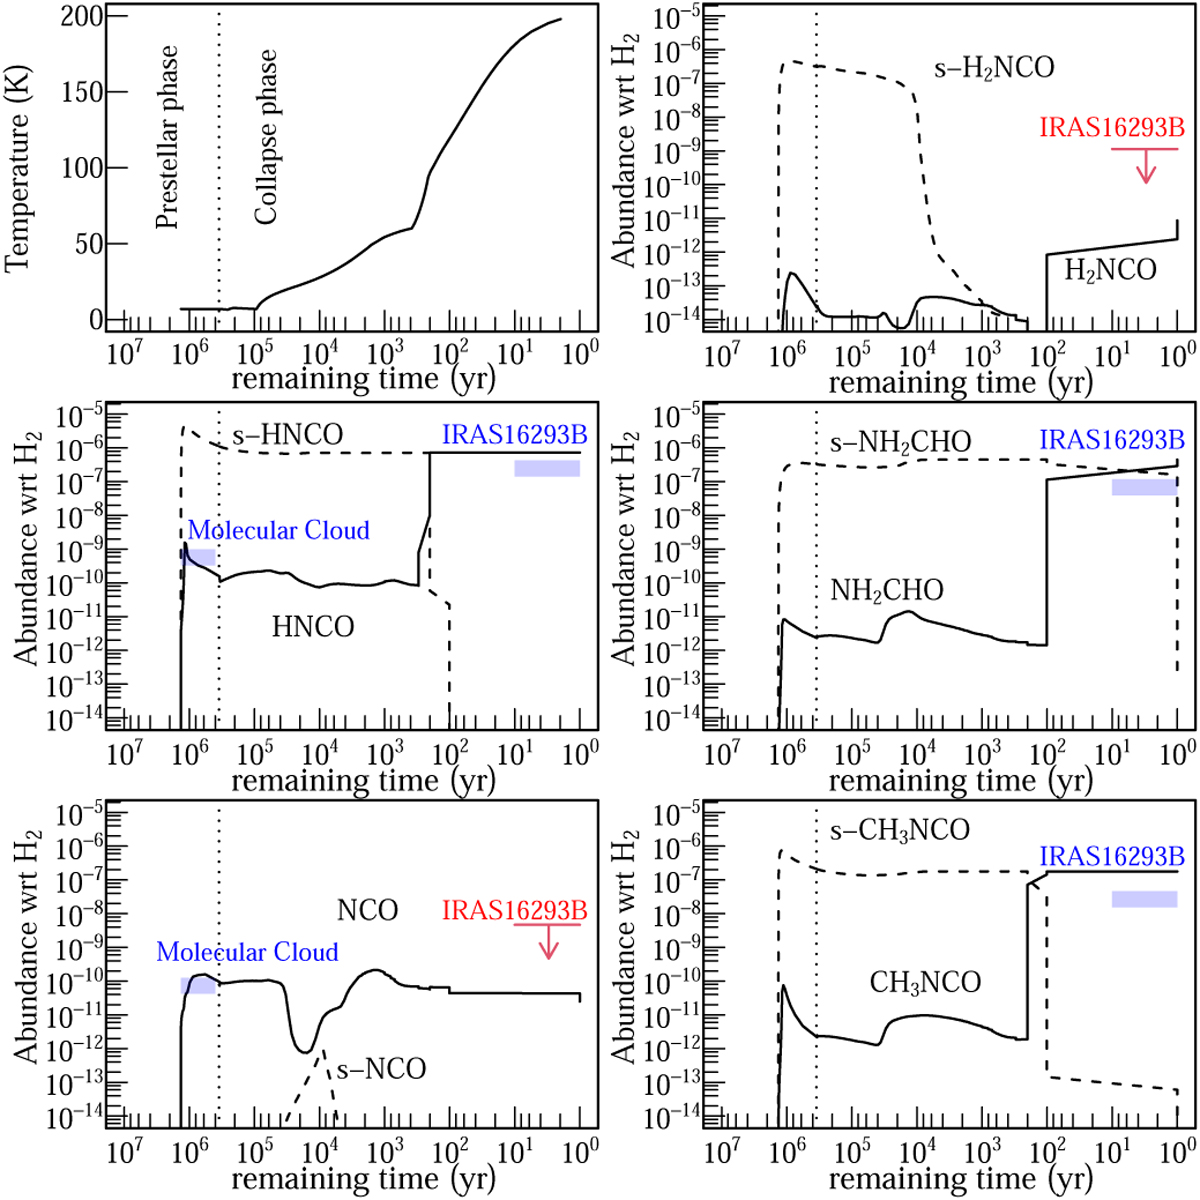
Fig. 7
Download original image
Time evolution of the temperature and the abundances (with respect to molecular hydrogen) in the gas phase (solid lines) and on the grain surface (dashed) of HNCO, H2NCO, NH2CHO NCO, and CH3NCO species during the cold-core phase and the collapse phase. The time axis is reversed to better visualise the evolution of the abundances. The observed gas-phase abundances are indicated in blue. Detections in IRAS 16293 B are from Coutens et al. (2016); Hernández-Gómez et al. (2018);? for HNCO and from Coutens et al. (2016); Jørgensen et al. (2020); ? for NH2CHO. Detections in dense molecular clouds are from ? Marcelino et al. (2009) and Turner et al. (1999). The upper limits for the relative abundance of the gas phase H2NCO and NCO in IRAS 16293 B are shown in red. The observed abundances for IRAS 16293 B are calculated from the observed column densities using an H2 column density equal to 1.5 × 1023 cm−2 so that the chemical model reproduces the observed abundance of CH3OH (this is equivalent to using abundances relative to CH3OH).
Current usage metrics show cumulative count of Article Views (full-text article views including HTML views, PDF and ePub downloads, according to the available data) and Abstracts Views on Vision4Press platform.
Data correspond to usage on the plateform after 2015. The current usage metrics is available 48-96 hours after online publication and is updated daily on week days.
Initial download of the metrics may take a while.