Fig. B.1
Download original image
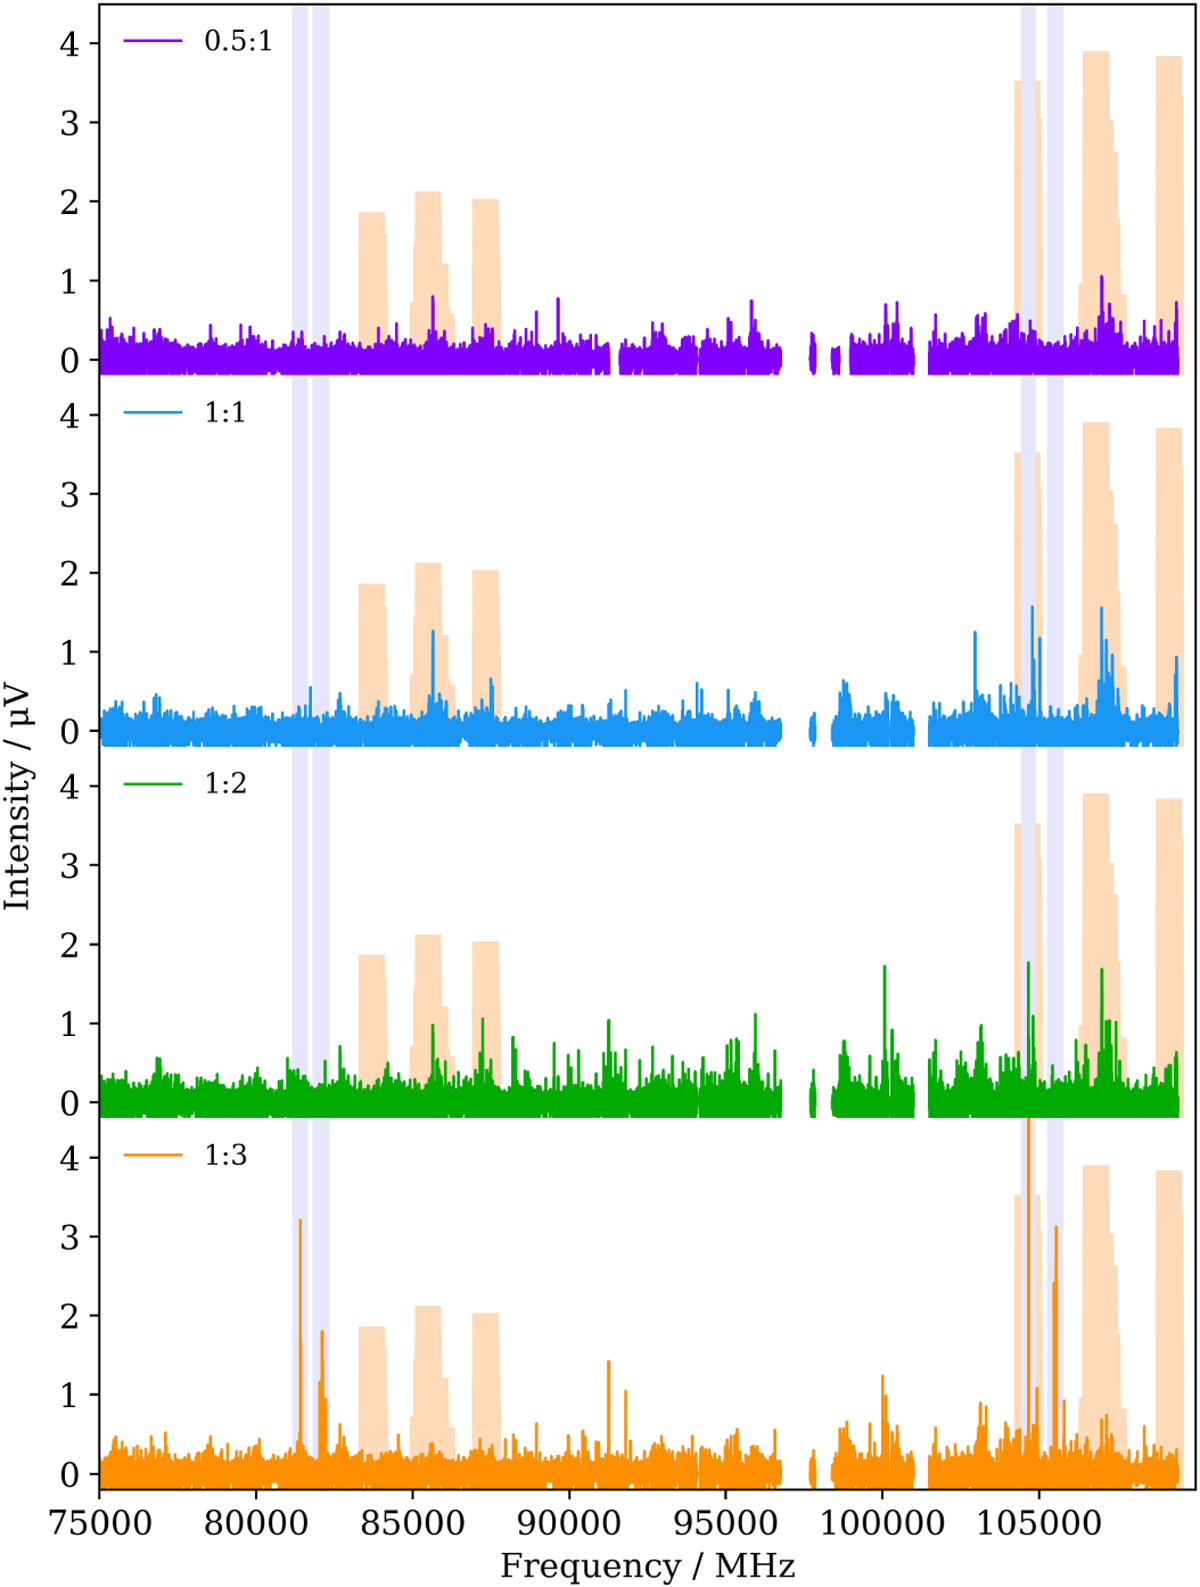
Comparison of the different CP spectra after data treatment allowed us to identify transitions from radical species (formamide:F2/He pressure ratios of 1:0.5, 1:1, 1:2, and 1:3, from top to bottom). The shaded areas correspond to ±200 MHz windows around the spectral predictions from the NCO and H2NCO radicals (in light blue and orange, respectively). For NCO, predictions are from the CDMS database (Endres et al. 2016) based on the experimental work by Kawaguchi et al. (1985). For H2NCO, calculated values are from this work and the relative intensity is proportional to the expected line intensity at 300 K, in arbitrary units. Discontinuities in the experimental spectra correspond to very noisy regions that have not been plotted for the sake of clarity.
Current usage metrics show cumulative count of Article Views (full-text article views including HTML views, PDF and ePub downloads, according to the available data) and Abstracts Views on Vision4Press platform.
Data correspond to usage on the plateform after 2015. The current usage metrics is available 48-96 hours after online publication and is updated daily on week days.
Initial download of the metrics may take a while.