Fig. E.1
Download original image
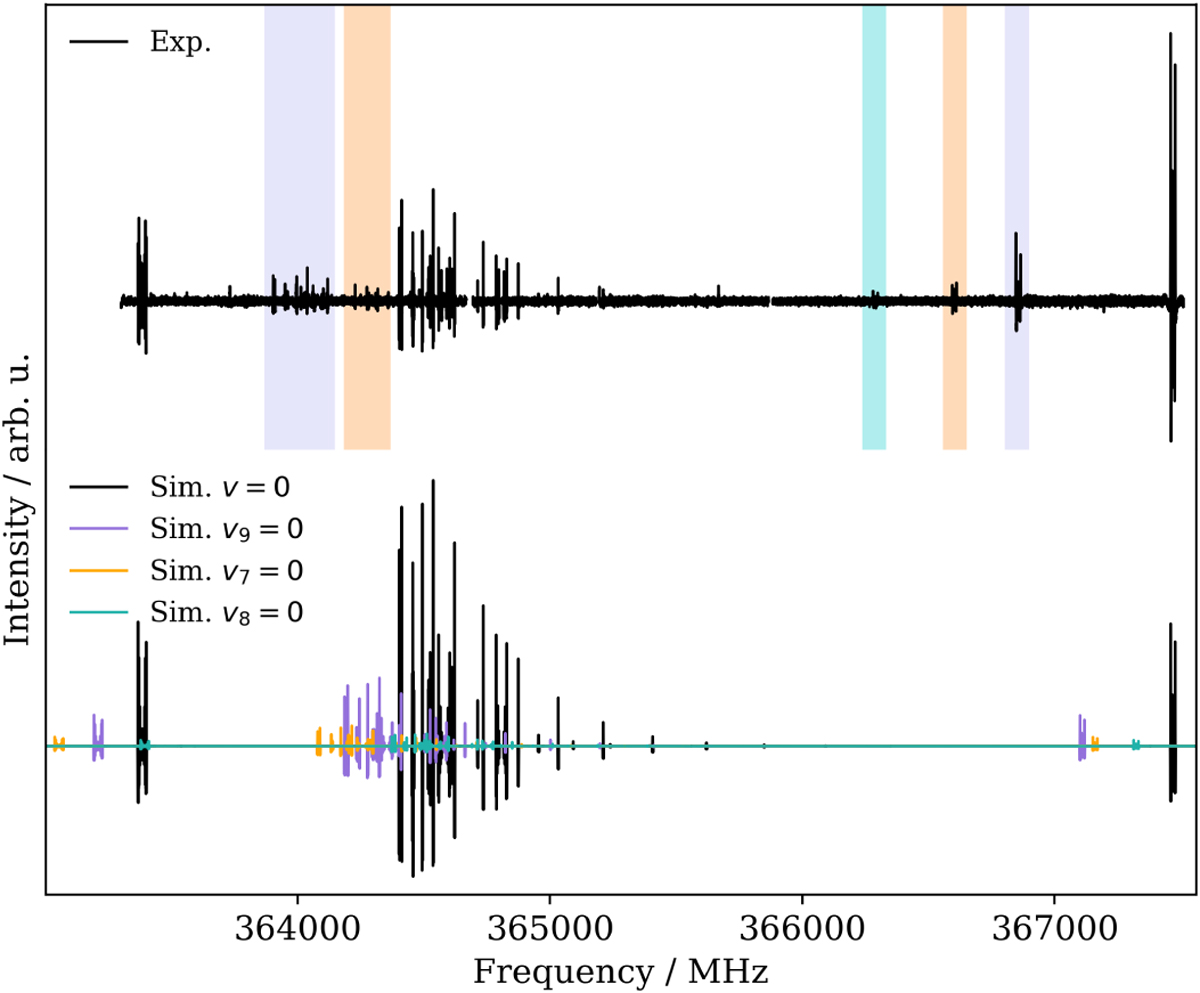
Experimental spectrum recorded around the N′ − N″ = 17 − 16 a-type transition of H2NCO using Zeeman modulation spectroscopy (upper trace), and comparison with PGOPHER simulations for υ = 0 and the three lowest vibrationally excited states at 300 K. The simulation in υ = 0 was obtained using the final set of spectroscopic parameters (see Table 1). Those in the excited states were obtained using the harmonic vibrational energies, the predicted rotational constants in these states (calculated using the α values in Table A.2), and the other spectroscopic parameters from υ = 0. For all simulations, a Gaussian profile with a full width at half maximum of 1.3 MHz has been used. Shaded areas in the upper trace highlight regions where the observed transitions likely arise from vibrational satellites.
Current usage metrics show cumulative count of Article Views (full-text article views including HTML views, PDF and ePub downloads, according to the available data) and Abstracts Views on Vision4Press platform.
Data correspond to usage on the plateform after 2015. The current usage metrics is available 48-96 hours after online publication and is updated daily on week days.
Initial download of the metrics may take a while.