Fig. 6
Download original image
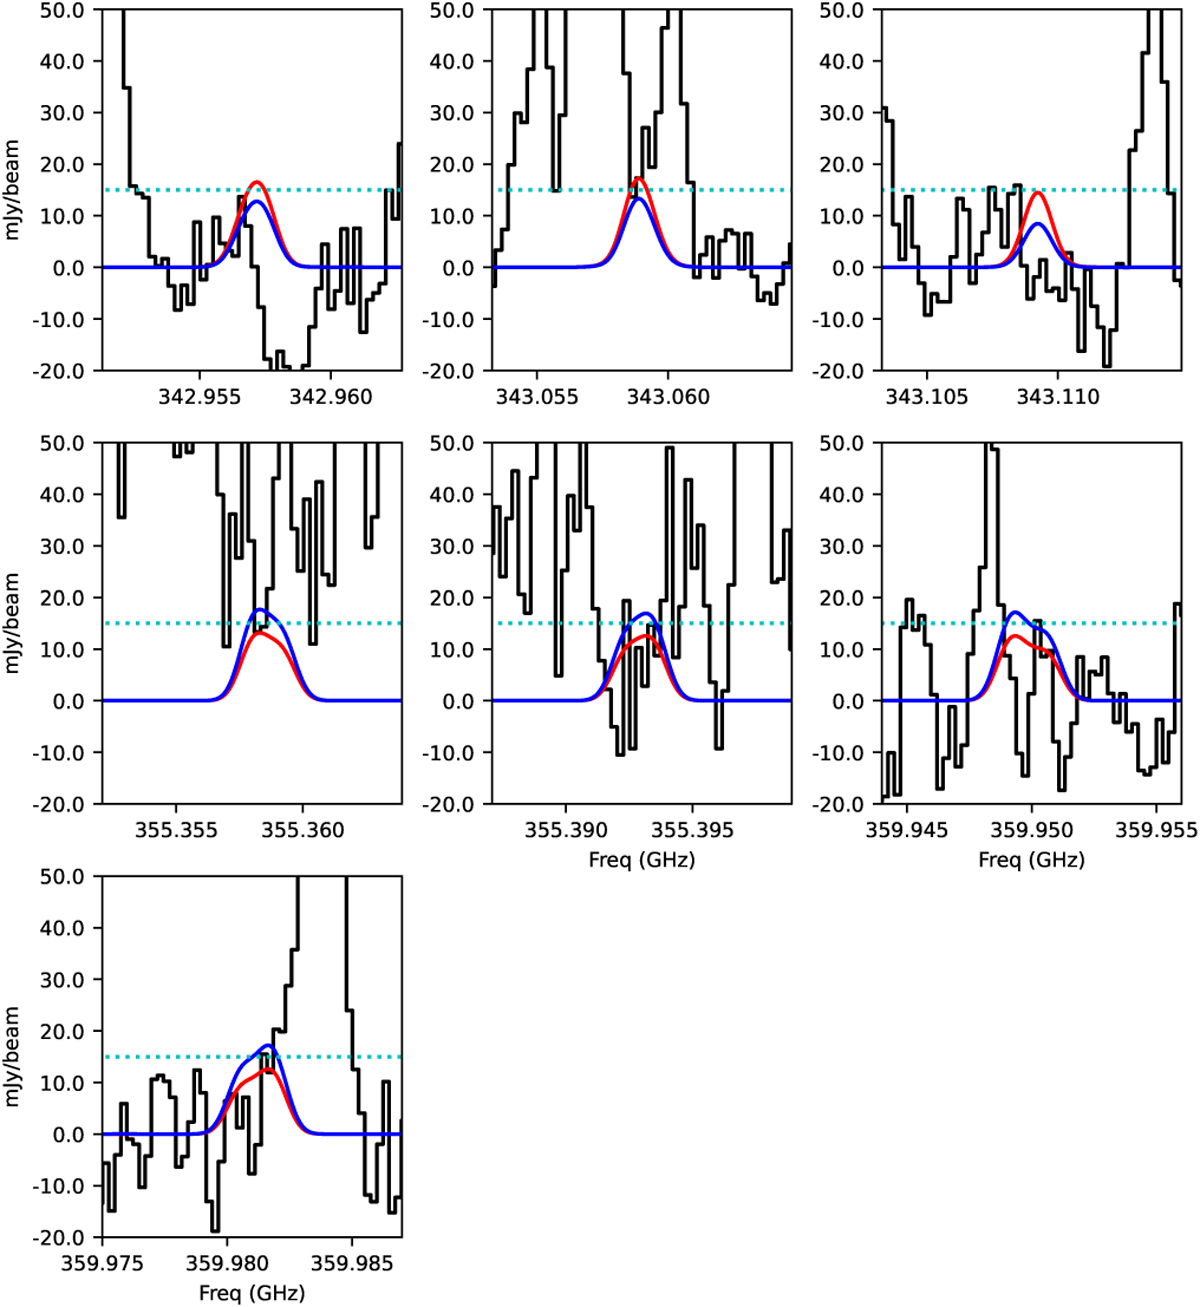
Undetected transitions of H2NCO that were used to determine the column density upper limits. The ALMA observed spectrum of IRAS 16293 B is in black. The LTE model for Tex = 300 K is in red, while the one for Tex = 125 K is in blue. The dotted cyan line corresponds to the 3 rms level per 1 km s−1, 1 km s−1 being the typical line width at this position.
Current usage metrics show cumulative count of Article Views (full-text article views including HTML views, PDF and ePub downloads, according to the available data) and Abstracts Views on Vision4Press platform.
Data correspond to usage on the plateform after 2015. The current usage metrics is available 48-96 hours after online publication and is updated daily on week days.
Initial download of the metrics may take a while.