| Issue |
A&A
Volume 687, July 2024
|
|
|---|---|---|
| Article Number | A207 | |
| Number of page(s) | 16 | |
| Section | Interstellar and circumstellar matter | |
| DOI | https://doi.org/10.1051/0004-6361/202449352 | |
| Published online | 12 July 2024 | |
Kinetic temperature of massive star-forming molecular clumps measured with formaldehyde
V. The massive filament DR21
1
Xinjiang Astronomical Observatory, Chinese Academy of Sciences,
830011
Urumqi,
PR China
e-mail: This email address is being protected from spambots. You need JavaScript enabled to view it.
2
University of Chinese Academy of Sciences,
100080
Beijing,
PR China
3
Key Laboratory of Radio Astronomy, Chinese Academy of Sciences,
830011
Urumqi,
PR China
4
Xinjiang Key Laboratory of Radio Astrophysics,
Urumqi
830011,
PR China
5
Max-Planck-Institut für Radioastronomie,
Auf dem Hügel 69,
53121
Bonn,
Germany
6
Purple Mountain Observatory, Chinese Academy of Sciences,
Nanjing
210008,
PR China
7
Max-Planck-Institut für Extraterrestrische Physik,
Giessenbachstr. 1,
85748
Garching bei München,
Germany
8
Shanghai Astronomical Observatory, Chinese Academy of Sciences,
80 Nandan Road,
Shanghai
200030,
PR China
9
Kavli Institute for Astronomy and Astrophysics, Peking University,
Beijing
100871,
PR China
10
National Astronomical Observatories, Chinese Academy of Sciences,
Beijing
100101,
PR China
11
School of Mathmatics and Physics, Jinggangshan University,
343009
Ji’an,
PR China
12
School of Astronomy and Space Science, Nanjing University,
210093
Nanjing,
PR China
Received:
26
January
2024
Accepted:
24
May
2024
Abstract
The kinetic temperature structure of the massive filament DR21 within the Cygnus X molecular cloud complex has been mapped using the IRAM 30 m telescope. This mapping employed the para-H2CO triplet (JKaKc = 303−202, 322−221, and 321–220) on a scale of ~0.1 pc. By modeling the averaged line ratios of para-H2CO 322–221/303–202 and 321–220/303 –202 with RADEX under non local thermodynamic equilibrium (LTE) assumptions, the kinetic temperature of the dense gas was derived, which ranges from 24 to 114 K, with an average temperature of 48.3 ± 0.5 K at a density of n(H2)= 105 cm−3. In comparison to temperature measurements using NH3 (1, 1)/(2,2) and far-infrared (FIR) wavelengths, the para-H2CO(3–2) lines reveal significantly higher temperatures. The dense clumps in various regions appear to correlate with the notable kinetic temperature (Tkin ≳ 50 K) of the dense gas traced by H2CO. Conversely, the outskirts of the DR21 filament display lower temperature distributions (Tkin < 50 K). Among the four dense cores (N44, N46, N48, and N54), temperature gradients are observed on a scale of ~0.1–0.3 pc. This suggests that the warm dense gas traced by H2CO is influenced by internal star formation activity. With the exception of the dense core N54, the temperature profiles of these cores were fitted with power-law indices ranging from −0.3 to −0.5, with a mean value of approximately −0.4. This indicates that the warm dense gas probed by H2CO is heated by radiation emitted from internally embedded protostar(s) and/or clusters. While there is no direct evidence supporting the idea that the dense gas is heated by shocks resulting from a past explosive event in the DR21 region on a scale of ~0.1 pc, our measurements of H2CO toward the DR21W1 region provide compelling evidence that the dense gas in this specific area is indeed heated by shocks originating from the western DR21 flow. Higher temperatures as traced by H2CO appear to be associated with turbulence on a scale of ~0.1 pc. The physical parameters of the dense gas as determined from H2CO lines in the DR21 filament exhibit aremarkable similarity to the results obtained in OMC-1 and N113, albeit on a scale of approximately 0.1–0.4 pc. This may imply that the physical mechanisms governing the dynamics and thermodynamics of dense gas traced by H2CO in diverse star formation regions may be dominated by common underlying principles despite variations in specific environmental conditions.
Key words: stars: formation / stars: massive / ISM: clouds / ISM: molecules
© The Authors 2024
 Open Access article, published by EDP Sciences, under the terms of the Creative Commons Attribution License (https://creativecommons.org/licenses/by/4.0), which permits unrestricted use, distribution, and reproduction in any medium, provided the original work is properly cited.
This article is published in open access under the Subscribe to Open model. This email address is being protected from spambots. You need JavaScript enabled to view it. to support open access publication.
1 Introduction
Increasing evidence indicates that the physical properties of the interstellar medium (ISM) have an impact on the star formation rate, the spatial distribution, and essential properties of the next generation of stars, such as the elemental composition and initial mass function (e.g., Paumard et al. 2006; Kennicutt 1998a,b; Klessen et al. 2007; Papadopoulos et al. 2011; Zhang et al. 2018; Tang et al. 2019). High-mass stars exert a significant influence on their surroundings and subsequent star formation through their feedback such as outflows, winds, and UV radiation. However, the specifics of the high-mass star formation process and how their feedback affects the initial conditions of high-mass stars during formation are not yet fully understood. To investigate the intricacies or star formation within molecular gas, it is crucial to obtain accurate measurements of its physical properties such as the kinetic temperature and volume density.
The Cygnus X molecular cloud complex provides a large sample of star formation regions that exhibit diverse physical conditions and evolutionary stages, making it an ideal laboratory for investigating the process of star formation (e.g., Reipurth & Schneider 2008; Schneider et al. 2010). The DR21 filament at a distance of ~1.5kpc (Rygl et al. 2012) is the densest and most massive region in the entire Cygnus X molecular complex, which is one of the most active star-forming regions within 2 kpc from the Sun (e.g., Schneider et al. 2006; Motte et al. 2007; Davis et al. 2007; Kumar et al. 2007; Beerer et al. 2010; Csengeri et al. 2011). The DR21 filament is an elongated and dense molecular ridge that spans ~4pc in length, extending in a north-south direction. It hosts a mass of ~104 M⊙, which is typically defined by high column densities, that is, N(H2) > 1023 cm−2 (Schneider et al. 2010; Hennemann et al. 2012). The DR21 filament encompasses three prominent regions, namely DR21, DR21(OH), and W75S. Additionally, the DR21W1 region situated to the west of the DR21 region is associated with the western DR21 flow (e.g., Jaffe et al. 1989; Lane et al. 1990; Davis et al. 2007; Zapata et al. 2013). The two well-known star-forming regions DR21 and DR21(OH) are located in the southern and central parts of the DR21 filament, respectively. DR21 is a relatively more evolved massive star-forming region, which harbors a group of luminous H II regions and massive protostars associated with very energetic outflows (e.g., Harris 1973; Garden et al. 1991a; Russell et al. 1992; Kogan & Slysh 1998; Cyganowski et al. 2003; Rygl et al. 2012). The observed outflows in DR21 exhibit a bipolar structure, characterized by its most prominent molecular lobes extending in a northeast-southwest direction (e.g., Davis et al. 2007; Schneider et al. 2010; Skretas et al. 2023). DR21(OH) is an extremely massive star-forming region with intensive maser activity (e.g., Genzel & Downes 1977; Norris et al. 1982; Batria & Menten 1988; Kogan & Slysh 1998; Harvey-Smith et al. 2008; Schneider et al. 2010). The W75S region, which contains several FIR sources, is positioned to the north of the DR21 filament (Harvey et al. 1986; Wilson & Mauersberger 1990; Davis et al. 2007; Kumar et al. 2007; Reipurth & Schneider 2008).
Extensive investigations of the DR21 filament have been conducted across various wavelengths, including radio, millimeter, and infrared wavelengths. The region displays a remarkable complexity, with numerous infrared filaments oriented perpendicularly to the ridge, indicating potential sites of star formation as evidenced by observations from the Spitzer and Herschel telescopes (Marston et al. 2004; Kumar et al. 2007; Beerer et al. 2010; Hennemann et al. 2012). Dust continuum studies reveal a chain of dusty, dense cores along the ridge of the DR21 filament (Chandler et al. 1993; Vallée & Fiege 2006; Motte et al. 2007; Cao et al. 2019). A large number of molecular line observations have been performed, such as in CO, CN, CS, HCN, HCO+, CH3OH, H2CO, NH3, and N2H+ (e.g., Wilson & Mauersberger 1990; Vallée & Fiege 2006; Schneider et al. 2006, 2010, 2016; Zapata et al. 2012; Dobashi et al. 2019; Keown et al. 2019; Cao et al. 2022; Bonne et al. 2023; Gong et al. 2023b), which reveal the dynamics and evolution of the dense molecular structure of the DR21 filament on large scales.
The gas temperature structure of the DR21 filament has been mapped in NH3 (1,1) and (2,2) with the Robert C. Byrd Green Bank Telescope (GBT, beam size ~32″; Keown et al. 2019). The typical kinetic temperature of the dense gas, derived from NH3 (2,2)/(1,1) line ratios, falls within the range of 20–30 K. In specific regions, the typical gas kinetic temperatures are around 20 K in the W75S region, approximately 22–64K in the DR21(OH) region, and about 35–60K in the DR21W1 region. Mangum et al. (1992) presented high-resolution imaging of the NH3 (1,1) and (2,2) lines within the DR21(OH) region, utilizing the Very Large Array (VLA) with a beam size of ~4″. By also analyzing the line ratios of NH3 (2,2)/(1,1) within dense ammonia cores, they derived the gas kinetic temperatures. These temperatures range from 20 to >80K, with a typical value of approximately 30K. The dust temperature structure of the DR21 filament has been derived from spectral energy distribution (SED) fitting to Herschel continuum data spanning 70–500 µm (beam size ~40″; Hennemann et al. 2012; Cao et al. 2019, 2022). The typical dust temperature was found to be between 15 and 31K, with specific regions exhibiting typical values of 20, 21, 22, 20, 31, 23, 21, 18, and 16 K for W75S FIR 3, W75S FIR 2, W75S FIR 1, DR21(OH)N, DR21(OH), DR21(OH)S, DR21, DR21W1, and DR21S, respectively. These studies provide valuable insights into the gas and dust temperature variations within the DR21 filament. Nevertheless, it is worth noting that the NH3 (1,1) and (2,2) lines exhibit critical densities on the order of ncrit(NH3) ~ 103 cm−3 (Shirley 2015). This characteristic suggests that these particular spectral lines possess a sensitivity suitable for probing the moderate-density gas within molecular clouds. A more comprehensive database of gas temperature that is related to star formation (n(H2)>104 cm−3) in the DR21 filament, with a high resolution at a subparsec scale, is still lacking. Hence, further research and high-resolution observations of the DR21 filament are necessary to achieve a comprehensive characterization of the thermal properties of the dense gas.
Formaldehyde (H2CO), a slightly asymmetric rotor, is ubiquitous in interstellar clouds (e.g., Downes et al. 1980; Hurt et al. 1996; Mühle et al. 2007; Ao et al. 2013; Tang et al. 2013, 2014; Guo et al. 2016; Yan et al. 2019; Brinkmann et al. 2020), exhibits a large number of transitions from centimeter to millimeter wavelengths and is thought to be sensitive to probe physical conditions in various molecular clouds (e.g., Henkel et al. 1980, 1983; Mangum & Wootten 1993; Mangum et al. 2008, 2013a, 2019; Ginsburg et al. 2011, 2016; Ao et al. 2013; Tang et al. 2017a,b, 2018a,b, 2021; Immer et al. 2016). Previous observations of H2CO indicate that variations in the fractional abundance of H2CO only rarely exceed one order of magnitude at various stages of star formation (e.g., Mangum et al. 1990, 1993; Caselli et al. 1993; Johnstone et al. 2003; Gerner et al. 2014; Tang et al. 2017a,b, 2018b; Liu et al. 2020). It is possibly the best of the very few molecular thermometers that are available for the analysis of dense molecular gas.
Since the relative populations of the Ka ladders of H2CO are predominantly governed by collisions, ratios of H2CO line fluxes involving different Ka ladders can act as good indicators of kinetic temperature, such as para-H2CO  , and 523−422/505−404 (Mangum & Wootten 1993; Tang et al. 2018b; Mazumdar et al. 2022; Kahle et al. 2023). These H2CO line ratios can accurately trace dense molecular gas as thermometers and have been used to measure the temperature of dense gas in Galactic star formation regions (e.g., Mangum & Wootten 1993; Hurt et al. 1996; Mangum et al. 1999; Watanabe & Mitchell 2008; Nagy et al. 2012; Lindberg et al. 2015; Tang et al. 2017a, 2018a,b; Gieser et al. 2021; Izumi et al. 2024), Galactic center clouds (Qin et al. 2008; Ao et al. 2013; Johnston et al. 2014; Ginsburg et al. 2016; Immer et al. 2016; Lu et al. 2017), and even external galaxies (Mühle et al. 2007; Tang et al. 2017b, 2021; Mangum et al. 2019).
To understand the feedback from the high-mass star-forming process, it is critical to investigate the correlation between the gas temperature and star formation activities in the molecular clouds. The main goal of this paper is to map the kinetic temperature structure of the massive DR21 filament in the north of the Cygnus X molecular cloud complex, making use of the para-H2CO triplet  , and 321−220, hereafter H2CO) with a critical density on the order of ncrit(H2CO 303202) ~ a few 105 cm−3 (Shirley 2015) and to investigate the gas heating mechanism affecting the dense gas in the processes of star formation. In Sects. 2 and 3, we introduce our observations of the H2CO triplet, data reduction, and results. We discuss the resulting kinetic temperatures derived from H2CO in Sect. 4. Our main conclusions are summarized in Sect. 5. This paper is part of the “Kinetic temperature of massive star-forming molecular clumps measured with formaldehyde” series of studies exploiting H2CO as a probe of gas conditions in a variety of Galactic and extragalactic sources.
2 Observations and data reduction
Our data presented here were observed with the IRAM 30 m telescope1 in 2017 May and 2018 October using the HERA receiver (Schuster et al. 2004). The H2CO ( , and 321−220) transitions have rest frequencies of 218.222, 218.475, and 218.760 GHz, respectively, and could be measured simultaneously. At ~218 GHz, the beam size is ~12″ (~ 0.09 pc at 1.5 kpc distance; Rygl et al. 2012). The main beam efficiency and the forward efficiency2 are 0.60 and 0.94, respectively. The back-end spectrometer has a bandwidth of ~1 GHz and 5377 spectral channels, providing a channel width of ~0.27 km s−1. The central frequency was set to 218.475 GHz. The on-the-fly observing mode was used to measure four ~3 × 3 arcmin2 maps with steps of 3.5″ in both right ascension and declination. The surveyed area of the DR21 filament is ~4 × 10 arcmin2 (~1.7 × 4.4 pc2), centered on α2000 = 20h39m01 s.0 and δ2000 = 42°22′49″.8.
Data reduction for spectral lines and maps was performed with GILDAS3. To improve the signal-to-noise ratio (S/N) in individual channels, we smoothed contiguous channels to a velocity resolution ~0.8 km s−1 and the spectra were resampled in steps of ~6″. In total, we acquired 3200 positions corresponding to 3200 spectra for each transition. Nearly 55% of all positions were detected in H2CO 303−202 and ~23% were also detected in H2CO 322−221 and 321−220, with S/Ns of ≳3σ. We used Gaussian profiles to fit all H2CO spectra with S/Ns above 3σ. A typical rms noise level(1σ) is ~0.19K (Tmb scale) at a channel width of 0.8 km s−1.
Generally, H2CO 322−221 and 321−220 show weaker emissions than H2CO 303−202. The H2CO 322−221 and 321−220 transitions have the same Ka ladder and almost the same energy of the upper levels, Eu ≃ 68 K, above the ground state. They also show similar distributions and line profiles (brightness temperature, line width, and velocity in our observations) in star formation regions (e.g., Mangum & Wootten 1993; Tang et al. 2017a,b, 2018a,b, 2021). Furthermore, H2CO 322-221/303-202 and 321220/303−202 line ratios exhibit similar behaviors to trace the kinetic temperature of dense gas (e.g., Mangum & Wootten 1993; Tang et al. 2017a). To further enhance the S/Ns of H2CO 322−221 and 321−220, we combined the line intensity of two transitions channel by channel.
In the vicinity of DR21(OH), the H2CO 303−202 spectral lines possess two distinct velocity components. However, identifying these two distinct velocity components becomes difficult for the weaker H2CO 322−221 and 321−220 lines. To address this, we employed a Gaussian method to fit these ~70 positions that clearly exhibit two velocity components. The two velocity components measured using H2CO 303−202 are approximately at local standard of rest velocities (VLSR) of −4 and −2 km s−1, consistent with previous findings from observations of HCO+, H13CO+, and N2H+ (Schneider et al. 2010; Cao et al. 2022; Bonne et al. 2023). High-resolution observations revealed that these two velocity components were attributed to two closely aligned fibers in the DR21(OH)/W75S region (Cao et al. 2022). Subsequently, we combined the data from these two velocity components based on the integrated intensity ratio between each pair of velocity component lines. Hence, the gas temperatures of these positions in the two velocity components were not determined individually.
3 Results
3.1 Overview
The velocity-integrated intensity distributions of the H2CO triplet and the combined H2CO 322−221 and 321−220 lines in the DR21 filament (VLSR = −10 to 4 km s−1) are shown in Fig. 1. The intensity-weighted velocity field (moment 1), line width (moment 2), and channel maps of H2CO 303−202 are shown in Figs. 2 and A.1. The observed H2CO spectra of sixteen dense cores identified with 1.2 mm continuum emission by Motte et al. (2007) are shown in Fig. 3. The locations of these dense cores in the DR21 filament are indicated in Fig. 4 (left panel) and are listed in Table 1. The parameters of the Gaussian fits, which include velocity-integrated intensity, ∫ Tmb dv, local standard of rest velocity, VLSR, full width at half maximum (FWHM) line width, and peak temperature (Tmb) of the H2CO spectra in these dense cores are listed in Table 1. Three dense cores, namely N35, N45, and N52, situated at the periphery of the DR21 filament, exhibit weak emissions of H2CO 322−221 and 321−220 with S/Ns below 3σ, as depicted in Figs. 1 and 4. Consequently, these cores were omitted from Fig. 3.
3.2 Distribution of H2CO
The H2CO 303−202 line exhibits an extensive distribution and provides a clear picture of the dense ridge structure of the DR21 filament (see the left panel of Fig. 1). It illuminates notable dense molecular structures including the DR21, DR21(OH), and W75S regions on a linear scale of ~0.1 pc. Obviously, the strongest emission of H2CO is associated with the two most active star-forming regions, DR21 and DR21(OH). These results are consistent with prior observational findings using other dense gas tracers, such as CN, C18O, CS, HCN, and HCO+ (Schneider et al. 2010; Dobashi et al. 2019). The spatial distribution of H2CO 303−202 illustrates a close correspondence with the spatial distribution of the dust emission at wavelengths of 850 µm and 1.2 mm, including the presence of dense ridge structures and dust emission peaks within the DR21 filament (Davis et al. 2007; Motte et al. 2007; Ching et al. 2022), which confirms previous observational results regarding massive star formation regions (e.g., Tang et al. 2017a, 2018a,b, 2021). In contrast, H2CO 322−221 and 321−220 indicate less extended distributions and are only detectable in the densest areas of the DR21 filament, as shown in the rightmost three panels of Fig. 1.
The intensity-weighted velocity (moment 1) and channel maps of H2CO (303−202) reveal the complex velocity field of the DR21 filament (see the left panels of Figs. 2 and A.1). Notably, multiple velocity gradients traverse the primary DR21 filament as well as the DR21W1 region. The W75S region shows an increasing gradient of velocity (−4.5 to −2.5 km s−1) that extends from the northeast to the southwest, while the DR21(OH) region displays a decreasing northwest-southeast velocity gradient (−2.5 to −4.0 km s−1). Utilizing high-resolution observations of H13CO+, N2H+, and NH2D toward the W75S/DR21(OH) region (beam size ~5″), it has been observed that three nearly parallel fibers exist at distinct velocities, primarily aligned in a north-south orientation (Cao et al. 2022). Such an alignment may give rise to the complex velocity field found within this region. Furthermore, the DR21 and DR21W1 regions exhibit a comparable increasing northeast-to-southwest velocity gradient with the mean velocity ranging from −3.5 to −1.5 km s−1 and from −5.0 to −2.0 km s−1, respectively. Our observed H2CO results corroborate previous observational outcomes obtained from H13CO+, C34S, and N2H+ (Schneider et al. 2010).
As shown in the right panel of Fig. 2, higher line widths (≳3 km s−1) are typically associated with dense clumps, such as DR21, DR21W1, DR21(OH), DR21(OH)S, and DR21(OH)W, in the two most active star-forming regions DR21 and DR21(OH). Moderate line widths (2−3km s−1) are distributed in the dense clumps of the W75S region, as well as around the dense clumps of DR21 and DR21(OH) regions, while lower line widths (<2 km s−1) are located on the outskirts of the DR21 filament. The fitted line width of H2CO (303−202) ranges from 1.7 to 10.4km s−1 with an average of ~3.8±0.1 km s−1 (errors given here and elsewhere are standard deviations of the mean).
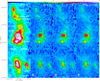 |
Fig. 1 Velocity-integrated intensity maps (Tmb scale; color bar in units of K km s−1) of H2CO 303 −202 (left), 322−221 (center left), 321−220 (center right), and averaged 322−221 and 321−220 (right), integrated from VLSR = −10 to 4 km s−1 of the DR21 filament. Contour levels are from 4.8 to 12K km s−1 with steps of 1.8K km s−1 and from 12 to 59 K km s−1 with steps of 3.6K km s−1 for H2CO303−202, and from 1.7 to 4.4K km s−1 with steps of 0.66K km s−1 and from 4.3 to 21.2 K km s−1 with steps of 1.3K km s−1 for H2CO 322 −221, 321−220, and combined 322−221 and 321−220 .The locations of source names are taken from Davis et al. (2007), Reipurth & Schneider (2008), and Ching et al. (2022). |
3.3 Line ratios of H2CO
As mentioned in Sects. 1 and 2, H2CO 322−221/303−202 and 321220/303−202 line ratios exhibit similar behaviors in delineating the kinetic temperature of the dense gas (e.g., Mangum & Wootten 1993; Tang et al. 2017a). The present study employs the averaged ratio of H2CO 0.5 × [(322−221 + 321−220)/303−202] (obtained from the combined H2CO 322−221 and 321−220 to H2CO 303−202 ratio) as an indicator of the kinetic temperature. Substantially, higher H2CO line ratios typically correspond to higher kinetic temperatures (Ao et al. 2013; Ginsburg et al. 2016; Tang et al. 2018a, 2021). Thus, the ratio maps may function as a proxy for the relative kinetic temperature. The line ratio map of the DR21 filament is shown in the left panel of Fig. 4. The line ratios are calculated by velocity-integrated intensities where the combined H2CO 322−221 and 321 −220 lines are detected with S/Ns of ≳ 3σ. The H2CO line ratios range from 0.08 to 0.42 with an average value of 0.22 ± 0.01 in the DR21 filament. Higher H2CO line ratios (>0.35) have been observed in association with dense clumps, such as W75SFIR3, DR21(OH), DR21(OH)S, DR21, and DR21W1. Moderate line ratios ranging from 0.2 to 0.35 are prevalent throughout the vicinity of these dense clumps. Notably, the outskirts of the DR21 and the area located between DR21(OH) and W75S exhibit relatively lower line ratios (<0.2).
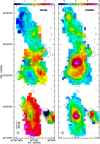 |
Fig. 2 Intensity-weighted velocity field (moment 1, left) and line width (moment 2, right) of H2CO 303−202. The unit of each color bar is km s−1. Contours are H2CO 303−202 integrated intensities (same as in Fig. 1). |
3.4 Kinetic temperatures derived from H2CO line ratios
As described in Sects. 2 and 3.3, the determination of the kinetic temperature involves calculating the averaged ratio of H2CO 0.5 × [(322−221 + 321 −220)/303−202]. To model the relationship between the gas kinetic temperature and the measured average of H2CO 0.5 × [(322−221 +321 −220)/303−202] ratios, we employed the RADEX4 non-LTE model (van der Tak et al. 2007) with collision rates provided by Wiesenfeld & Faure (2013). In Fig. B.1, we adopted a background temperature of 2.73 K, an average measured line width of 3.8 km s−1, and a column density of N(para-H2CO) = 6.6 × 1013 cm−2. The impact of different column densities of H2CO on the kinetic temperature is found to be minimal when all lines are optically thin, as shown in Fig. 3 in Tang et al. (2017b) or Fig. 4 in Tang et al. (2018a). Additionally, opacities within dense massive star-forming clumps have little effect on the kinetic temperature (Ginsburg et al. 2016; Immer et al. 2016; Tang et al. 2017b, 2018b). We assume that para-H2CO (3−2) is optically thin in DR21 (see below for detailed arguments). The measured H2 number densities, n(H2), of massive dense cores in DR21 range from ~104 to 106 cm−3 (Schneider et al. 2006; Jakob et al. 2007; Cao et al. 2019, 2022). Previous observations have demonstrated that para-H2CO (32) is particularly sensitive to the gas density at ~105 cm−3 (Ginsburg et al. 2016; Immer et al. 2016; Tang et al. 2017b, 2021). Therefore, we adopted an average spatial gas density of 105 cm−3 for the DR21 filament. By utilizing the methodology outlined in Sect. 3.1 of Tang et al. (2017b), we calculated the average column density N(para-H2CO) of the entire DR21 region based on the H2CO (303 −202) average brightness temperature. The resulting value is 6.6 × 1013 cm−2 at a volume density of approximately 105 cm−3. Previous observations of para-H2CO (3−2 and 4−3) toward dense clumps representing various evolutionary stages of high-mass star formation in the Galactic plane suggest an averaged fractional abundance of para-H2CO of ~3.9 × 10⁻¹⁰ (Tang et al. 2018b). The average column density of H2, N(H2), in the DR21 ridge, where the distribution of N(H2) agrees well with that of our H2CO (303−202) lines, is ~4.2 × 1023 cm−2 as determined from the Herschel 70–500 µm continuum data (Hennemann et al. 2012). Subsequently, we can compute a typical fractional abundance of para-H2CO of roughly 1.6 × 10⁻¹⁰ in the DR21 filament using the above-mentioned average H2CO column density of the entire DR21 region, which is in agreement with previous observational results in high-mass star formation regions (Tang et al. 2018b). This supports the reasonability of our RADEX calculations using the average column density N(para-H2CO) in the DR21 region.
Pertaining to kinetic temperatures, it has been observed that subtle variations occur across different column densities at a given H2 number density of 105 cm−3 (Tang et al. 2018a). Specifically, we explored this relationship at column densities of N(para-H2CO)=1.0 × 10¹³, 6.6 × 10¹³, and 1.0 × 1014 cm−2, as depicted in Fig. B.1. It indicates that there exists a slight temperature variation corresponding to different column densities. The temperature differences derived from column densities of N(para-H2CO)=1.0 × 10¹³ and 1.0 × 1014 cm−2, compared to 6.6 × 1013 cm−2, are found to be smaller than the uncertainties in temperature determined from the errors associated with observed H2CO line ratios. Therefore we employed the established correlation between H2CO line ratios and kinetic temperature at a spatial density of 105 cm−3 and a column density of 6.6 × 1013 cm−2 in order to convert the ratio maps into temperature maps in this work. These transformed temperature maps are illustrated in Fig. 4. As previously stated, the measured H2 number densities of massive dense cores within DR21 span from approximately ~ 104 to 106 cm−3. Regarding kinetic temperatures, subtle variations have been noted across different number densities within the range of ~ 104 to 106 cm−3 (see Fig. 5 in Tang et al. 2021). It appears that at n(H2) = 105 cm−3, Tkin consistently exhibits lower values compared to those at 104 to 106 cm−3 by approximately <35% for Tkin ≲ 100 K in Fig. 4.
The applicability of LTE as a reliable approximation for H2CO level populations has been established under certain conditions, namely when the corresponding transitions are optically thin and the targets are characterized by high densities (Mangum & Wootten 1993). By employing the methodology outlined in Tang et al. (2017b; refer to their Eq. (2)) and utilizing the RADEX model, we conducted a comprehensive analysis to investigate the relationship between the kinetic temperature and the combined H2 CO ratio within the LTE regime in Fig. B.1. It indicates a satisfactory agreement between the temperatures obtained from the LTE model and those derived from the RADEX model, under the condition of a spatial gas density of n(H2) = 105 cm−3, as long as the kinetic temperature remains below 100 K.
The kinetic temperature of the warm dense gas in the DR21 region, as indicated by the H2CO line ratios, ranges from 24 to 114 K, with an average temperature of 48.3 ± 0.5 K at a density of n(H2) = 105 cm−3 (see also Table 2). As shown in Fig. 4 and Table 3, it reveals the inhomogeneous temperature distribution of the DR21 region across different subregions of the molecular complex. The H2CO line ratio analysis demonstrates that two dense clumps, DR21(OH) and DR21(OH)S, located within the central parts of the DR21 filament, exhibit noticeably high temperatures exceeding 100 K. The kinetic temperatures of the dense clumps W75S FIR 3, DR21, and DR21W1, albeit lower than in DR21(OH), remain relatively high ranging between 77 to 84 K. Conversely, the gas temperatures of the dense clumps W75S FIR1, W75S FIR2, DR21(OH)N, DR21(OH)W, and DR21S span the range from 38 to 57 K. Table1 provides a summary of the detailed temperature results for all sixteen dense cores apparent in the DR21 filament. In the immediate vicinity of the dense regions such as W75S FIR 3, W75S FIR 2, DR21(OH), DR21(OH)S, and DR21, the kinetic temperatures range between 30 to 45 K. The region located between DR21(OH) and W75S and the outskirts of the DR21 filament exhibit significantly lower temperatures below 40 K.
To address the impact of H2CO (3−2) line saturation on our temperature measurements, we employed the RADEX non-LTE model. This model allowed us to calculate the opacities of H2CO (3−2) lines, adopting an average temperature of Tkin = 48K, an average measured line width of 3.8 km s−1, an H2CO column density of N(para-H2CO) = 6.6 × 1013 cm−2, and a gas volume density of n(H2)= 105 cm−3. The resulting opti-cal depths fort he H2CO 303−202, 322−221, and 321−220 transitions were approximately 1.2, 0.28, and 0.28, respectively. These values suggest that in the location of the dense cores, opacities in the H2CO 303−202 lines may exhibit slight saturation, potentially leading to a slight overestimation of kinetic temperatures by ~20%.
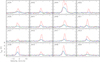 |
Fig. 3 Observed H2CO spectra of the dense cores in the DR21 filament obtained with the IRAM 30 m. Red, green, and blue lines show H2CO 303202 , 321−220, and 322−221, respectively. The dense cores, identified through 1.2mm continuum emission as described by Motte et al. (2007), are referenced for nomenclature, positions, and physical parameters in Table1. |
3.5 Thermal and nonthermal motions obtained from H2CO
The thermal and nonthermal line widths (Pan & Padoan 2009; Dewangan et al. 2016), represented by  and
and  , respectively, are determined based on the kinetic temperature derived from the H2CO line ratios. In this context, k denotes the Boltzmann constant, Tkin corresponds to the kinetic temperature of the gas,
  represents the mass of a formaldehyde molecule, and ∆v signifies the measured FWHM line width of H2CO 303−202. As mentioned in Sect. 2, approximately 70 positions in the DR21(OH) region exhibit two distinct velocity components at about −2 and −4 km s−1 (see also Fig. 3). Additionally, determining the individual gas temperatures for these positions in the two velocity components proved to be challenging. Hence, in this study, we employ the approach of utilizing the averaged line width, which is weighted by the integrated intensity of H2CO 303 −202. By analyzing the data, the thermal line width ranges from 0.08 to 0.18 km s−1 with an average value of 0.11 ± 0.01 km s−1, whereas the nonthermal line width spans from 0.74 to 4.40km s−1 with an average value of 1.60±0.02 km s−1 (see also Table 2). It is apparent that the nonthermal line width significantly exceeds the thermal line width, indicating that the dense gas traced by H2CO is primarily governed by nonthermal motions. These findings align with previous studies conducted on star-forming regions in our Galaxy and the Large Magellanic Cloud using H2CO ( J=3−2 and 4−3) observations (Tang et al. 2017a, 2018a,b, 2021).
The nonthermal line width distribution of H2CO 303−202 is depicted in Fig. 4, showing similarities with the H2CO line width observed in the W75S and DR21 regions. However, a significant disparity in the distribution of nonthermal line width and H2CO line width is observed in the DR21(OH) region, as illustrated in Fig. 2. As mentioned above, the lower values for the nonther-mal line width in the DR21(OH) region can be attributed to the averaging of line widths derived from the two distinct velocity components. In the western region of DR21(OH)N, weak H2CO emission is detected, as depicted in Fig. 2. At many positions in this region, two velocity components are present, but one of them exhibits lower S/Ns, making it challenging to identify it as a significant signal. Consequently, we employed a single Gaussian velocity component to fit the H2CO lines in this specific area, resulting in higher nonthermal line widths in the western region of DR21(OH)N.
Distributions of the Mach number (given as 𝓜 = σNT/as,  , where µ = 2.37 is the mean molecular weight for molecular clouds and mH is the mass of a hydrogen atom) of the DR21 filament is shown in Fig. 4. The Mach number ranges from 1.9 to 10.3 with an average of 4.0 ± 0.1 (see also Table 2).
This suggests that supersonic nonthermal motions (e.g., turbulence, outflows, shocks, and/or magnetic fields) are dominant in the dense gas traced by H2CO. The DR21W1 region, linked to the western DR21 flow, exhibits particularly high Mach numbers (𝓜 ~ 10) as evidenced by previous studies (e.g., Jaffe et al. 1989; Lane et al. 1990; Davis et al. 2007; Zapata et al. 2013).
This association indicates a strong influence of shocks on the dense gas traced by H2CO. Within the dense core of the DR21 region, the Mach numbers are approximately 𝓜 ~ 7, while in the W75S FIR 3 region, they are around 𝓜 ~ 6, slightly lower than those observed in the DR21W1 region. This observation of high Mach numbers suggests that local star formation activities (e.g., outflows, shocks; Davis et al. 2007; Motte et al. 2007; Schneider et al. 2010) in the DR21 and W75S FIR 3 regions may impact the dense gas. In the DR21(OH) region, the Mach numbers are lower (2–3), whereas in the western region of DR21(OH)N, they are higher (6–7). These variations are attributed to the two velocity components mentioned in the above paragraph. Moving toward the outskirts and extended regions of the DR21 filament, the typical Mach number ranges from 2 to 4.
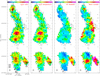 |
Fig. 4 Maps of the parameters in the DR21 filament. Left two panels: the averaged velocity-integrated intensity ratio map of H2CO 0.5 × [(322− 221 + 321 −220)/303−202] in the DR21 filament (see Sect. 3). The kinetic temperatures derived from the H2CO line ratios (color bar in units of Kelvin). Right two panels: maps of nonthermal line width (color bar in units of km s−1 ) and Mach number. The black stars and triangles show the locations of protostars (Davis et al. 2007) and the dense cores (Motte et al. 2007), respectively. The black circle and diamond illustrate the locations of the explosion center as described by Zapata et al. (2013) and the infrared-quiet massive dense core as delineated by Cao et al. (2019), respectively. Black contours show the integrated intensity of H2CO 303−202 at 4.8 K km s−1 (see Fig. 1). |
Parameters of the dense cores in the DR21 filament.
Thermal and nonthermal parameters derived from DR21, OMC-1, and N113.
Comparison of the temperatures and Mach number of different regions.
4 Discussion
4.1 Comparison of temperatures derived from H2CO, NH3, and CO
Ammonia (NH3) is widely recognized as a standard temperature tracer for dense molecular gas (e.g., Ho & Townes 1983). Its unique properties make it an invaluable tool for studying the thermal characteristics of various molecular environments (e.g., Henkel et al. 1987, 2008; Molinari et al. 1996; Jijina et al. 1999; Dunham et al. 2011; Wang et al. 2012; Wienen et al. 2012; Mangum et al. 2013b; Lu et al. 2014, 2017; Ott et al. 2014; Gong et al. 2015a,b; Krieger et al. 2017; Sokolov et al. 2018; Wang et al. 2024; Zhang et al. 2024). In order to investigate the temperature variations across various layers of the molecular cloud, we conducted a comparative analysis between our results of the gas temperature derived from H2CO (32) (with ncrit(H2CO 303−202) ~ few105 cm−3, Shirley 2015) and the previous measurements using NH3 (J, K) = (1,1) and (2,2) (with ncrit(NH3) ~ 103 cm−3, Shirley 2015), specifically within the DR21 filament. As mentioned in Sect. 1, the temperature distribution of gas within the DR21 filament has been charted using NH3 (1,1) and (2,2) with the GBT (beam size ~32″; Keown et al. 2019). Analysis of the NH3 (2,2)/(1,1) line ratios has shown that the kinetic temperature of the dense gas typically ranges between 20 and 30 K. However, there are variations in temperature across different regions (see Table 3). Specifically, the W75S region has a typical temperature of about 20 K, while the DR21(OH) region has temperatures ranging from 22 to 64 K, and the DR21W1 region has temperatures around 35–60 K. High-resolution imaging of the NH3 (1,1) and (2,2) lines within the DR21(OH) region was presented by Mangum et al. (1992), using the VLA with a beam size of ~4″ (~0.03 pc at 1.5 kpc distance). The gas kinetic temperatures of dense ammonia cores derived from line ratios of NH3 (2,2)/(1,1) range from 20 to >80 K, with a typical value of ~30 K. On a larger scale of ~0.23 pc, the temperature distribution derived from our H2CO (3−2) data exhibits similarities to that obtained from NH3 (1,1) and (2,2). Notably, our analysis of H2CO (3−2) consistently reveals higher gas temperatures compared to NH3 (1,1) and (2,2), both within dense clumps and across extended regions of the DR21 filament (see Sect. 3.4 and Table 1). These findings align with previous observations in star-forming regions of the Milky Way, the Large Magellanic Cloud, and our Galactic center clouds (Tang et al. 2017a,b, 2018a,b, 2021; Ginsburg et al. 2016).
Observations conducted using the KOSMA 3 m telescope have provided insights into the gas properties within the DR21 filament region through the analysis of low- to high-J CO lines on a spatial scale of ~0.4pc (Jakob et al. 2007). These observations reveal the presence of two distinct gas components (see Table 3). The cold component exhibits a kinetic temperature ranging from 30 to 40K, while the warm component displays temperatures ranging from 80 to 150 K in regions such as W75SFIR 1, DR21(OH), DR21, and DR21W1, at densities of n(H2) ~ 104−106 cm−3. Furthermore, in these regions, the gas temperatures derived from H2CO line ratios range from 50 to 114K on a spatial scale of ~0.1 pc. Notably, these values align closely with the temperatures obtained from the warm gas component identified through the analysis of CO lines.
The observed disparities likely arise from temperature gradients, as H2CO and NH3 may probe distinct regions within star-forming regions. The H2CO (3−2) lines emerge as an interesting tool for detecting the presence of warm and dense molecular gas within star-forming regions. These transitions are highly sensitive to environments where the gas temperature is elevated, making it an ideal tracer of energetic conditions associated with active star formation. In contrast, the NH3 (1,1) and (2,2) transitions are well-suited for probing the cooler and less dense molecular gas prevalent in these regions. It would be intriguing to conduct mapping of the region using higher excited NH3 transitions (e.g., Henkel et al. 1987, 2008; Mangum et al. 2013b; Lu et al. 2017; Gong et al. 2015a,b; Krieger et al. 2017). This approach would also serve as a valuable tool to verify the authenticity of the high temperatures, ensuring that they are not a result of slightly saturated H2CO 303−202 lines.
4.2 Comparison of temperatures obtained from gas and dust
The gas temperature refers to the kinetic temperature of the gas particles, while the dust temperature reflects the thermal equilibrium of the dust grains. The investigation of gas and dust temperatures in molecular clouds is of paramount importance in understanding the physical conditions within these regions. It is commonly expected that gas and dust are thermally coupled in dense regions (n(H2) ≳ 104 cm−3) due to the increased frequency of interactions between these two components (Goldsmith 2001). Previous observations with NH3 (1,1) and (2,2) lines have consistently demonstrated that the temperatures derived from gas and dust (derived at far-infrared wavelengths) measurements are typically in concordance within the active dense clumps found in Galactic disk clouds (e.g., Dunham et al. 2010; Giannetti et al. 2013; Battersby et al. 2014; Merello et al. 2019; Tursun et al. 2020; Zhang et al. 2024). However, it should be noted that gas temperatures obtained from H2CO (3−2 and 4−3) lines do not exhibit agreement with FIR-derived dust measurements in both our Galactic star-forming regions (Tang et al. 2017a, 2018a,b) and Galactic center clouds (Ao et al. 2013; Ginsburg et al. 2016; Immer et al. 2016).
As detailed in Sect. 1, the dust temperature distribution within the DR21 filament has been established through analyzing Herschel continuum data observed at 70–500 µm (beam size ~40″), as reported by both Hennemann et al. (2012) and Cao et al. (2019). The analysis reveals that the dense clumps within our observed region of the DR21 filament exhibit a range of dust temperatures spanning from 15 to 35 K (see Table 3). The typical value, approximately 20 K, is found to be similar to the gas temperature derived from the NH3 (2,2)/(1,1) line ratios (Mangum et al. 1992; Keown et al. 2019), albeit lower than the results obtained from the H2CO line ratios (see Sect. 3.4 and Table 1). These findings align with previous observational results in star-forming regions within our galaxy (Tang et al. 2017a, 2018a,b).
In order to facilitate a comparison between the temperatures derived from gas and dust on a larger scale, we have applied a smoothing technique to our H2CO data, resulting in a beam size of ~40″. The peak temperatures obtained from this analysis are approximately 80, 95, 80, and 75 K in the W75S FIR3, DR21(OH), DR21(OH)S, and DR21 regions, respectively. It is worth noting that these values remain higher than the temperatures measured using NH3 and dust emission at FIR wavelengths. The structure of dust temperature closely resembles that of the gas temperature obtained through NH3 and H2CO observations on a scale of ~0.3 pc in the DR21 filament. It is important to note that the emission of dust at FIR wavelengths primarily originates from colder dust components which may not be directly associated with the process of star formation (e.g., Mangum et al. 2013b; Tang et al. 2018a). In comparison to temperature measurements utilizing NH3 (1,1) and (2,2) and the FIR continuum, the H2CO lines trace distinctly higher temperatures. This observation confirms that H2CO may possess sensitivity toward the dense gas that is intimately linked to active star formation.
4.3 Gas heating
Gas heating in star-forming regions is a multifaceted process that holds paramount significance in the formation and evolution of stars. Acquiring a comprehension of the pivotal role played by gas heating in these regions, measurements of temperature are mandatory to elucidate the underlying mechanisms that drive star formation and shape the evolutionary trajectory of galaxies.
4.3.1 Radiative heating
Radiative heating plays a pivotal role in the intricate process of star formation, particularly during the initial phases when protostars coalesce within dense molecular clouds. During this period, protostars accrete material and emit substantial amounts of radiation, which interact with and profoundly influence the surrounding ISM. Radiation transfers energy to the ISM through processes such as photoionization, photodissociation, and the generation of photoelectrons. These energy transfer mechanisms result in the heating of the ISM and serve as driving forces behind the subsequent stages of star formation. Previous studies have conducted observations of several molecules, such as NH3, H2CO, H2CS, CH3CN, CH3CCH, and CH3OH, in regions where massive stars are forming (e.g., Lu et al. 2014; Giannetti et al. 2017; Tang et al. 2018a,b, 2021; Gieser et al. 2019, 2021, 2022, 2023; Lin et al. 2022; Wang & Wang 2023). These observations suggest that the dense gas surrounding embedded infrared sources experiences internal radiative heating on scales of ≲0.11.0pc. As stated in Sects. 3.3 and 3.4, high gas temperatures obtained from H2CO line ratios associate with dense clumps especially in the W75S FIR 3, DR21(OH), DR21(OH)S, and DR21 regions (see Fig. 4). This indicates that the warm dense gas traced by H2CO may be influenced by radiation from internally embedded infrared sources. Furthermore, investigations of CO, [CI], [CII], and [OI] emissions in the DR21 region have revealed that the gas experiences significant radiative heating (Lane et al. 1990; Jakob et al. 2007; Ossenkopf et al. 2010).
To investigate the influence of radiation heating on the extended dense gas surrounding massive clumps within the DR21 filament on a scale of ~0.1–0.3 pc, we conducted a temperature profile analysis of four dense cores situated in the W75S FIR 3, DR21(OH), DR21(OH)S, and DR21 regions (see Fig. 5). These cores, namely N44, N46, N48, and N54, chosen from the respective regions, exhibit distinctly higher kinetic temperatures derived from H2CO line ratios (see Table 1) than those of the surrounding gas. We note that Fig. 4 shows the spatial distribution of the dense core N38 to the west of N44 and N48 (~32″, ~0.24pc), the dense core N42 to the southwest of N46 (~32″, ~0.24pc), the dense core N47 to the north of N46 (~18'', ~0.14pc), and the dense core N53 to the north of N54 (~19'', ~0.14 pc). Due to the limited resolution of our observations (beam size ~12''), we cannot rule out that nearby sources may have influenced the temperature profiles of N44, N46, N48, and N54. To reduce this influence from nearby dense cores, we masked data at the midpoint between selected dense cores and other sources. For the N44 dataset, southern data were masked using a distance threshold exceeding 19″ along the declination axis. In the case of the N46, both northern and southern data were masked at distances greater than 9″ and 15″, respectively. For N48, northern data were masked at a distance exceeding 19″. Similarly, for N54, northern data was masked using a distance exceeding 10″. Additionally, for N44 and N48, data corresponding to the dense core N38 (with a radius of ~16″) was also masked.
In the dense cores N44, N46, and N48, there are significant temperature gradients observed, as depicted in Fig. 5. However, it is worth mentioning that a relatively shallow temperature gradient is detected in dense core N54, which could potentially be attributed to the fact that the dense core is likely in an earlier evolutionary stage (e.g., Motte et al. 2007; Cao et al. 2019), with the embedded protostars or clusters not yet generating sufficient heat to significantly warm the surrounding molecular envelope. As noted above, the dense core N53 is positioned to the north of N54, at a distance of approximately 19″ (~0.14 pc). Previous observations have detected the presence of CH3OH and H2O masers in N53 (e.g., Motte et al. 2007), suggesting the occurrence of significant shocks in this area. Additionally, two protostars were identified in the N53/N54 region by Davis et al. (2007; see Fig. 4). The complex temperature structure observed in the N53/N54 region may be attributed to the impact of outflows and shocks originating from the embedded protostars or clusters within N53 and N54, as well as the radiation emitted by nearby protostars. The temperature profile surrounding these dense clumps can be described by the Stefan-Boltzmann black-body radiation law, expressed as  K, where the luminosity L is given in terms of solar luminosity (L⊙) and the distance R is measured in parsecs. By adjusting the emissivity of dust grains to be smaller than the characteristic black-body temperature wavelength, the radiation law is modified to
  K (Wiseman & Ho 1998; Tang et al. 2018a). The fitted results of the four dense cores are
 (1)
(1)
 (2)
(2)
 (3)
(3)
 (4)
(4)
with power-law indices of −0.54, −0.28, −0.43, and −0.03 for N44, N46, N48, and N54, respectively. With the exception of the dense core N54, the temperature power-law indices obtained from fitting the H2CO line ratios in our study exhibit consistency with previous observational results with a mean value of about −0.4. These results align with previous studies that have utilized various molecular tracers such as H2CO, H2CS, CH3CN, and CH3CCH in the investigation of massive star-forming dense cores (e.g., Gieser et al. 2019, 2021, 2022, 2023; Lin et al. 2022). This indicates that the dense gas heating of the massive cores on a scale of ~0.1−0.3pc in the DR21(OH), DR21(OH)S, and DR21 regions is significantly influenced by internal radiation emitted by associated protostar(s) and/or stellar clusters. The resolution of our observation, ~0.1 pc, does not allow for a thorough measurement of the detailed temperature structures within these dense cores. Consequently, a future high-resolution observation is necessary to address this limitation.
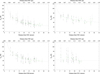 |
Fig. 5 Gas kinetic temperatures were determined by analyzing the H2CO (3−2) line ratios from the central regions of the dense cores N44, N46, N48, and N54 (see Table 1), extending toward their respective edges. The format of the regression fits is |

4.3.2 Explosive heating
Explosive heating in molecular clouds refers to the process by which a large amount of energy is rapidly released, leading to a sudden increase in temperature within these clouds. The increased temperature can trigger chemical reactions, influence the stability of the cloud, and even initiate the formation of new stars. It may play a crucial role in the dynamics and evolution of molecular clouds. Understanding the processes and effects of explosive heating is essential for studying the complex interplay between gas dynamics, star formation, and the overall evolution of molecular clouds. Previous observations of H2CO and H2CS in the Orion KL region have provided evidence that the dense gas in this area experiences heating due to shocks induced by a mysterious explosive event that took place several hundred years ago (e.g., Tang et al. 2018a; Li et al. 2020). This event had a significant impact on the energetics of the Orion KL region. Zapata et al. (2013) proposed that the enigmatic northeast–southwest outflow observed in the DR21 region was likely the result of an explosive event that transpired ~ 10 000 years ago. This event bears resemblance to the disintegration of a massive stellar system, akin to the occurrence witnessed in Orion KL 500 years ago, albeit with approximately 20 times greater energy output. The accurate location of this explosive event in the DR21 region was identified at α2000 = 20h39m01 s.1 and δ2000 = 42° 19′37″.9 by Zapata et al. (2013). At the location of the DR21 outflow origin, there is no presence of a young star in the radio, submillimeter, or infrared wavelengths. This absence suggests that the potential “source” of the outflow may no longer be situated there, similar to the explosive outflow observed in Orion KL (Zapata et al. 2009, 2013).
The explosive event is observed to occur at the center of an expanding cometary H II region in DR21 (see Fig. 3 in Zapata et al. 2013). As previously mentioned, the heating of dense gas in the DR21 region is greatly influenced by the internal radiation emitted by the associated protostar(s) and/or stellar clusters. In the star formation region of DR21, differentiating between radiation and explosive heating can be challenging but can be done by considering the detailed spatial distribution of Tkin. Radiation heating is usually more evenly distributed throughout a star-forming region, as it originates from the young stars themselves. Explosive heating, however, may exhibit localized regions of enhanced heating, corresponding to the locations of energetic events (e.g., Tang et al. 2018a; Li et al. 2020). Previous observations suggest that H2CO could serve as a promising indicator for detecting outflows or shocks (e.g., Tang et al. 2017b; Lu et al. 2021; Izumi et al. 2024). As stated in Sect. 3.5, the DR21 region exhibits substantial nonthermal line widths (σNT~2.3km s−1 ) and Mach numbers (𝓜 ~ 4.5), as depicted in Fig. 4. Their correlation suggests that the dense gas, which is traced by H2CO, may be influenced by the shocks resulting from explosive flows and/or expanding H II regions. To investigate the impact of the explosive event on the heating of dense gas in the DR21 region, we conducted an analysis of the temperature structure within the dense core N46 (see Figs. 4 and 5) which is located at the putative position of the supposed explosive event (Zapata et al. 2013). The analysis of H2CO data reveals that the gas temperature within the dense core N46 of the DR21 region is measured to be 77 K. This temperature is lower than that observed in the dense cores N44 and N48 of the DR21(OH) and DR21(OH)S regions. Furthermore, the temperature gradient observed in the DR21 region is flatter when compared to the temperature gradients observed in the DR21(OH) and DR21(OH)S regions (see Fig. 5). As previously noted, the dense gas may exhibit localized regions of increased heat when subjected to heating by an explosive event. However, a relatively uniform temperature gradient in the DR21 region is inconsistent with this pattern of explosive heating. As delineated in the preceding section, the temperature profile derived from the dense core N46 aligns with the results anticipated from radiation heating. The heating of the dense gas in the DR21 region may be partly attributed to the shocks generated by an explosive event that occurred a long time ago. However, our temperature measurements with H2CO do not provide direct evidence to support the hypothesis that the dense gas is heated by shocks resulting from a past explosive event on a scale of ~0.1 pc in the DR21 region.
Zapata et al. (2013) proposed that the DR21 northeast-southwest outflow was likely generated by a powerful explosion occurring ~10,000 years ago. However, the genesis of the DR21 outflow remains a subject of ongoing investigation (e.g., Skretas et al. 2023). Previous observations suggest that the DR21W1 region is correlated with the western DR21 flow (e.g., Jaffe et al. 1989; Lane et al. 1990; Wilson & Mauersberger 1990; Garden et al. 1991a,b; Garden & Carlstrom 1992; Davis et al. 2007). It appears that a high temperature (~84 K) associates with the dense core N34 in the DR21W1 region (see Fig. 4). A flat temperature structure, analogous to that of the DR21 region, was detected in the DR21W1 region. The highest nonthermal line widths (σNT ~ 4.4 km s−1 ) and Mach numbers (M~ 10) of the entire DR21 filament are found in the northeastern and southern region of DR21W1 (see Fig. 4). These confirm that the dense gas in the DR21W1 region is strongly influenced by shocks which may be caused by explosive flows. In the DR21W1 region, Cao et al. (2019) discovered an infrared-quiet massive dense core with a luminosity of ~350 L⊙. The absence of strong 8 µm emission in this region (refer to Fig. 1 in Kumar et al. 2007) suggests that the dense core is in an early evolutionary stage. In the study conducted, the gas temperature in the DR21W1 region, which is influenced by young stellar objects (YSOs), was determined using the modified Stefan-Boltzmann blackbody radiation law (refer to Sect. 4.3.1). It was assumed that the embedded YSOs (or YSO candidates) serve as the primary sources of energy in the DR21W1 region, with a luminosity of ~350 L⊙ as reported by Cao et al. (2019). The derived gas temperature from the modified Stefan-Boltzmann blackbody radiation law was found to be ~22 K at radii of 0.1 pc, which is significantly lower than the typical temperature of 70-80 K obtained from the measurements of H2CO line ratios. This indicates that the radiation heating from internal embedded YSOs (or YSO candidates) only affects the local region. The high temperatures of dense gas in the DR21W1 region should be dominated by the shocks from the western DR21 flow. Our measurements of H2CO toward the DR21W1 region provide compelling evidence that the dense gas in this area is heated by shocks which may arise from explosive flows.
4.3.3 Turbulent heating
Turbulence is a prevalent phenomenon observed in various phases of the interstellar medium (Mac Low & Klessen 2004; Elmegreen & Scalo 2004; Scalo & Elmegreen 2004; Sokolov et al. 2018; Wang & Wang 2023; Wang et al. 2024). Recent observations conducted on Galactic Central Molecular Zone clouds using H2CO (3−2 and 4−3) indicate that the warm dense gas is primarily heated by turbulence occurring on a scale of ~1pc (Ao et al. 2013; Ginsburg et al. 2016; Immer et al. 2016). In Galactic massive star-forming regions, it appears that molecular gas heated by turbulence is commonly encountered (Tang et al. 2018a,b, 2021). Notably, multiple observations utilizing molecular tracers, including H2CO, NH3, and CH3CCH, in star formation regions, indicate a significant correlation between line width and gas kinetic temperature (Wouterloot et al. 1988; Molinari et al. 1996; Jijina et al. 1999; Wu et al. 2006; Urquhart et al. 2011, 2015; Wienen et al. 2012; Lu et al. 2014; Giannetti et al. 2017; Tang et al. 2017a, 2018a,b, 2021). As a result, higher temperatures inferred from various tracers align with elevated turbulence levels.
We investigate the potential relationship between turbulence and temperature on a scale of ~0.1 pc within the DR21 filament. To assess turbulence, we utilize the nonthermal line width (σNT) of H2CO, which serves as a reliable indicator. Additionally, we determine the gas kinetic temperature using the H2CO line ratio. Specifically, we focus on positions near dense regions that exhibit strong nonthermal motions (𝓜 ≳ 3.0). As stated in Sect 3.5, the dense gas in locations characterized by higher Mach numbers (𝓜 ≳ 3.0) is significantly impacted by nonthermal motions. Therefore, for our analysis, we specifically choose positions in close proximity to W75S FIR 3, W75S FIR 2, DR21(OH)S, DR21, and DR21W1. In Fig. 6, we present the correlation between the nonthermal line width and gas kinetic temperature for both the H2CO 303−202 line and the combined H2CO 322−221 and 321−220 lines. A power law relationship is fitted, with  for H2CO 303−202 and
  for the combined H2CO 322−221 and 321−220 lines. The correlation coefficients, R, are determined to be 0.45 and 0.55, respectively. These results suggest that the elevated temperature observed in regions of strong nonthermal motion within the DR21 filament, as indicated by H2CO, can be attributed to turbulence occurring at a scale of ~0.1 pc, which aligns with previous observational studies conducted on massive star-forming clumps (ATLASGAL sample, Tang et al. 2018b) and the Orion molecular cloud 1 (OMC-1, Tang et al. 2018a), where similar temperature variations were observed on a scale ranging from approximately 0.06 to 2pc. One should note that this agreement pertains solely to the intercept and not the power law index (see Fig. 6). The power law index fitted in the DR21 filament is approximately 0.41−0.42, which is lower than the previous observational results (
 ) in the ATLASGAL sample and OMC-1 (Tang et al. 2018a,b). As previously mentioned, the dense gas in the DR21 filament is also influenced by various factors, such as outflows, shocks, and/or radiation from regions of massive star formation in W75S, DR21(OH), and DR21. The variation in the power law index could be attributed to the disparity in the contribution fractions of gas heating mechanisms to the gas temperature between the DR21 filament and the ATLASGAL sample, as well as OMC-1.
Assuming that the dominant factor heating the gas is turbulence, we employ the methodology outlined by Tang et al. (2018a) in their Eq. (2) to compute the gas kinetic temperature, denoted as Tturb, resulting from turbulence in the DR21 filament. Our calculations are based on the following assumptions: a gas density of n(H2) = 105 cm−3, a typical velocity gradient of 1 km s−1 pc−1, the nonthermal line width values of H2CO provided in Table 1, a cloud size of ~1 pc, and a dust temperature equal to the gas temperature derived from H2CO. The computed Tturb values are presented in Table 1, revealing a notable correlation between the derived Tturb value and the kinetic temperature obtained from the H2CO line ratio. These results suggest that turbulence plays a significant role in determining the dense gas kinetic temperature on a scale of ~0.1 pc in the DR21 filament.
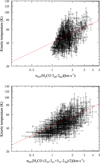 |
Fig. 6 Relationship between the nonthermal line width (σNT) and gas kinetic temperature, as determined from the H2CO line ratio, is examined in those parts of the DR21 filament, which are characterized by a Mach number 𝓜≳ 3.0 (see Sect. 4.3.3). A linear fit is applied to the H2CO 303−202 and the combined H2CO 322-221 and 321−220 lines, yielding the following results: log Tkin = (0.42 ± 0.04) × logσNT + (1.60 ± 0.01) and log Tkin = (0.41 ± 0.03) × log σNT + (1.63 ± 0.01), respectively. In this fitting, the linear fit was performed on the unweighted data using the least squares method. The Pearson correlation coefficients, R, for these fits (red lines) are 0.45 and 0.55, respectively. |
4.4 Comparison with the OMC-1 and N113
The Orion molecular cloud 1 is a well-known target for studying the physical and chemical properties of molecular clouds and their role in star formation. Its complex gas heating has been revealed by observations made with the APEX 12 m telescope over a region of size ~1.1 × 1.7 pc2, where the same H2CO (3−2) lines were mapped on a scale of ~0.06 pc (Tang et al. 2018a). The complex gas heating in the OMC-1 is likely due to multiple processes including star formation activity, radiation, and turbulence. The N113 region, which is located in the Large Magellanic Cloud, is a well-studied site for massive star formation and shows strong molecular line emission (e.g., Tang et al. 2017a, 2021; Gong et al. 2023a). The complex gas heating in N113 was also studied using an ALMA survey over a relatively large area of N113 (~2.4 × 6.1 pc2), where the transitions of the same H2CO (3−2) lines were detected on a linear scale of ~0.4 pc (Tang et al. 2018b). The gas heating process in N113 appears to be as intricate as that of its counterpart in OMC-1.
As discussed above, our observations in the DR21 filament (~ 1.4 × 4.4 pc2) on a scale of ~0.1 pc also indicate the presence of similar gas heating mechanisms as in OMC-1 and N113. In addition, we compare the detailed physical parameters of dense gas, H2CO line ratio, Tkin, σT, σNT, cs, and 𝓜, derived from H2CO(3−2) lines in the DR21 filament, OMC-1, and N113 in Table 2. The median values of these physical parameters in the dense gas within the DR21 filament appear to be nearly identical to the results obtained in OMC-1 and N113 on a scale of ~0.1−0.4 pc (see Table 2). It should be noted that the mean values of nonthermal line width and Mach number in OMC-1 are marginally lower than those observed in DR21 and N113. This discrepancy may be attributed to the superior resolution of OMC-1 (beam size ~0.06 pc) and/or the inherent turbulence fluctuations across various molecular clouds. These similarities in physical parameters suggest that the processes governing the dynamics and thermodynamics of the dense gas traced by H2CO in different star formation regions may share common underlying principles, despite variations in specific environmental conditions. The dense gas in star formation regions is influenced by similar environmental factors, such as gravitational collapse, turbulent motions, and thermal processes, which contribute to the consistency in these parameters across various regions and evolutionary stages. The physical conditions in star-forming regions appear to be shaped by similar mechanisms, leading to the convergence of these parameters. This can include processes such as supersonic turbulence, thermal pressure, and the interaction between magnetic fields and turbulent motions, all of which contribute to the observed similarities in the physical parameters.
5 Summary
The kinetic temperature structure of the massive filament DR21 in the Cygnus X molecular cloud complex has been mapped using the H2CO 218 GHz line triplet observed with the IRAM 30 m telescope. The main results are the following:
- 1.
The H2CO 303−202 emission exhibits an extensive distribution and provides a clear measurement of the dense ridge structure of the DR21 filament.
- 2.
By employing the RADEX non-LTE model, we have determined the gas temperature through the modeling of the measured H2CO 0.5 × [(322−221 + 321−220)303−202] line ratios. The derived gas kinetic temperatures exhibit a range, varying from 24 to 114 K, with an average of 48.3±0.5 K at a spatial density of 105 cm−3. In comparison to temperature measurements utilizing NH3 (1,1)/(2,2) and FIR wavelengths, the H2CO lines trace distinctly higher temperatures.
- 3.
The dense gas, traced by H2CO, exhibiting kinetic temperatures in excess of 50 K appears to be correlated with the dense clumps found in various regions, namely W75S FIR 3, DR21(OH), DR21(OH)W, DR21(OH)S, DR21, and DR21W1. On the other hand, the outskirts of the DR21 filament show lower temperature distributions (Tkin < 50 K).
- 4.
Four dense cores, N44, N46, N48, and N54, located in the DR21(OH), DR21, DR21(OH)S, and W75S FIR3 regions, respectively, exhibit temperature gradients on a scale of approximately 0.1-0.3 pc. This suggests that the warm dense gas traced by H2CO is influenced by internal star formation activity. Unlike the dense core N54, the temperature profiles of these dense cores could be fitted with power-law indices ranging from −0.3 to −0.5, with a mean value of about −0.4, indicating that the warm dense gas probed by H2CO is heated by radiation emitted from internally embedded protostar(s) and/or stellar clusters.
- 5.
In the DR21 region, our temperature measurements toward the dense core N46, located at the putative position of a supposed major explosive event, provide no direct evidence supporting this notion on a scale of ~0.1 pc. Nevertheless, we find compelling evidence that the dense gas in the DR21W1 region is indeed heated by shocks originating from the western DR21 flow.
- 6.
The nonthermal line widths of H2CO exhibit a correlation with the gas kinetic temperatures within the DR21 filament. This suggests that higher temperatures, as traced by H2CO, are associated with turbulence on a scale of ~0.1 pc.
- 7.
The physical parameters of the dense gas, as determined from H2CO lines in the DR21 filament, exhibit a striking similarity to the results obtained in OMC-1 and N113 on a scale of approximately 0.1−0.4 pc. This may imply that the mechanisms governing the dynamics and thermodynamics of dense gas traced by H2CO in diverse star formation regions may be governed by common underlying principles, despite variations in specific environmental conditions.
Acknowledgements
The authors thank the anonymous referee for helpful comments. We thank the staff of the IRAM telescope for their assistance in observations. This work acknowledges the support of the National Key R&D Program of China under grant no. 2023YFA1608002, the Chinese Academy of Sciences (CAS) “Light of West China” Program under grant no. xbzg-zdsys-202212, the Tianshan Talent Program of Xinjiang Uygur Autonomous Region under grant no. 2022TSYCLJ0005, and the Natural Science Foundation of Xinjiang Uygur Autonomous Region under grant no. 2022D01E06. It was also partially supported by the National Key R&D Program of China under grant no. 2022YFA1603103, the Regional Collaborative Innovation Project of Xinjiang Uyghur Autonomous Region under grant no. 2022E01050, the CAS “Light of West China” Program under grant no. 2020-XBQNXZ-017, the National Natural Science Foundation of China under grant nos. 12173075 and 12373029, Xinjiang Key Laboratory of Radio Astrophysics under grant no. 2023D04033, the Natural Science Foundation of Xinjiang Uygur Autonomous Region under grant No. 2022D01A359, and the Youth Innovation Promotion Association CAS. T. Liu, K. Wang, X. P. Chen, and J. W. Wu acknowledge support by the Tianchi Talent Program of Xinjiang Uygur Autonomous Region. C. Henkel acknowledges support by the Chinese Academy of Sciences President’ s International Fellowship Initiative under grant nos. 2023VMA0031 and 2025PVA0048. This research has used NASA’s Astrophysical Data System (ADS).
Appendix A H2CO velocity channel maps
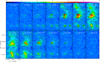 |
Fig. A.1 Channel maps of the H2CO (303−202) transition. The contour levels are running from 0.5 to 2.0 Κ in steps of 0.5 Κ and from 2 to 10 Κ in steps of 1 Κ (Tmb scale; color bar in units of K). |
Appendix B The LTE and non-LTE models for H2CO
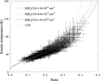 |
Fig. B.1 RADEX non-LTE modeling of the relation between the kinetic temperature and the average ratio of H2CO 322−221/303−202 and 321−220/303−202 with an assumed density of n(H2)=105 cm−3 and column densities N(para-H2CO)=1.0× 10¹³, 6.6 ×10¹³, and 1.0×1014cm−2 (red, green, and blue), the LTE (cyan), and an averaged line width of 3.8 km s−1. The LTE kinetic temperature (TLTE) was determined using the methodology described in Mangum & Wootten (1993) and Tang et al. (2017b). TLTE is calculated as |

References
- Ao, Y., Henkel, C., Menten, K. M., et al. 2013, A&A, 550, A135 [NASA ADS] [CrossRef] [EDP Sciences] [Google Scholar]
- Batria, W., & Menten, K. M. 1988, ApJ, 329, L117 [NASA ADS] [CrossRef] [Google Scholar]
- Battersby, C., Bally, J., Dunham, M., et al. 2014, ApJ, 786, 116 [NASA ADS] [CrossRef] [Google Scholar]
- Beerer, I. M., Koenig, X. P., Hora, J. L., et al. 2010, ApJ, 720, 679 [Google Scholar]
- Bonne, L., Bontemps, S., Schneider, N., et al. 2023, ApJ, 951, 39 [CrossRef] [Google Scholar]
- Brinkmann, N., Wyrowski, F., Kauffmann, J., et al. 2020, A&A, 636, A39 [NASA ADS] [CrossRef] [EDP Sciences] [Google Scholar]
- Cao, Y., Qiu, K., Zhang, Q., et al. 2019, ApJS, 241, 1 [Google Scholar]
- Cao, Y., Qiu, K., Zhang, Q., & Li, G.-X. 2022, ApJ, 927, 106 [NASA ADS] [CrossRef] [Google Scholar]
- Caselli, P., Hasegawa, T. I., & Herbst, E. 1993, ApJ, 408, 548 [Google Scholar]
- Chandler, C. J., Gear, W. K., & Chini, R. 1993, MNRAS, 260, 337 [NASA ADS] [Google Scholar]
- Ching, T.-C., Qiu, K., Li, D., et al. 2022, ApJ, 941, 122 [CrossRef] [Google Scholar]
- Csengeri, T., Bontemps, S., Schneider, N., Motte, F., & Dib, S. 2011, A&A, 527, A135 [NASA ADS] [CrossRef] [EDP Sciences] [Google Scholar]
- Cyganowski, C. J., Reid, M. J., Fish, V. L., & Ho, P. T. P. 2003, ApJ, 596, 344 [Google Scholar]
- Davis, C. J., Kumar, M. S. N., Sandell, G., et al. 2007, MNRAS, 374, 29 [Google Scholar]
- Dewangan, L. K., Ojha, D. K., Luna, A., et al. 2016, ApJ, 819, 66 [CrossRef] [Google Scholar]
- Dobashi, K., Shimoikura, T., Katakura, S., Nakamura, F., & Shimajiri, Y. 2019, PASJ, 71, S12 [NASA ADS] [CrossRef] [Google Scholar]
- Downes, D., Wilson, T. L., Bieging, J., & Wink, J. 1980, A&AS, 40, 379 [NASA ADS] [Google Scholar]
- Dunham, M. K., Rosolowsky, E., Evans, Neal J., I., et al. 2010, ApJ, 717, 1157 [NASA ADS] [CrossRef] [Google Scholar]
- Dunham, M. K., Rosolowsky, E., Evans, Neal J., I., Cyganowski, C., & Urquhart, J. S. 2011, ApJ, 741, 110 [NASA ADS] [CrossRef] [Google Scholar]
- Elmegreen, B. G., & Scalo, J. 2004, ARA&A, 42, 211 [Google Scholar]
- Garden, R. P., & Carlstrom, J. E. 1992, ApJ, 392, 602 [CrossRef] [Google Scholar]
- Garden, R. P., Geballe, T. R., Gatley, I., & Nadeau, D. 1991a, ApJ, 366, 474 [CrossRef] [Google Scholar]
- Garden, R. P., Hayashi, M., Gatley, I., Hasegawa, T., & Kaifu, N. 1991b, ApJ, 374, 540 [NASA ADS] [CrossRef] [Google Scholar]
- Genzel, R., & Downes, D. 1977, A&AS, 30, 145 [NASA ADS] [Google Scholar]
- Gerner, T., Beuther, H., Semenov, D., et al. 2014, A&A, 563, A97 [NASA ADS] [CrossRef] [EDP Sciences] [Google Scholar]
- Giannetti, A., Brand, J., Sánchez-Monge, Á., et al. 2013, A&A, 556, A16 [NASA ADS] [CrossRef] [EDP Sciences] [Google Scholar]
- Giannetti, A., Leurini, S., Wyrowski, F., et al. 2017, A&A, 603, A33 [NASA ADS] [CrossRef] [EDP Sciences] [Google Scholar]
- Gieser, C., Semenov, D., Beuther, H., et al. 2019, A&A, 631, A142 [NASA ADS] [CrossRef] [EDP Sciences] [Google Scholar]
- Gieser, C., Beuther, H., Semenov, D., et al. 2021, A&A, 648, A66 [EDP Sciences] [Google Scholar]
- Gieser, C., Beuther, H., Semenov, D., et al. 2022, A&A, 657, A3 [CrossRef] [EDP Sciences] [Google Scholar]
- Gieser, C., Beuther, H., Semenov, D., et al. 2023, A&A, 674, A160 [NASA ADS] [CrossRef] [EDP Sciences] [Google Scholar]
- Ginsburg, A., Darling, J., Battersby, C., Zeiger, B., & Bally, J. 2011, ApJ, 736, 149 [NASA ADS] [CrossRef] [Google Scholar]
- Ginsburg, A., Henkel, C., Ao, Y., et al. 2016, A&A, 586, A50 [NASA ADS] [CrossRef] [EDP Sciences] [Google Scholar]
- Goldsmith, P. F. 2001, ApJ, 557, 736 [Google Scholar]
- Gong, Y., Henkel, C., Spezzano, S., et al. 2015a, A&A, 574, A56 [NASA ADS] [CrossRef] [EDP Sciences] [Google Scholar]
- Gong, Y., Henkel, C., Thorwirth, S., et al. 2015b, A&A, 581, A48 [NASA ADS] [CrossRef] [EDP Sciences] [Google Scholar]
- Gong, Y., Henkel, C., Menten, K. M., et al. 2023a, A&A, 679, A6 [NASA ADS] [CrossRef] [EDP Sciences] [Google Scholar]
- Gong, Y., Ortiz-León, G. N., Rugel, M. R., et al. 2023b, A&A, 678, A130 [NASA ADS] [CrossRef] [EDP Sciences] [Google Scholar]
- Guo, W. H., Esimbek, J., Di Tang, X., et al. 2016, Ap&SS, 361, 264 [NASA ADS] [CrossRef] [Google Scholar]
- Harris, S. 1973, MNRAS, 162, 5P [NASA ADS] [Google Scholar]
- Harvey, P. M., Joy, M., Lester, D. F., & Wilking, B. A. 1986, ApJ, 300, 737 [Google Scholar]
- Harvey-Smith, L., Soria-Ruiz, R., Duarte-Cabral, A., & Cohen, R. J. 2008, MNRAS, 384, 719 [CrossRef] [Google Scholar]
- Henkel, C., Walmsley, C. M., & Wilson, T. L. 1980, A&A, 82, 41 [NASA ADS] [Google Scholar]
- Henkel, C., Wilson, T. L., Walmsley, C. M., & Pauls, T. 1983, A&A, 127, 388 [NASA ADS] [Google Scholar]
- Henkel, C., Wilson, T. L., & Mauersberger, R. 1987, A&A, 182, 137 [NASA ADS] [Google Scholar]
- Henkel, C., Braatz, J. A., Menten, K. M., & Ott, J. 2008, A&A, 485, 451 [NASA ADS] [CrossRef] [EDP Sciences] [Google Scholar]
- Hennemann, M., Motte, F., Schneider, N., et al. 2012, A&A, 543, A3 [Google Scholar]
- Ho, P. T. P., & Townes, C. H. 1983, ARA&A, 21, 239 [NASA ADS] [CrossRef] [Google Scholar]
- Hurt, R. L., Barsony, M., & Wootten, A. 1996, ApJ, 456, 686 [NASA ADS] [CrossRef] [Google Scholar]
- Immer, K., Kauffmann, J., Pillai, T., Ginsburg, A., & Menten, K. M. 2016, A&A, 595, A94 [NASA ADS] [CrossRef] [EDP Sciences] [Google Scholar]
- Izumi, N., Sanhueza, P., Koch, P. M., et al. 2024, ApJ, 963, 163 [NASA ADS] [CrossRef] [Google Scholar]
- Jaffe, D. T., Genzel, R., Harris, A. I., et al. 1989, ApJ, 344, 265 [NASA ADS] [CrossRef] [Google Scholar]
- Jakob, H., Kramer, C., Simon, R., et al. 2007, A&A, 461, 999 [NASA ADS] [CrossRef] [EDP Sciences] [Google Scholar]
- Jijina, J., Myers, P. C., & Adams, F. C. 1999, ApJS, 125, 161 [Google Scholar]
- Johnstone, D., Boonman, A. M. S., & van Dishoeck, E. F. 2003, A&A, 412, 157 [NASA ADS] [CrossRef] [EDP Sciences] [Google Scholar]
- Johnston, K. G., Beuther, H., Linz, H., et al. 2014, A&A, 568, A56 [NASA ADS] [CrossRef] [EDP Sciences] [Google Scholar]
- Kahle, K. A., Hernández-Gómez, A., Wyrowski, F., & Menten, K. M. 2023, A&A, 673, A143 [NASA ADS] [CrossRef] [EDP Sciences] [Google Scholar]
- Kennicutt, Robert C., J. 1998a, ARA&A, 36, 189 [Google Scholar]
- Kennicutt, Robert C., J. 1998b, ApJ, 498, 541 [NASA ADS] [CrossRef] [Google Scholar]
- Keown, J., Di Francesco, J., Rosolowsky, E., et al. 2019, ApJ, 884, 4 [Google Scholar]
- Klessen, R. S., Spaans, M., & Jappsen, A.-K. 2007, MNRAS, 374, L29 [NASA ADS] [CrossRef] [Google Scholar]
- Kogan, L., & Slysh, V. 1998, ApJ, 497, 800 [NASA ADS] [CrossRef] [Google Scholar]
- Krieger, N., Ott, J., Beuther, H., et al. 2017, ApJ, 850, 77 [NASA ADS] [CrossRef] [Google Scholar]
- Kumar, M. S. N., Davis, C. J., Grave, J. M. C., Ferreira, B., & Froebrich, D. 2007, MNRAS, 374, 54 [CrossRef] [Google Scholar]
- Lane, A. P., Haas, M. R., Hollenbach, D. J., & Erickson, E. F. 1990, ApJ, 361, 132 [NASA ADS] [CrossRef] [Google Scholar]
- Li, D., Tang, X., Henkel, C., et al. 2020, ApJ, 901, 62 [NASA ADS] [CrossRef] [Google Scholar]
- Lin, Y., Wyrowski, F., Liu, H. B., et al. 2022, A&A, 658, A128 [NASA ADS] [CrossRef] [EDP Sciences] [Google Scholar]
- Lindberg, J. E., Jørgensen, J. K., Watanabe, Y., et al. 2015, A&A, 584, A28 [NASA ADS] [CrossRef] [EDP Sciences] [Google Scholar]
- Liu, H.-L., Sanhueza, P., Liu, T., et al. 2020, ApJ, 901, 31 [NASA ADS] [CrossRef] [Google Scholar]
- Lu, X., Zhang, Q., Liu, H. B., Wang, J., & Gu, Q. 2014, ApJ, 790, 84 [NASA ADS] [CrossRef] [Google Scholar]
- Lu, X., Zhang, Q., Kauffmann, J., et al. 2017, ApJ, 839, 1 [NASA ADS] [CrossRef] [Google Scholar]
- Lu, X., Li, S., Ginsburg, A., et al. 2021, ApJ, 909, 177 [NASA ADS] [CrossRef] [Google Scholar]
- Mac Low, M.-M., & Klessen, R. S. 2004, Rev. Mod. Phys., 76, 125 [Google Scholar]
- Mangum, J. G., & Wootten, A. 1993, ApJS, 89, 123 [Google Scholar]
- Mangum, J. G., Wootten, A., Loren, R. B., & Wadiak, E. J. 1990, ApJ, 348, 542 [NASA ADS] [CrossRef] [Google Scholar]
- Mangum, J. G., Wootten, A., & Mundy, L. G. 1992, ApJ, 388, 467 [NASA ADS] [CrossRef] [Google Scholar]
- Mangum, J. G., Wootten, A., & Plambeck, R. L. 1993, ApJ, 409, 282 [Google Scholar]
- Mangum, J. G., Wootten, A., & Barsony, M. 1999, ApJ, 526, 845 [NASA ADS] [CrossRef] [Google Scholar]
- Mangum, J. G., Darling, J., Menten, K. M., & Henkel, C. 2008, ApJ, 673, 832 [NASA ADS] [CrossRef] [Google Scholar]
- Mangum, J. G., Darling, J., Henkel, C., & Menten, K. M. 2013a, ApJ, 766, 108 [NASA ADS] [CrossRef] [Google Scholar]
- Mangum, J. G., Darling, J., Henkel, C., et al. 2013b, ApJ, 779, 33 [CrossRef] [Google Scholar]
- Mangum, J. G., Ginsburg, A. G., Henkel, C., et al. 2019, ApJ, 871, 170 [NASA ADS] [CrossRef] [Google Scholar]
- Marston, A. P., Reach, W. T., Noriega-Crespo, A., et al. 2004, ApJS, 154, 333 [NASA ADS] [CrossRef] [Google Scholar]
- Mazumdar, P., Tram, L. N., Wyrowski, F., Menten, K. M., & Tang, X. 2022, A&A, 668, A180 [NASA ADS] [CrossRef] [EDP Sciences] [Google Scholar]
- Merello, M., Molinari, S., Rygl, K. L. J., et al. 2019, MNRAS, 483, 5355 [NASA ADS] [CrossRef] [Google Scholar]
- Molinari, S., Brand, J., Cesaroni, R., & Palla, F. 1996, A&A, 308, 573 [NASA ADS] [Google Scholar]
- Motte, F., Bontemps, S., Schilke, P., et al. 2007, A&A, 476, 1243 [NASA ADS] [CrossRef] [EDP Sciences] [Google Scholar]
- Mühle, S., Seaquist, E. R., & Henkel, C. 2007, ApJ, 671, 1579 [NASA ADS] [CrossRef] [Google Scholar]
- Nagy, Z., van der Tak, F. F. S., Fuller, G. A., Spaans, M., & Plume, R. 2012, A&A, 542, A6 [Google Scholar]
- Norris, R. P., Booth, R. S., Diamond, P. J., & Porter, N. D. 1982, MNRAS, 201, 191 [NASA ADS] [Google Scholar]
- Ossenkopf, V., Röllig, M., Simon, R., et al. 2010, A&A, 518, A79 [Google Scholar]
- Ott, J., Weiß, A., Staveley-Smith, L., Henkel, C., & Meier, D. S. 2014, ApJ, 785, 55 [NASA ADS] [CrossRef] [Google Scholar]
- Pan, L., & Padoan, P. 2009, ApJ, 692, 594 [NASA ADS] [CrossRef] [Google Scholar]
- Papadopoulos, P. P., Thi, W.-F., Miniati, F., & Viti, S. 2011, MNRAS, 414, 1705 [NASA ADS] [CrossRef] [Google Scholar]
- Paumard, T., Genzel, R., Martins, F., et al. 2006, ApJ, 643, 1011 [NASA ADS] [CrossRef] [Google Scholar]
- Qin, S.-L., Zhao, J.-H., Moran, J. M., et al. 2008, ApJ, 677, 353 [NASA ADS] [CrossRef] [Google Scholar]
- Reipurth, B., & Schneider, N. 2008, in Handbook of Star Forming Regions, Volume I, 4, ed. B. Reipurth, 36 [NASA ADS] [Google Scholar]
- Russell, A. P. G., Bally, J., Padman, R., & Hills, R. E. 1992, ApJ, 387, 219 [NASA ADS] [CrossRef] [Google Scholar]
- Rygl, K. L. J., Brunthaler, A., Sanna, A., et al. 2012, A&A, 539, A79 [NASA ADS] [CrossRef] [EDP Sciences] [Google Scholar]
- Scalo, J., & Elmegreen, B. G. 2004, ARA&A, 42, 275 [NASA ADS] [CrossRef] [Google Scholar]
- Schneider, N., Bontemps, S., Simon, R., et al. 2006, A&A, 458, 855 [NASA ADS] [CrossRef] [EDP Sciences] [Google Scholar]
- Schneider, N., Csengeri, T., Bontemps, S., et al. 2010, A&A, 520, A49 [CrossRef] [EDP Sciences] [Google Scholar]
- Schneider, N., Bontemps, S., Motte, F., et al. 2016, A&A, 587, A74 [NASA ADS] [CrossRef] [EDP Sciences] [Google Scholar]
- Schuster, K. F., Boucher, C., Brunswig, W., et al. 2004, A&A, 423, 1171 [NASA ADS] [CrossRef] [EDP Sciences] [Google Scholar]
- Shirley, Y. L. 2015, PASP, 127, 299 [Google Scholar]
- Skretas, I. M., Karska, A., Wyrowski, F., et al. 2023, A&A, 679, A66 [NASA ADS] [CrossRef] [EDP Sciences] [Google Scholar]
- Sokolov, V., Wang, K., Pineda, J. E., et al. 2018, A&A, 611, L3 [NASA ADS] [CrossRef] [EDP Sciences] [Google Scholar]
- Tang, X. D., Esimbek, J., Zhou, J. J., et al. 2013, A&A, 551, A28 [NASA ADS] [CrossRef] [EDP Sciences] [Google Scholar]
- Tang, X.-D., Esimbek, J., Zhou, J.-J., Wu, G., & Okoh, D. 2014, Res. Astron. Astrophys., 14, 959 [Google Scholar]
- Tang, X. D., Henkel, C., Chen, C. H. R., et al. 2017a, A&A, 600, A16 [NASA ADS] [CrossRef] [EDP Sciences] [Google Scholar]
- Tang, X. D., Henkel, C., Menten, K. M., et al. 2017b, A&A, 598, A30 [NASA ADS] [CrossRef] [EDP Sciences] [Google Scholar]
- Tang, X. D., Henkel, C., Menten, K. M., et al. 2018a, A&A, 609, A16 [NASA ADS] [CrossRef] [EDP Sciences] [Google Scholar]
- Tang, X. D., Henkel, C., Wyrowski, F., et al. 2018b, A&A, 611, A6 [NASA ADS] [CrossRef] [EDP Sciences] [Google Scholar]
- Tang, X. D., Henkel, C., Menten, K. M., et al. 2019, A&A, 629, A6 [NASA ADS] [CrossRef] [EDP Sciences] [Google Scholar]
- Tang, X. D., Henkel, C., Menten, K. M., et al. 2021, A&A, 655, A12 [NASA ADS] [CrossRef] [EDP Sciences] [Google Scholar]
- Tursun, K., Esimbek, J., Henkel, C., et al. 2020, A&A, 643, A178 [NASA ADS] [CrossRef] [EDP Sciences] [Google Scholar]
- Urquhart, J. S., Morgan, L. K., Figura, C. C., et al. 2011, MNRAS, 418, 1689 [NASA ADS] [CrossRef] [Google Scholar]
- Urquhart, J. S., Figura, C. C., Moore, T. J. T., et al. 2015, MNRAS, 452, 4029 [NASA ADS] [CrossRef] [Google Scholar]
- Vallée, J. P., & Fiege, J. D. 2006, ApJ, 636, 332 [CrossRef] [Google Scholar]
- van der Tak, F. F. S., Black, J. H., Schöier, F. L., Jansen, D. J., & van Dishoeck, E. F. 2007, A&A, 468, 627 [NASA ADS] [CrossRef] [EDP Sciences] [Google Scholar]
- Wang, C., & Wang, K. 2023, A&A, 674, A46 [NASA ADS] [CrossRef] [EDP Sciences] [Google Scholar]
- Wang, K., Zhang, Q., Wu, Y., Li, H.-b., & Zhang, H. 2012, ApJ, 745, L30 [NASA ADS] [CrossRef] [Google Scholar]
- Wang, C., Wang, K., Xu, F.-W., et al. 2024, A&A, 681, A51 [NASA ADS] [CrossRef] [EDP Sciences] [Google Scholar]
- Watanabe, T., & Mitchell, G. F. 2008, AJ, 136, 1947 [NASA ADS] [CrossRef] [Google Scholar]
- Wienen, M., Wyrowski, F., Schuller, F., et al. 2012, A&A, 544, A146 [NASA ADS] [CrossRef] [EDP Sciences] [Google Scholar]
- Wiesenfeld, L., & Faure, A. 2013, MNRAS, 432, 2573 [NASA ADS] [CrossRef] [Google Scholar]
- Wilson, T. L., & Mauersberger, R. 1990, A&A, 239, 305 [NASA ADS] [Google Scholar]
- Wiseman, J. J., & Ho, P. T. P. 1998, ApJ, 502, 676 [NASA ADS] [CrossRef] [Google Scholar]
- Wouterloot, J. G. A., Walmsley, C. M., & Henkel, C. 1988, A&A, 203, 367 [NASA ADS] [Google Scholar]
- Wu, Y., Zhang, Q., Yu, W., et al. 2006, A&A, 450, 607 [NASA ADS] [CrossRef] [EDP Sciences] [Google Scholar]
- Yan, Y. T., Zhang, J. S., Henkel, C., et al. 2019, ApJ, 877, 154 [Google Scholar]
- Zapata, L. A., Schmid-Burgk, J., Ho, P. T. P., Rodríguez, L. F., & Menten, K. M. 2009, ApJ, 704, L45 [Google Scholar]
- Zapata, L. A., Loinard, L., Su, Y. N., et al. 2012, ApJ, 744, 86 [Google Scholar]
- Zapata, L. A., Schmid-Burgk, J., Pérez-Goytia, N., et al. 2013, ApJ, 765, L29 [NASA ADS] [CrossRef] [Google Scholar]
- Zhang, Z.-Y., Romano, D., Ivison, R. J., Papadopoulos, P. P., & Matteucci, F. 2018, Nature, 558, 260 [Google Scholar]
- Zhang, X., Qiu, K., Zhang, Q., et al. 2024, A&A, 684, A142 [NASA ADS] [CrossRef] [EDP Sciences] [Google Scholar]
Based on observations obtained with the IRAM 30 m telescope. IRAM is supported by INSU/CNRS (France), MPG (Germany), and IGN (Spain).
All Tables
All Figures
|
Fig. 1 Velocity-integrated intensity maps (Tmb scale; color bar in units of K km s−1) of H2CO 303 −202 (left), 322−221 (center left), 321−220 (center right), and averaged 322−221 and 321−220 (right), integrated from VLSR = −10 to 4 km s−1 of the DR21 filament. Contour levels are from 4.8 to 12K km s−1 with steps of 1.8K km s−1 and from 12 to 59 K km s−1 with steps of 3.6K km s−1 for H2CO303−202, and from 1.7 to 4.4K km s−1 with steps of 0.66K km s−1 and from 4.3 to 21.2 K km s−1 with steps of 1.3K km s−1 for H2CO 322 −221, 321−220, and combined 322−221 and 321−220 .The locations of source names are taken from Davis et al. (2007), Reipurth & Schneider (2008), and Ching et al. (2022). |
| In the text | |
|
Fig. 2 Intensity-weighted velocity field (moment 1, left) and line width (moment 2, right) of H2CO 303−202. The unit of each color bar is km s−1. Contours are H2CO 303−202 integrated intensities (same as in Fig. 1). |
| In the text | |
|
Fig. 3 Observed H2CO spectra of the dense cores in the DR21 filament obtained with the IRAM 30 m. Red, green, and blue lines show H2CO 303202 , 321−220, and 322−221, respectively. The dense cores, identified through 1.2mm continuum emission as described by Motte et al. (2007), are referenced for nomenclature, positions, and physical parameters in Table1. |
| In the text | |
|
Fig. 4 Maps of the parameters in the DR21 filament. Left two panels: the averaged velocity-integrated intensity ratio map of H2CO 0.5 × [(322− 221 + 321 −220)/303−202] in the DR21 filament (see Sect. 3). The kinetic temperatures derived from the H2CO line ratios (color bar in units of Kelvin). Right two panels: maps of nonthermal line width (color bar in units of km s−1 ) and Mach number. The black stars and triangles show the locations of protostars (Davis et al. 2007) and the dense cores (Motte et al. 2007), respectively. The black circle and diamond illustrate the locations of the explosion center as described by Zapata et al. (2013) and the infrared-quiet massive dense core as delineated by Cao et al. (2019), respectively. Black contours show the integrated intensity of H2CO 303−202 at 4.8 K km s−1 (see Fig. 1). |
| In the text | |
|
Fig. 5 Gas kinetic temperatures were determined by analyzing the H2CO (3−2) line ratios from the central regions of the dense cores N44, N46, N48, and N54 (see Table 1), extending toward their respective edges. The format of the regression fits is |
| In the text | |
|
Fig. 6 Relationship between the nonthermal line width (σNT) and gas kinetic temperature, as determined from the H2CO line ratio, is examined in those parts of the DR21 filament, which are characterized by a Mach number 𝓜≳ 3.0 (see Sect. 4.3.3). A linear fit is applied to the H2CO 303−202 and the combined H2CO 322-221 and 321−220 lines, yielding the following results: log Tkin = (0.42 ± 0.04) × logσNT + (1.60 ± 0.01) and log Tkin = (0.41 ± 0.03) × log σNT + (1.63 ± 0.01), respectively. In this fitting, the linear fit was performed on the unweighted data using the least squares method. The Pearson correlation coefficients, R, for these fits (red lines) are 0.45 and 0.55, respectively. |
| In the text | |
|
Fig. A.1 Channel maps of the H2CO (303−202) transition. The contour levels are running from 0.5 to 2.0 Κ in steps of 0.5 Κ and from 2 to 10 Κ in steps of 1 Κ (Tmb scale; color bar in units of K). |
| In the text | |
|
Fig. B.1 RADEX non-LTE modeling of the relation between the kinetic temperature and the average ratio of H2CO 322−221/303−202 and 321−220/303−202 with an assumed density of n(H2)=105 cm−3 and column densities N(para-H2CO)=1.0× 10¹³, 6.6 ×10¹³, and 1.0×1014cm−2 (red, green, and blue), the LTE (cyan), and an averaged line width of 3.8 km s−1. The LTE kinetic temperature (TLTE) was determined using the methodology described in Mangum & Wootten (1993) and Tang et al. (2017b). TLTE is calculated as |
| In the text | |
Current usage metrics show cumulative count of Article Views (full-text article views including HTML views, PDF and ePub downloads, according to the available data) and Abstracts Views on Vision4Press platform.
Data correspond to usage on the plateform after 2015. The current usage metrics is available 48-96 hours after online publication and is updated daily on week days.
Initial download of the metrics may take a while.