Fig. 5
Download original image
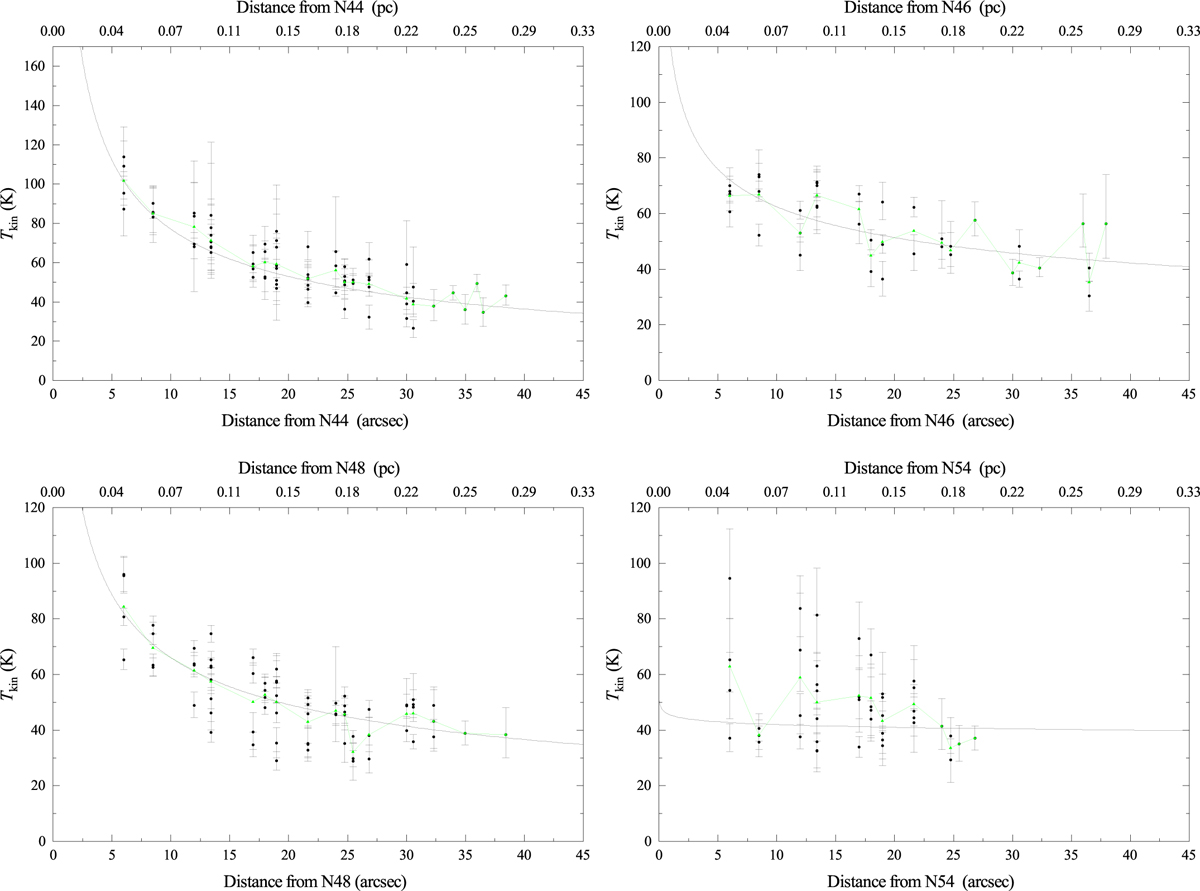
Gas kinetic temperatures were determined by analyzing the H2CO (3−2) line ratios from the central regions of the dense cores N44, N46, N48, and N54 (see Table 1), extending toward their respective edges. The format of the regression fits is ![]() K while the fitting method is the Levenberg-Marquardt method without the error of temperature, and the Reduced Chi-Squared values for N44, N46, N48, and N54 are 1.7, 3.3, 5.7, and 1.9, respectively. The average kinetic temperature at each projected distance is represented by green triangles. The green line represents the connection of the each average kinetic temperature, while the fitted results for H2CO are depicted by black lines.
K while the fitting method is the Levenberg-Marquardt method without the error of temperature, and the Reduced Chi-Squared values for N44, N46, N48, and N54 are 1.7, 3.3, 5.7, and 1.9, respectively. The average kinetic temperature at each projected distance is represented by green triangles. The green line represents the connection of the each average kinetic temperature, while the fitted results for H2CO are depicted by black lines.
Current usage metrics show cumulative count of Article Views (full-text article views including HTML views, PDF and ePub downloads, according to the available data) and Abstracts Views on Vision4Press platform.
Data correspond to usage on the plateform after 2015. The current usage metrics is available 48-96 hours after online publication and is updated daily on week days.
Initial download of the metrics may take a while.