Fig. 4
Download original image
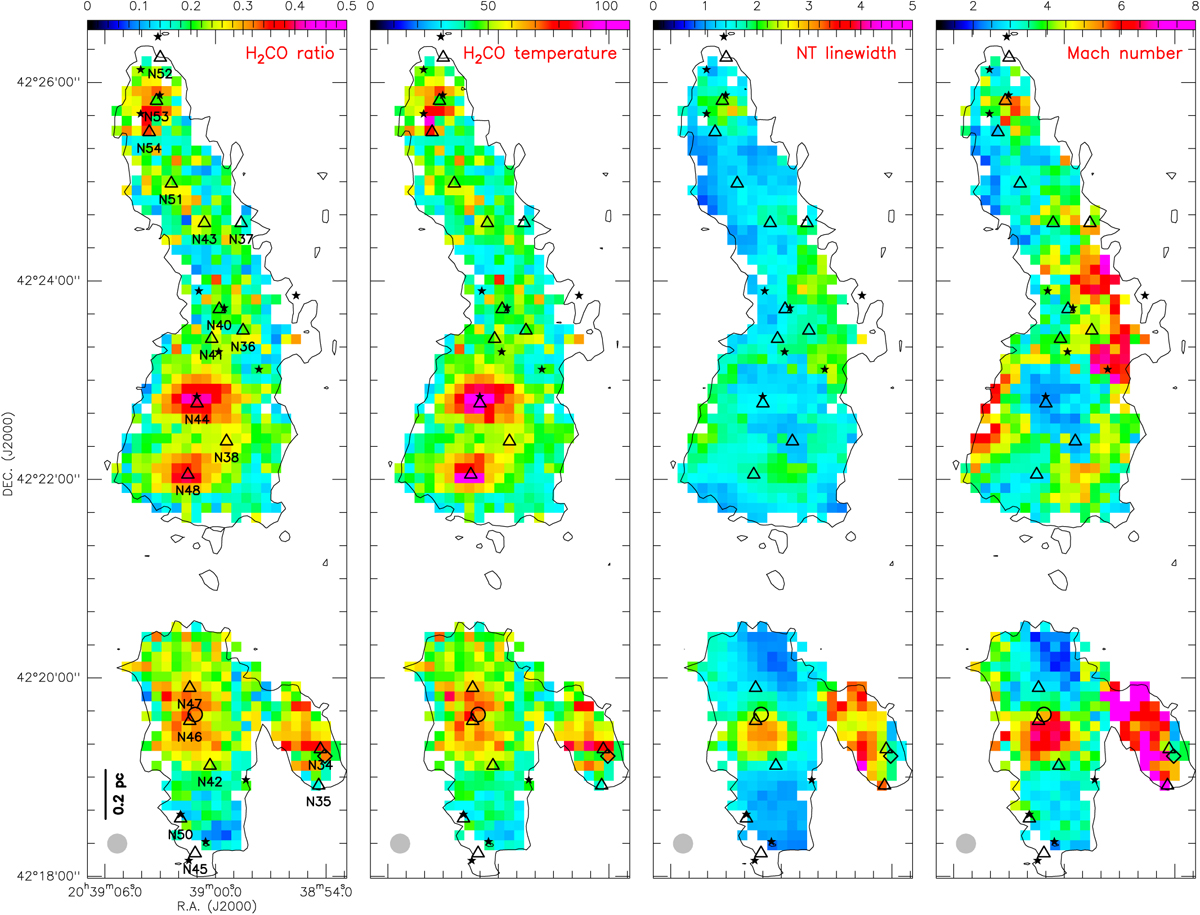
Maps of the parameters in the DR21 filament. Left two panels: the averaged velocity-integrated intensity ratio map of H2CO 0.5 × [(322− 221 + 321 −220)/303−202] in the DR21 filament (see Sect. 3). The kinetic temperatures derived from the H2CO line ratios (color bar in units of Kelvin). Right two panels: maps of nonthermal line width (color bar in units of km s−1 ) and Mach number. The black stars and triangles show the locations of protostars (Davis et al. 2007) and the dense cores (Motte et al. 2007), respectively. The black circle and diamond illustrate the locations of the explosion center as described by Zapata et al. (2013) and the infrared-quiet massive dense core as delineated by Cao et al. (2019), respectively. Black contours show the integrated intensity of H2CO 303−202 at 4.8 K km s−1 (see Fig. 1).
Current usage metrics show cumulative count of Article Views (full-text article views including HTML views, PDF and ePub downloads, according to the available data) and Abstracts Views on Vision4Press platform.
Data correspond to usage on the plateform after 2015. The current usage metrics is available 48-96 hours after online publication and is updated daily on week days.
Initial download of the metrics may take a while.