Fig. 1
Download original image
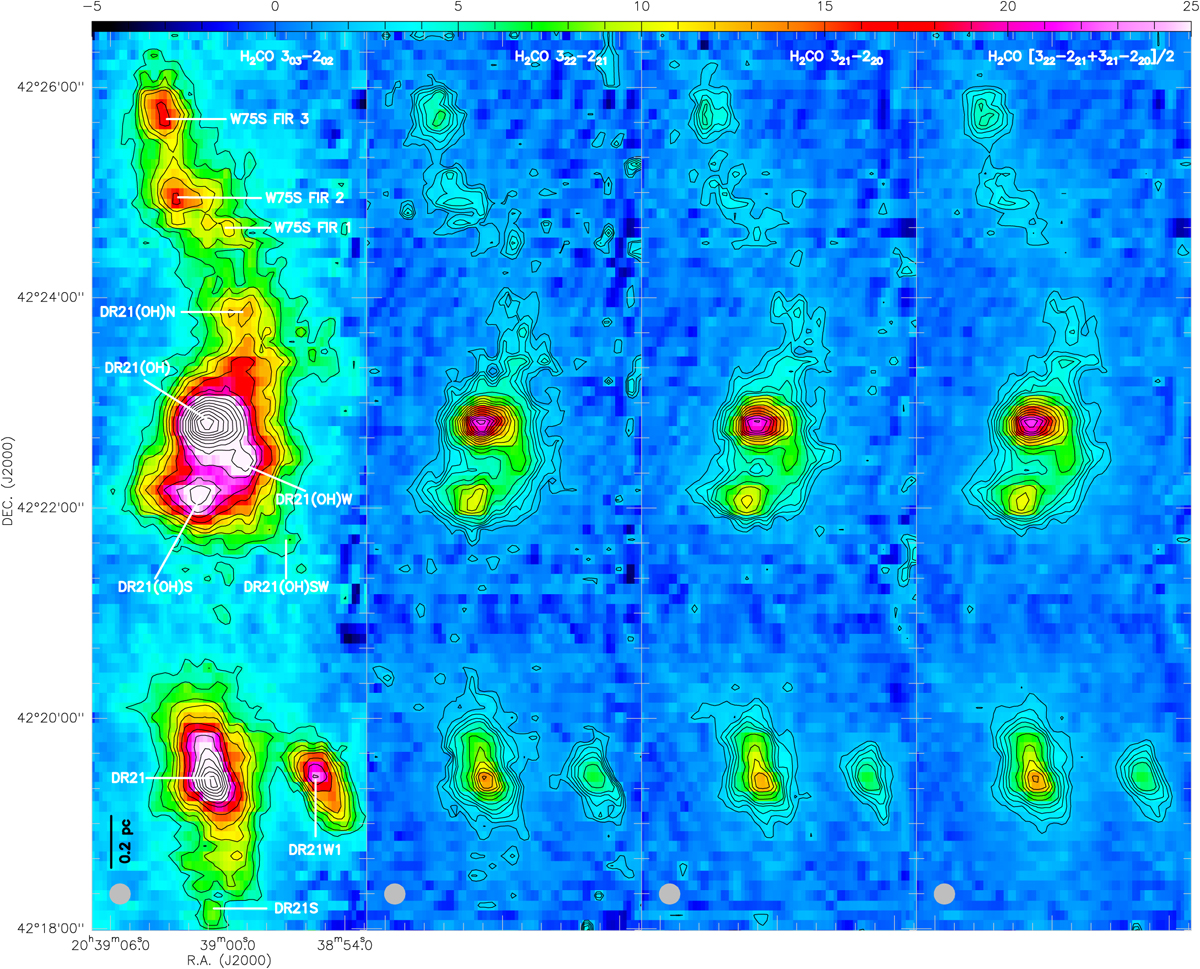
Velocity-integrated intensity maps (Tmb scale; color bar in units of K km s−1) of H2CO 303 −202 (left), 322−221 (center left), 321−220 (center right), and averaged 322−221 and 321−220 (right), integrated from VLSR = −10 to 4 km s−1 of the DR21 filament. Contour levels are from 4.8 to 12K km s−1 with steps of 1.8K km s−1 and from 12 to 59 K km s−1 with steps of 3.6K km s−1 for H2CO303−202, and from 1.7 to 4.4K km s−1 with steps of 0.66K km s−1 and from 4.3 to 21.2 K km s−1 with steps of 1.3K km s−1 for H2CO 322 −221, 321−220, and combined 322−221 and 321−220 .The locations of source names are taken from Davis et al. (2007), Reipurth & Schneider (2008), and Ching et al. (2022).
Current usage metrics show cumulative count of Article Views (full-text article views including HTML views, PDF and ePub downloads, according to the available data) and Abstracts Views on Vision4Press platform.
Data correspond to usage on the plateform after 2015. The current usage metrics is available 48-96 hours after online publication and is updated daily on week days.
Initial download of the metrics may take a while.