Fig. 3
Download original image
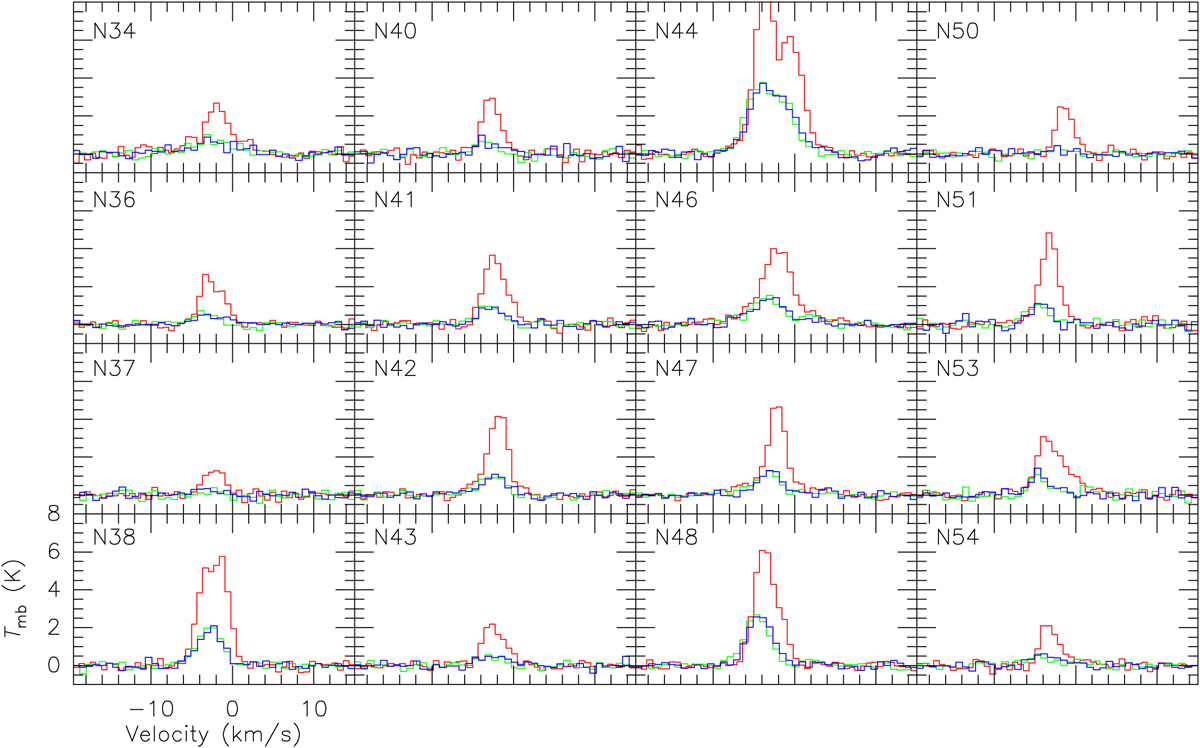
Observed H2CO spectra of the dense cores in the DR21 filament obtained with the IRAM 30 m. Red, green, and blue lines show H2CO 303202 , 321−220, and 322−221, respectively. The dense cores, identified through 1.2mm continuum emission as described by Motte et al. (2007), are referenced for nomenclature, positions, and physical parameters in Table1.
Current usage metrics show cumulative count of Article Views (full-text article views including HTML views, PDF and ePub downloads, according to the available data) and Abstracts Views on Vision4Press platform.
Data correspond to usage on the plateform after 2015. The current usage metrics is available 48-96 hours after online publication and is updated daily on week days.
Initial download of the metrics may take a while.