| Issue |
A&A
Volume 686, June 2024
|
|
|---|---|---|
| Article Number | A106 | |
| Number of page(s) | 14 | |
| Section | Galactic structure, stellar clusters and populations | |
| DOI | https://doi.org/10.1051/0004-6361/202348716 | |
| Published online | 03 June 2024 | |
Great Balls of FIRE
III. Modelling black hole mergers from massive star clusters in simulations of galaxies
1
Laboratoire Lagrange, Université Côte d’Azur, Observatoire de la Côte d’Azur, CNRS, Bd de l’Observatoire, 06300 Nice, France
e-mail: This email address is being protected from spambots. You need JavaScript enabled to view it.
2
Department of Physics and Astronomy, University of North Carolina at Chapel Hill, 120 E. Cameron Ave, Chapel Hill, NC 27599, USA
3
Laboratoire Artemis, Université Côte d’Azur, Observatoire de la Côte d’Azur, CNRS, Bd de l’Observatoire, 06300 Nice, France
4
Carnegie Observatories, 813 Santa Barbara St, Pasadena, CA 91101, USA
5
Department of Physics and Astronomy, University of California Irvine, Irvine, CA 92697, USA
6
Institute for Computational Science, University of Zurich, Winterthurerstrasse 190, 8057 Zurich, Switzerland
Received:
23
November
2023
Accepted:
7
March
2024
Abstract
Context. Despite the nearly hundred gravitational-wave detections reported by the LIGO-Virgo-KAGRA Collaboration, the question of the cosmological origin of merging binary black holes (BBHs) remains open. The two main formation channels generally considered are from isolated field binaries or via dynamical assembly in dense star clusters.
Aims. Here we focus on understanding the dynamical formation of merging BBHs within massive clusters in galaxies of different masses.
Methods. To this end, we applied a new framework to consistently model the formation and evolution of massive star clusters in zoom-in cosmological simulations of galaxies. Each simulation, taken from the FIRE project, provides a realistic star formation environment, with a unique star formation history, that hosts realistic giant molecular clouds that constitute the birthplace of star clusters. Combined with the code for star cluster evolution CMC, we are able to produce populations of dynamically formed merging BBHs across cosmic time in different environments.
Results. As the most massive star clusters preferentially form in dense massive clouds of gas, we find that, despite their low metallicities favouring the creation of black holes, low-mass galaxies contain few massive clusters and therefore make a limited contribution to the global production of dynamically formed merging BBHs. Furthermore, we find that massive clusters can host hierarchical BBH mergers with clear, identifiable physical properties. Looking at the evolution of the BBH merger rate in different galaxies, we find strong correlations between BBH mergers and the most extreme episodes of star formation. Finally, we discuss the implications for future LIGO-Virgo-KAGRA gravitational wave observations.
Key words: gravitational waves / methods: numerical / stars: black holes / galaxies: clusters: general
NASA Hubble fellow.
© The Authors 2024
 Open Access article, published by EDP Sciences, under the terms of the Creative Commons Attribution License (https://creativecommons.org/licenses/by/4.0), which permits unrestricted use, distribution, and reproduction in any medium, provided the original work is properly cited.
This article is published in open access under the Subscribe to Open model. This email address is being protected from spambots. You need JavaScript enabled to view it. to support open access publication.
1. Introduction
Since the first direct detection of gravitational waves (GWs; Abbott et al. 2016), the number of observed compact binary coalescences has been increasing rapidly with each new observing run. The LIGO-Virgo-KAGRA Collaboration (LVK) has reported 90 binary black hole (BBH) merger candidates in the third Gravitational Wave Transient Catalog (GWTC-3, The LIGO Scientific Collaboration et al. 2023), as well as more than 50 additional significant detection candidates to date in the O4 public alerts1. This catalogue has provided valuable information about the population of observed BBHs, including their component mass distributions and local merger rate density (Abbott et al. 2023). One important question that arises is understanding the various processes that lead to the formation of these BBHs and the environments in which they occur.
Several formation pathways have been suggested (see e.g. Mapelli 2020; Mandel & Broekgaarden 2022, for recent reviews), with two main categories being favoured: the isolated evolution of a stellar binary (e.g. Bethe & Brown 1998; Belczynski et al. 2002, 2016; Dominik et al. 2012; Eldridge & Stanway 2016; Stevenson et al. 2017; Giacobbo & Mapelli 2018; Neijssel et al. 2019; Santoliquido et al. 2021; Briel et al. 2022) and the dynamical assembly in dense environments, such as globular clusters (GCs), young star clusters (YSCs), and nuclear star clusters (e.g. Sigurdsson & Hernquist 1993; Portegies Zwart & McMillan 1999; Rodriguez et al. 2015, 2016; Banerjee 2017; Di Carlo et al. 2020). Multiple studies have attempted to estimate the contribution of each scenario to the observed population of BBHs (e.g. Arca Sedda et al. 2020; Zevin et al. 2021; Wong et al. 2021; Bouffanais et al. 2021a; Mapelli et al. 2022), but no consensus has yet been reached on the value of this mixing fraction or on the nature of the dominant channel. However, all these studies agree that multiple formation channels are likely required to explain the properties of the BBH mergers observed by the LIGO and Virgo interferometers, and that isolated and dynamical channels likely contribute at the same order of magnitude.
The usual approach to studying how BBHs are produced in the Universe is to numerically construct cosmological populations of BBHs, whose characteristics can then be compared with the physical properties of the observed BBH mergers. These population synthesis techniques require two fundamental ingredients: a set of initial conditions and evolutionary models. It is particularly important to use models that are consistent with each other in these two aspects in order to be able to compare populations simulated with different formation channels. A number of codes for star cluster evolution now share the same prescriptions as binary population synthesis suites for stellar evolution and binary interactions (see e.g. Di Carlo et al. 2019; Antonini & Gieles 2020; Rodriguez et al. 2022). This ensures the two models have similar stellar evolutionary tracks. In contrast, consistency between the initial conditions of isolated stellar binaries and star clusters seems more challenging to achieve. Yet these initial conditions are of crucial importance.
Using binary population synthesis methods combined with large sets of star formation models, several studies have shown that the star formation history, and more specifically the metallicity distribution over redshift, has a major impact on the merger rate of BBHs formed in isolated binaries (see e.g. Neijssel et al. 2019; Briel et al. 2022; Chruślińska 2024; Broekgaarden et al. 2022; Santoliquido et al. 2022; Srinivasan et al. 2023). Regarding the formation and evolution of star clusters in a cosmological context, a number of key questions remain open (see e.g. Forbes et al. 2018, for a review), including when and where they formed and what their initial mass function was. While a number of studies have used semi-analytical models to compute a cluster formation rate density as a function of time (see e.g. Fall & Zhang 2001; Rodriguez et al. 2015; Antonini & Gieles 2020; Mapelli et al. 2022), an alternative approach based on the formation of GCs in gas-rich galaxy mergers extracted from large cosmological simulations is also commonly adopted (see e.g. Muratov & Gnedin 2010; Li & Gnedin 2014; Choksi et al. 2018; El-Badry et al. 2018; Rodriguez & Loeb 2018). This collection of different initial conditions results in a large uncertainty when estimating the local BBH merger rate (Mapelli 2020).
Motivated by the idea of using more complex and realistic star formation histories and to investigate certain properties of the host galaxies of double compact objects, various studies have used cosmological simulations as the basis for their population synthesis models of stellar binaries (see e.g. O’Shaughnessy et al. 2016; Lamberts et al. 2018, 2019; Mapelli et al. 2018; Artale et al. 2019; Santoliquido et al. 2022). These studies all show that the BBHs that merge in the local Universe most probably formed in metal-poor low-mass galaxies, and that they can merge in these small galaxies as well as in larger galaxies after a series of galaxy mergers. Combining a cosmological simulation with a binary population synthesis code can be fairly straightforward, as star particles are directly present in the simulation. In contrast, simulations of galaxies or larger volumes currently do not have a resolution high enough to resolve the formation of star clusters, and more complex methods are required (see e.g. Lahén et al. 2019; Ma et al. 2020). In Grudić et al. (2022, hereafter Paper I), a new framework for modelling cluster formation was applied to a magnetohydrodynamic (MHD) simulation of a Milky Way (MW)-like galaxy, with a particular focus on the population of young massive clusters. A representative sample of these clusters was then integrated forward in time with the Cluster Monte Carlo (CMC) code (Pattabiraman et al. 2013; Rodriguez et al. 2022) to create an evolved population of GCs. A detailed description of this study and a comparison of the physical properties of these GCs with observations in the MW and M31 are presented in Rodriguez et al. (2023, hereafter Paper II).
This paper is the third in the Great Balls of FIRE series (Paper I; Paper II). We extend the analysis to a larger number of galaxies by applying the cluster formation framework to a set of zoom-in cosmological simulations of dwarf galaxies and examine in detail the populations of dynamically formed merging BBHs in the most massive star clusters in each galaxy. Throughout this study, we only consider BBHs that merge before redshift z = 0. The term “BBHs” should be interpreted as “merging BBHs” in all that follows.
After describing in detail the cosmological simulations used throughout this study and the methods used to implement the formation and evolution of star clusters in them (Sect. 2), we highlight our results on the populations of massive star clusters in different galaxies and on the BBH mergers that they host (Sect. 3). We discuss some implications of our results and outline possible extensions of this work (Sect. 4) before summarising our main conclusions about the connection between BBH mergers and their galactic environments (Sect. 5).
2. Method
To study the dynamical formation of BBHs in different galaxies, we applied the method presented in Paper I and Paper II to a suite of dwarf galaxies in addition to the MW-like galaxy analysed in those papers. We used this set of cosmological simulations (Sect. 2.1) combined with a cluster formation framework (Sect. 2.3) to model populations of star clusters. These clusters were then evolved forward in time (Sect. 2.3) to produce a collection of BBHs formed in star clusters over the course of cosmic time for each galaxy. A schematic description of our complete procedure is shown in Fig. 1.
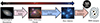 |
Fig. 1. Diagram of our procedure for modelling the formation and evolution of star clusters in a FIRE-2 cosmological zoom-in simulation of a galaxy. The method is described in full in Sect. 2. |
2.1. Realistic star formation models from FIRE-2 zoom-in simulations
We made use of cosmological zoom-in simulations of dwarf galaxies described in the Core suite of the public data release (Wetzel et al. 2023) from the Feedback in Realistic Environment (FIRE; Hopkins et al. 2014) project. These simulations were generated with the hydrodynamics and gravity solver GIZMO (Hopkins 2015) using the mesh-free finite mass method. Each simulation uses the second-generation FIRE-2 physics model (Hopkins et al. 2018), which includes gas cooling and heating, star formation, and stellar feedback. We now briefly describe the most relevant details of the FIRE-2 model.
Radiative cooling and heating is modelled in FIRE-2 across the range 10 − 1010 K. This includes free-free, photo-ionisation and recombination, Compton, photo-electric and dust collisional, cosmic ray, molecular, metal-line, and fine-structure processes. This also contains photo-ionisation and heating from a redshift-dependent, spatially uniform ultraviolet background (Faucher-Giguère et al. 2009). Star formation occurs in self-gravitating, self-shielding, and Jeans unstable dense molecular gas (n > 1000 cm−3). Stellar feedback includes energy, momentum, mass and metal injection from type Ia and type II supernovae and stellar winds (from O, B, and asymptotic giant branch stars). All feedback event rates, luminosities, energies, and mass-loss rates are tabulated from stellar evolution models (STARBUST99; Leitherer et al. 1999) assuming a Kroupa (2001) initial stellar mass function (IMF). All simulations include a sub-grid model for the turbulent diffusion of metals in gas, which produces more realistic metallicity distributions (Escala et al. 2017).
The first five simulations considered in this work correspond to m11q, m11i, m11e, m11h, and m11d presented in El-Badry et al. (2017). They all have the same mass resolutions, with mb ∼ 7100 M⊙ for baryonic particles and mdm ∼ 39 000 M⊙ for dark-matter (DM) particles. The minimum adaptive force softening length is 1 pc for gas cells, 4 pc for star particles and 40 pc for DM particles. All simulations assume a flat Λ cold dark matter cosmology consistent with recent measurements (Planck Collaboration VI 2020) ΩΛ = 0.69, Ωm = 0.31, Ωb = 0.048, h = 0.68, σ8 = 0.82, and ns = 0.97, with the exception of m11q, which uses the cosmology from the AGORA project (Kim et al. 2013) ΩΛ = 0.728, Ωm = 0.272, Ωb = 0.0455, h = 0.702, σ8 = 0.807, and ns = 0.961. The halo DM masses at redshift z = 0 range from 7.77 × 10¹⁰ M⊙ for the least massive halo (m11i) to 3.23 × 10¹¹ M⊙ for the most massive one (m11d). We add to this list of simulations the MW-like galaxy m12i presented in Paper I. Unlike the first five simulations of dwarf galaxies, this model includes a treatment of MHD, conduction, and viscosity. The effects of such additional physical processes upon galaxy evolution and star formation have been shown to be modest in the FIRE-2 simulations (see e.g. Su et al. 2017; Hopkins et al. 2020). Halo masses, stellar masses, and other properties of the simulated galaxies are listed in Table 1.
Properties of the primary halo at redshift z = 0 for all the zoom-in simulations used in this study.
In Fig. 2 we show the evolution of the star formation rate (SFR) and the average metallicity of newly formed stars across time in the six simulated galaxies. Each galaxy has a unique star formation history, with m11q having a very early peak of star formation around 12 Gyr ago while the most massive dwarf galaxy, m11d, had more recent and bursty periods of star formation around 6 Gyr ago. The MW-like galaxy m12i has a SFR that is generally more regular over time in the last 10 Gyr. The mean metallicity follows an overall similar trend in all galaxies. Metals formed in the most massive stars are dispersed through winds and supernovae in the interstellar medium, and the stars that form later from this enriched gas will naturally have higher metallicities. The average stellar metallicity of newly formed stars in a given galaxy will therefore generally increase over time.
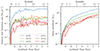 |
Fig. 2. SFR (left) and mean metallicity of newly formed stars (right) as a function of time in our six FIRE-2 cosmological simulations. The SFR and mean metallicity are calculated using time bins of 250 Myr. |
2.2. Cluster formation model
As the resolution of the simulations is not sufficient to resolve star clusters directly, we followed the method introduced in Paper I and used the population of giant molecular clouds (GMCs) present in the simulation as the formation sites of these clusters. The GMCs were identified at all redshifts as self-gravitating gas structures using the CloudPhinder algorithm (Guszejnov et al. 2019). The number of GMCs identified in a given simulation generally increases with the mass of the DM halo, with the exception of m11d, which is more massive than m11h and yet has fewer GMCs.
To determine the properties of the star clusters formed in a given GMC, we used the cluster formation framework introduced in Grudić et al. (2021). This model was calibrated with high-resolution MHD simulations of collapsing gas clouds. Here we briefly summarise the mapping procedure from a given GMC to its star clusters. We first computed the total stellar mass formed in the cloud M⋆ = ϵintMGMC, where ϵint is the integrated star formation efficiency, itself estimated from the cloud surface density  . We calculated the fraction of this mass locked in bound clusters fbound, which also takes the form of an increasing function of the cloud surface density ΣGMC, and obtain the total mass of stars in bound clusters Mbound = fboundM⋆. Individual cluster masses are then sampled from a cloud-level mass distribution until their sum reaches Mbound. This cloud-level mass distribution is taken to be a power law with an exponential cutoff, where the slope of the power law and the position of the cutoff are both functions of the cloud metallicity. We finally associated each cluster with a half-light radius sampled from a cloud-level size-mass relation. The cluster metallicity was taken to be the same as its parent GMC. We refer the reader to Sect. 4 in Grudić et al. (2021) for further details on this cluster formation framework.
The simulations of gas clouds used to build this cluster formation model are presented in Grudić et al. (2021). Su et al. (2017), Hopkins et al. (2020) show that the effects of additional physical processes such as MHD, conduction, or viscosity do not have a significant effect on the bulk properties of the simulated galaxy. We checked the consistency of our cluster formation model by comparing the results presented in Paper I with the same analysis applied to the non-MHD version of the m12i galaxy (Wetzel et al. 2016). In this non-MHD simulation, we find GMCs that tend to be more massive, although less dense, than the clouds identified in Paper I. This results in an excess of massive clusters. We expect this difference to become less important in dwarf galaxies, where the distributions naturally converge towards lower GMC masses, even in the absence of any of these additional physical processes.
It is important to note that the list of GMCs identified with CloudPhinder is only a subset of all the clouds that would ever exist in a similar real galaxy. Indeed, the lifetime of a GMC found in these simulations is generally in the order of ∼1 − 10 Myr (Hopkins et al. 2012; Chevance et al. 2019; Benincasa et al. 2020), which is significantly less than the average time interval between consecutive snapshots in our simulations (Δt ∼ 20 Myr). A number of gas clouds could spend their entire life cycle within a single time step of the simulation and thus never appear in the simulation output. To correct for this incompleteness of our GMC catalogue, at each snapshot we repeated the sampling procedure for our catalogue of identified GMCs until the total mass of stars formed in clouds reached the stellar mass formed in the entire galaxy between this snapshot and the next. In this way, our model accounts for all the stellar mass formed in the simulated galaxy. The mass-radius distributions of all the GMCs identified with CloudPhinder in our six simulated galaxies are shown in Fig. 3. Red dots indicate the GMCs that form massive clusters (Mcl ≥ 6 × 10⁴ M⊙). The model predicts a distinct area on the mass-radius plane that is more conducive to the creation of massive clusters. This apparent preference for the formation of massive clusters in clouds with high masses and high surface densities is consistent with analytical expectations that stellar feedback becomes progressively inefficient as densities increase (Kruijssen 2012). The effect of the galactic environment on the cluster formation efficiency is also supported by several observations (see e.g. Adamo et al. 2015; Johnson et al. 2016).
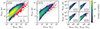 |
Fig. 3. Distributions in masses and radii of all the GMCs identified in the MW-like galaxy m12i (left), in m11d (centre), and in the four other cosmological simulations of dwarf galaxies considered in this study (right). The diagonal dashed grey lines represent lines of constant surface density |
To maintain consistency with the cluster catalogue presented in Paper I, we only selected clusters with an initial mass greater than 103 M⊙. From this set of sampled clusters, we defined the population of massive clusters as Mcl ≥ 6 × 10⁴ M⊙, which will be evolved forward in time. The choice for this threshold on the cluster initial mass was (i) motivated by the fact that we are focusing on the clusters most likely to host the majority of dynamically formed and hierarchical BBH mergers and (ii) to ensure that they have enough particles to be integrated with a Hénon-style Monte Carlo approach, which we describe below (see also Sect. 2 of Paper II).
2.3. Dynamical assembly in star clusters with CMC
The initial positions and velocities of the individual particles in these massive clusters are generated using the Elson, Fall, and Freeman density profiles, originally developed to describe young clusters in the Large Magellanic Cloud (Elson et al. 1987):
 (1)
(1)
where ρ0 is the central cluster density, a is a scale radius and γ is a power-law index drawn for each cluster according to the cluster formation model of Grudić et al. (2021).
The massive clusters sampled in our zoom-in cosmological simulations are integrated forward in time using the Cluster Monte Carlo code (CMC; Pattabiraman et al. 2013; Rodriguez et al. 2022). CMC uses a Hénon Monte Carlo approach (Hénon 1971) to model collisional stellar dynamics with an orbit averaging technique. It assumes that clusters with a sufficiently large number of particles (≳105) evolve mainly by two-body encounters that can be modelled as a statistical process. This condition, known as the Fokker-Planck approximation, dictates the initial mass threshold applied to our clusters. The code includes various processes relevant to the formation of BBHs including two-body relaxation (Joshi et al. 2000), three-body binary formation (Morscher et al. 2015) and direct integration of small-N resonant encounters with post-Newtonian corrections (Rodriguez et al. 2018). Stars and stellar binaries are evolved using the rapid population synthesis code COSMIC (Breivik et al. 2020).
Here we summarise the main assumptions used in our version of COSMIC. Stellar populations are initialised with primary masses sampled from a Kroupa (2001) IMF between 0.08 M⊙ and 150 M⊙ and uniformly distributed mass ratios. Following van Haaften et al. (2013) we assume a mass-dependent binary fraction  , where M is the mass of the primary star. As the star clusters in the m12i galaxy had already been evolved using CMC with a fixed binary fraction b = 0.2 (see Paper II), we decided not to run them again due to the high computational cost. Chatterjee et al. (2017) show that, because most initial binaries are quickly disrupted by dynamical interactions, varying the initial population of stellar binaries in a cluster does not have a strong impact on the final number and properties of BBHs retained inside the cluster. One exception to this effect is the possibility, in the case of a large number of initial massive stellar binaries inside a small cluster (with initial virial radius rv ≲ 1 pc), of collisional runaways leading to the formation of an intermediate-mass black hole (BH; see e.g. González et al. 2021).
Metallicity-dependent wind mass loss rates for O and B stars are set by Vink et al. (2001), and winds from Wolf-Rayet stars are treated according to Vink & de Koter (2005). We assumed a value for solar metallicity of Z⊙ = 0.017 (Grevesse & Sauval 1998). The stability of mass transfer events was determined following Neijssel et al. (2019), where the criterion is whether or not the donor star expands faster than its Roche-lobe radius in response to the mass transfer. An exception is made for stripped stars whose mass transfer is assumed to be always dynamically stable. Common envelope (CE) evolution follows the standard αλ model described in Hurley et al. (2002), with the efficiency parameter, α, set to 1 and the binding energy factor, λ, determined by Claeys et al. (2014). Remnant masses are computed with the delayed prescription from Fryer et al. (2012). Natal kicks for BHs and neutron stars are drawn from a Maxwellian distribution with a dispersion σ = 265 km s−1 (Hobbs et al. 2005) and are fallback-modulated in the case of BHs (Fryer et al. 2012). We refer the reader to Breivik et al. (2020) for further details on the different physical prescriptions implemented in COSMIC.
To fully describe the evolution of our clusters in their respective galaxies, we also needed to take the tidal effects of the host galaxy on the clusters into account. Following Paper II, each cluster was associated with a star particle selected from its parent GMC. These particles were used as tracers of realistic trajectories for our clusters in each galaxy. Without taking dynamical friction (discussed below) into account, this gives us trajectories consistent with the cosmological simulation for all sampled clusters.
The external tidal field experienced by these tracer particles is then extracted directly along the path of the tracer particle. We computed at each snapshot the tidal tensors as
 (2)
(2)
where ϕ is the gravitational potential evaluated at the position r of the tracer particle in the reference frame {xi}i = 1, 2, 3. The potential ϕ is computed using all types of particles in the simulation (see Sect. 7.4 in the GADGET user’s guide for details2). The tidal tensors are passed as input to CMC and are diagonalised to compute an effective tidal strength as λ1, e ≡ λ1 − (λ2 + λ3)/2 where λ1, 2, 3 are the eigenvalues sorted from largest to smallest (Pfeffer et al. 2018). This allows us to compute, at each time step and for each cluster, its instantaneous tidal radius as
 (3)
(3)
All stars with orbital apocentres greater than rt are eliminated by CMC.
As star clusters move through their host galaxy, they are subject to dynamical friction caused by their surroundings (stars, gas, and DM). They lose orbital energy and angular momentum, and eventually spiral towards the galactic centre. The interplay between tidal fields and dynamical friction is particularly difficult to model and we cannot recalculate the real orbits of our clusters in post-processing. Instead, CMC integrates each cluster forward in time using the tidal fields calculated along the trajectory of its tracer particle, and the effect of dynamical friction is modelled solely as the typical time it would take for the cluster to spiral into the galactic centre. We computed for each cluster and at each snapshot this dynamical friction timescale as (Lacey & Cole 1993)
 (4)
(4)
where rcirc is the radius of the circular orbit with the same energy as the real orbit, vc is the circular velocity at that radius, σ is the local velocity dispersion, Mc is the time-dependent cluster mass,  is the standard velocity term for dynamical friction (Binney & Tremaine 2008), ϵ is the ratio of the real angular momentum to that of the circular orbit, and lnΛ is the Coulomb logarithm. Following Lacey & Cole (1993), Λ is defined as Λ = 1 + Mc/Menc where Menc is the mass enclosed.
Each cluster is integrated forward in time until the condition
 (5)
(5)
is satisfied. From this point onwards, the cluster is assumed to have merged with the galactic centre.
We refer the reader to Paper I and Paper II for more information on the population of star clusters sampled in the MW-like galaxy m12i.
3. Results
In this section we present the outcomes of our cluster formation framework applied to our set of zoom-in cosmological simulations and some properties of the BBHs dynamically formed therein. Firstly, we examine the characteristics of star clusters in all simulated galaxies (Sect. 3.1) and their efficiency in producing BBHs (Sect. 3.2). We then study the physical properties of these BBHs and investigate the relationship between the BBH mergers and the star formation history exclusive to each galaxy (Sects. 3.3 and 3.4).
3.1. Cluster physical properties
The initial mass distributions of all the clusters sampled in our six zoom-in simulations are shown in Fig. 4. We fit the mass distributions with power-law functions
 (6)
(6)
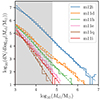 |
Fig. 4. Initial mass distributions of all clusters sampled in our six zoom-in simulations of galaxies. We consider here all the clusters formed without taking their different formation redshifts into account. The different simulations are indicated with the same colours as in Fig. 2. Dashed lines correspond to the best power-law fits. The grey shaded region indicates the mass range Mcl < 6 × 10⁴ M⊙, which we do not model with CMC. This limit roughly corresponds to an initial number of particles of 105. |
Properties of the clusters sampled in our six zoom-in simulations of galaxies.
and show the values obtained for α in Table 2. In addition to having a larger total number of star clusters, the more massive galaxies m11d and m12i also clearly extend to higher masses, while having shallower power-law slopes overall. From the analysis of the GC luminosity functions in early-type galaxies observed in the Virgo Cluster, Jordán et al. (2007) find a visible steepening of the cluster mass function with decreasing galaxy luminosity, particularly for massive clusters. The values they obtain for the best-fitting power-law exponents are in reasonable agreement with the mass functions of the massive clusters sampled in our cosmological simulations. We note, however, that the distributions presented in Fig. 4 represent cluster initial masses, and not present-day masses. It is therefore not straightforward to compare them with observations of clusters in nearby galaxies, because clusters can lose a significant amount of their mass due to stellar evolution, tidal shocks and two-body relaxation during the first gigayear after their formation. Still, the dependence of the massive cluster mass function on galactic environment remains valid for observations of young massive clusters in nearby galaxies (see e.g. Fig. 10 in Portegies Zwart et al. 2010, for a comparison of the mass functions of young clusters within several galaxies in the Local Group and beyond). The steep slopes of the cluster initial mass functions in the smallest dwarf galaxies, along with the expectation that the total mass of GCs in a galaxy relates to its stellar mass (see e.g. Beasley 2020; Berek et al. 2023), suggests that it is highly improbable to form very massive clusters in low-mass galaxies.
In the top panel of Fig. 5 we show the distributions of cluster mean metallicities at birth in our six cosmological simulations. In our cluster formation framework, the metallicity of a cluster is directly inherited from its parent GMC. In all six simulated galaxies the distributions exhibit a similar trend, with a metallicity peak between 0.1 and 1 Z⊙ depending on the galaxy considered, and a sharp drop just after this peak. For each galaxy in our collection, the cluster metallicity distribution has a shape almost identical to that of the complete population of star particles in the simulation (see the examples of m11d and m12i in the other panels).
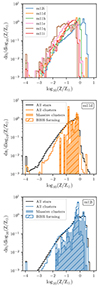 |
Fig. 5. Metallicity distributions of all clusters sampled in our six zoom-in simulations of galaxies (top). The different simulations are indicated with the same colours as in Fig. 2. The minimal value of metallicity admitted in the FIRE-2 simulations is ∼10−4 Z⊙, which causes a stacking at low-metallicity visible on the plot. Metallicity distributions in the simulations m11d (centre) and m12i (bottom) of all stars (black line), all clusters (coloured line), massive clusters (filled area), and clusters in which merging BBHs form (hatched area). All histograms are normalised to one. |
Looking individually at different cluster populations in m11d (centre panel of Fig. 5), we note that there is a preference for the formation of massive clusters within a fairly narrow metallicity range compared to the distribution of all clusters. The lower limit comes naturally from the fact that metallicity is lowest at early times, when star formation has only just begun (see Fig. 2). At that stage, dwarf galaxies are even smaller and do not contain GMCs massive enough to populate the high-mass tail of the cluster mass function. On the other hand, the upper limit of the massive cluster metallicity distribution function is expected around the maximum mean metallicity that the galaxy reaches, and so is expected to track the usual galaxy mass-metallicity relation (Kruijssen et al. 2019). The massive clusters in galaxy m12i cover a wider range of metallicities (bottom panel of Fig. 5). This is because the simulated galaxy gets more massive at earlier times compared to the dwarf galaxies, and therefore contains sufficiently massive and dense GMCs when the metallicity is still low. Massive clusters formed at high metallicities, not present in dwarf galaxies, come from massive, dense and metal-rich GMCs that exist only in our MW-like galaxy m12i.
We note, however, that, as described in Paper I and Paper II, our massive star clusters sampled in m12i are significantly younger and more metal-rich than the GCs observed in the MW and in M31 (see e.g. Harris 1996; Caldwell et al. 2011, for ages and metallicities of GCs in the MW and M31, respectively). Paper II suggested that this discrepancy could be explained by differences between the star formation history of the MW galaxy and that of the simulated galaxy m12i. We refer the reader to this previous study for a more in-depth comparison between the surviving massive clusters in this simulation and the GCs observed in the MW, both in terms of number, age, metallicity and spatial distribution. The specific star formation histories of our cosmological simulations and the correlations with BBH mergers will be studied in more detail in Sect. 3.3.
3.2. Formation of BBHs in star clusters
Here we look specifically at the star clusters in which BBHs are formed, and we describe how populations of BBHs arise from various groups of clusters in different galaxies. In Fig. 6 we show the mass-radius distribution of the star clusters sampled in our six zoom-in simulations. The clusters in which BBHs formed are pictured as red dots, where the size of the dot indicates the number of BBHs. In the case of the MW-like galaxy m12i, only ∼1/3 of the massive clusters were evolved with CMC to reduce the computational cost. This random sampling is the reason for the apparent lack of clusters forming BBHs compared with the complete population in the left plot.
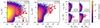 |
Fig. 6. Masses and radii of all the clusters sampled in the MW-like galaxy m12i (left), in m11d (centre), and in the four other cosmological simulations of dwarf galaxies considered in this study (right). Red dots indicate the number of BBHs formed in each cluster. |
There appears to be a clear preference for BBH formation in massive and compact clusters. More massive clusters are naturally larger reservoirs of massive stars, and are therefore more likely to host BBHs. In addition, the dynamical interactions in these dense environments tend to harden binaries that are already hard (the so-called Heggie’s law), thereby increasing the fraction of BBHs that merge within an Hubble time (see e.g. Rodriguez et al. 2016; Kremer et al. 2020, for more details on the relationship between the physical properties of a cluster and the population of BBHs it produces).
As there are no clusters more massive than 1.5 × 10⁵ M⊙ in m11e, all BBHs are formed in clusters with an initial mass around ∼105 M⊙. On the other hand, for m11h and m11d, which both have clusters as massive as 5 × 10⁵ M⊙, the contribution of the most massive clusters to the overall population of BBH mergers compares with that of the less massive ones. These results suggest that a small number of very massive clusters that are very efficient at producing BBHs can make up for a large number of less massive clusters. The MW-like galaxy m12i presents an extreme case of this effect, with one single cluster of mass ∼7 × 10⁶ M⊙ accounting for more than 1/4 of all the BBHs formed from all of the 495 clusters simulated from that galaxy (see Rodriguez et al. 2020, for a specific study of this “Behemoth” cluster).
To measure the efficiency at forming merging BBHs in massive clusters, we show in Fig. 7 the median, 1st and 3rd quartiles of the number of BBH mergers normalised by cluster initial stellar mass for all our clusters integrated with CMC. Despite a large dispersion for low-mass clusters, with some clusters less massive than 105 M⊙ hosting up to 13, 11, and 14 BBH mergers in m11e, m11h, and m11d, respectively, we observe a clear increase in the average number of BBH mergers per unit cluster mass for the most massive clusters. We fitted the BBH formation efficiency as a power law:  , with the best-fit parameters a = (2.9 ± 1.0)×108 and b = (0.54 ± 0.03) at 1σ. To quantify the importance of cluster dynamics on the formation of merging BBHs, we evolved the initial stellar populations in all our clusters using COSMIC alone with the exact same parameters for stellar evolution and binary interactions (see Sect. 2.3). This specific model predicts a total number of 3141 BBH mergers through isolated evolution alone, to be compared with the 7631 BBH mergers obtained from all our CMC-integrated clusters. Under these assumptions, dynamical interactions in massive clusters are on average about 2.5 times more efficient at forming merging BBHs than isolated evolution. This is particularly true for the less massive, metal-rich clusters in m12i, some of which produce a few BBH mergers when cluster dynamics are taken into account, whereas the isolated evolution of their stellar populations predicts none.
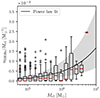 |
Fig. 7. Formation efficiency of merging BBHs per unit cluster initial stellar mass in all our clusters integrated with CMC. Boxes indicate the first to third quartiles, with red horizontal lines at the medians. Silver dots show outliers outside the first and third quartiles. The solid black line shows the best-fit power law and the shaded grey area represents the 1σ deviation on the power law coefficients. |
Metallicity is one of the elements often described as playing a major role in the formation of BBHs. Indeed, as mass loss through stellar winds increases with metallicity, massive stars formed in metal-rich environments lose a significant fraction of their mass before the end of their lives. In the case of isolated binaries, this effect produces a widening of the orbits (due to the conservation of angular momentum) and generally reduces the fraction of BBHs that can merge within an Hubble time (Dominik et al. 2012; Giacobbo & Mapelli 2018; Neijssel et al. 2019). In contrast, metallicity is expected to have a weaker effect on the BBH formation efficiency in star clusters, where dynamical interactions play a dominant role, and to contribute mainly to shaping the BBH mass distribution (see e.g. Di Carlo et al. 2020; Kremer et al. 2020). The two bottom subplots in Fig. 5 show the metallicity distribution of all the massive clusters (filled) and those hosting BBH mergers (hatched) in the two simulated galaxy m11d and m12i. In m11d, the subset of massive clusters in which BBHs form has a metallicity distribution almost identical to that of all massive clusters. This is consistent with the idea that metallicity has a modest impact on the BBH formation efficiency in massive clusters, for sub-solar metallicity values. This effect becomes significant for the most metal-rich massive clusters in m12i, where the formation efficiency of merging BBHs drops rapidly with increasing metallicity above Z⊙. It is also important to bear in mind that these metal-rich clusters generally form late in the life of their host galaxy and that, as a result, only a small subset of all the BBHs formed within them will have coalesced before the present-day. As these massive clusters are noticeably younger than the GCs observed in the MW, and therefore more metal-rich (see the discussion in Sect. 3.1), this may lead to an overproduction of low-mass BBHs compared with the actual population in the MW. We note, however, that the aim of this study is not to predict the exact population of BBH mergers in massive clusters within the MW, but to present the results of our method applied to a series of cosmological simulations of galaxies with different present-day properties.
3.3. Properties of dynamically formed BBHs
Here we describe the properties of the BBHs formed in the star clusters sampled in our four cosmological simulations of galaxies m11e, m11h, m11d, and m12i. We also examine the interplay between the star formation history and the BBH merger rate in each galaxy. As the two smallest dwarf galaxies m11q and m11i have only one and five massive clusters, respectively, the number of BBHs formed in them is too small to be statistically significant. Therefore, we have chosen not to include them in the following analysis.
The distributions of primary mass MBH1 and mass ratio q ≡ MBH2/MBH1 for the BBHs formed in m11e, m11h, m11d and m12i are shown in Fig. 8. The primary masses of BBHs display a similar distribution across the four simulated galaxies, with a peak at around ∼20 M⊙ and a sharp decrease after ∼45 M⊙. This drop comes from the pair-instability supernova (PISN) and pulsational pair-instability supernova (PPISN) mechanisms, in which the production of electron–positron pairs in the core of a very massive star is expected to suppress photon pressure and cause the core to contract. For stars with helium cores more massive than mHe ≳ 60 M⊙, the collapse triggers the ignition of explosive oxygen burning, which completely disrupts the star and leaves no remnant behind (Kasen et al. 2011). For less massive stars with helium core in the range 60 ≳ mHe ≳ 30 M⊙, the energy released by oxygen burning is not sufficient to completely disrupt the star; instead mass gets ejected in a series of energetic pulses before the star finally collapses into a BH (Woosley 2017). In this scenario, an upper limit for the mass of BHs formed from single star evolution naturally arises. We used the prescriptions for PISN and PPISN presented in Marchant et al. (2019); they predict a lower edge of the mass gap at ∼45 M⊙, which is responsible for the drop in the primary mass distribution of BBHs in Fig. 8. Various authors have studied the dependence of this mass gap on several factors (e.g. metallicity, nuclear reaction rates, rotation, etc.) and have found that its lower edge could very well be higher, with Mlow ≳ 60 M⊙ (Woosley & Heger 2021; Farag et al. 2022). The existence in our simulations of BBHs with components more massive than this limit is a direct indication of dynamical interactions, such as stellar mergers (Kremer et al. 2020) or second-generation mergers (Rodriguez et al. 2022).
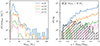 |
Fig. 8. BBH primary mass (left) and mass ratio (right) distributions in the simulated galaxies m11e, m11h, and m11d. On the right-hand side plot, the hatched areas show the mass ratio distributions for the BBHs with a primary mass MBH1 > 50 M⊙ in all four galaxies combined. |
The right panel of Fig. 8 indicates that in all the simulated galaxies, our model predicts a distribution weighted towards equal-mass BBH mergers. The fraction of BBHs with a mass ratio q > 0.5 consistently stands at around 90% (92%, 91%, 90%, and 90% in m11e, m11h, m11d, and m12i, respectively). However, when we specifically look at the sub-population of massive BBHs (MBH1 > 50 M⊙), we observe a preference for unequal-mass mergers. Among all the massive BBH mergers in the four considered galaxies, 68% have a mass ratio q ≤ 0.5, indicating that the primary BH is at least twice as massive as the secondary. Such values of mass ratios are consistent with hierarchical mergers, where a massive second-generation BH (born of an earlier BBH merger) pairs with a first-generation BH (born of a massive star). As GW recoils are applied to all second-generation BHs, these hierarchical mergers are expected to take place in massive and dense clusters where the escape speed is large enough to allow for their retention.
High and unequal component masses have been proposed as a signature to identify dynamically formed BBHs in GW observations (see e.g. Arca Sedda et al. 2020). As discussed above, the PISN and PPISN mechanisms would make it impossible to form BHs more massive than ∼45 M⊙ through single star evolution alone. In the evolution of stellar binaries, episodes of mass transfer from an evolved star onto an already-formed BH could allow this limit to be exceeded. However, assuming that accretion onto a BH is Eddington-limited, the increase in mass of the first-born BH alone cannot explain the most massive BBH mergers reported by the LVK Collaboration (Bouffanais et al. 2021b; Abbott et al. 2020a). On the other hand, super-Eddington accretion would cause these mass transfer episodes to be more conservative, thus forming BBHs that are too wide to merge within an Hubble time (van Son et al. 2020; Bavera et al. 2021). The existence of BHs in this mass gap cannot therefore be explained by the evolution of stellar binaries alone, and could be a direct indication of hierarchical mergers. Rodriguez et al. (2020) explored the formation of unequal-mass BBHs in dynamical environments and showed that the LVK event GW190412, a BBH reported with a mass ratio of q ∼ 0.25 (Abbott et al. 2020b), is consistent with a third-generation merger in a massive, dense star cluster with a high escape velocity (which is included in our m12i population).
In Fig. 9 we show the distribution of delay times for the BBHs formed in star clusters within the four same simulated galaxies. Here the delay time refers to the time elapsed from the formation of the cluster to the BBH merger. The starting point is always set at the formation of the cluster, whether the BBH is a first-generation merger or not. This definition allows us to relate BBH mergers directly to the galactic environment in which they were formed, via their parent star cluster. In the case of observed GW events small delay times would indicate that the BBHs merged shortly after the creation of their star clusters, which therefore could still be observable as young clusters in the local Universe. The distributions of delay times in the four galaxies have an overall similar shape, consistent with a log-uniform distribution (or dN/dτ ∝ 1/τ) (see e.g. Dominik et al. 2012; Rodriguez & Loeb 2018; Neijssel et al. 2019). Short delay times are therefore strongly favoured, with a majority of BBH mergers taking place less than 2 Gyr after the formation of their parent cluster (68%, 63%, 74% and 67% in m11e, m11h, m11d, and m12i, respectively). The sub-population of massive BBH mergers (MBH1 > 50 M⊙) is even more prone to short delay times, with 86% of them having a delay time τ < 1 Gyr in all four galaxies combined. We note that there appears to be a scarcity of very long delay times (τ > 6 Gyr) in the simulated galaxies m12i and m11d compared to a 1/τ distribution function. This characteristic is due to the fact that, in our simulations, most clusters are formed relatively late and therefore the BBHs with these very long delay times have not yet merged. Except for dynamical friction, allowing these clusters to evolve for longer times would result in a smooth power law. We explore the specific star formation histories and cluster formation histories of our simulations in the next section.
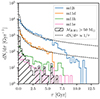 |
Fig. 9. Distributions of delay times for all BBHs in the simulated galaxies m11e, m11h, m11d, and m12i. The hatched areas show the distribution of delay times for the massive BBHs (MBH1 > 50 M⊙) in all four galaxies combined. The dashed black lines show 1/τ distributions matching the delay times in m11d and m12i. |
3.4. BBHs progenitor environment
Combining the epochs of formation of the clusters sampled in our simulations and the delay times of the BBHs formed in each of these clusters, we can now populate our galaxies with BBH mergers across cosmic time. Figure 10 shows the evolution of the massive cluster formation rate and of the BBH merger rate ℛBBH as a function of time. Most massive cluster formation events (shown as filled areas) are closely followed by a sharp increase in the BBH merger rate. This pattern arises from the preference for short delay times described above. We also compare the BBH merger rates obtained with the SFR in each galaxy. The peaks in the BBH merger rate are sparse and correlate to only a few of the highest star formation peaks, as the massive clusters themselves form preferentially from the most massive and densest molecular clouds.
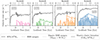 |
Fig. 10. Dynamical BBH merger rate in the simulated galaxies m11e, m11h, m11d, and m12i (left to right). In each subplot, the BBH merger rate is shown as a solid coloured line (number of mergers per unit time). Dotted lines represent the BBH merger rates of massive BBHs (MBH1 > 50 M⊙). The filled areas correspond to the formation rate of massive clusters. They indicate the total mass of massive clusters formed, divided by 105 M⊙, per unit time. The solid black line shows the SFR, divided by 105 M⊙, for comparison. |
In our simulations, we observe a positive correlation between the formation of massive clusters, SFR peaks and major halo merger events. We used the halo finder ROCKSTAR (Behroozi et al. 2012) to identify halos in each simulation, and we built merger trees using ytree (Smith & Lang 2019). For example, the peak of star formation at redshift z ∼ 1.5 (∼9.5 Gyr ago) in the galaxy m11e corresponds to a halo merger with a mass ratio Rm ≡ ℳ⋆, 2/ℳ⋆, 1 ∼ 0.76, where ℳ⋆, 1 is the stellar mass of the main halo before the merger and ℳ⋆, 2 that of the secondary halo. This event also relates to the first formation of massive clusters and is apparent in the BBH merger rate. In m11d, a halo merger Rm ∼ 0.72 at redshift z ∼ 0.6 triggers a starburst episode with the SFR peaking at around 2 M⊙ yr−1. The consecutive formation of massive clusters generates an increase in the BBH merger rate by almost two orders of magnitude. The correlations observed here are in good agreement with recent studies showing that bursts of star formation associated with major halo mergers favour the formation of massive clusters (see e.g. Li et al. 2017).
4. Discussion
4.1. Caveats
With different studies based on population synthesis methods predicting a wide range of BBH merger rates for different formation channels (see e.g. Wong et al. 2021; Zevin et al. 2021; Santoliquido et al. 2021; Mapelli et al. 2022; Srinivasan et al. 2023), caution should be used when interpreting results from such simulations. However, our focus here is not on an astrophysical merger rate, but on the global connection between the physical properties of a galaxy, the massive star clusters it hosts, and the dynamical BBH mergers that form in them.
One caveat to our cluster formation framework is that, with the structure finder algorithm CloudPhinder, we only identify GMCs with virial parameters αvir < 2. In reality, a number of stars could form in gas clouds with virtually any virial parameter. Still, as the efficiency of star formation decreases rapidly as the virial parameter increases (Padoan et al. 2012; Kim et al. 2021), we expect the overall stellar population to be dominated by stars formed in bound gas clouds. Therefore, the fraction of stars formed in bound clusters fbound used in this model should be a fairly good proxy for sampling the total mass of stars that would have formed in clusters, if the simulations had sufficiently fine resolution.
As the most massive galaxies today have had a greater reservoir of stars over cosmic time, they can potentially host a greater number of star clusters. This general trend is clearly visible in the total mass of star clusters sampled in each galaxy, which increases monotonically with the present-day halo mass (see Table 2). However, it is clear that the evolution of the star cluster formation rate across time in a given galaxy cannot be inferred by its present-day properties alone, but depends on its unique star formation history and merger history. As an example, it is striking to see the difference between the merger rate of BBHs formed in massive clusters in our galaxies m11h and m11d (m11h hosts eight BBH mergers in the last gigayear, while m11d has 177; see Fig. 10), even though their stellar masses at redshift z = 0 are very similar (3.6 × 10⁹ and 3.9 × 10⁹ M⊙, respectively). For this reason, we believe that any model predicting the population of star clusters in a galaxy with certain present-day properties should also explore the diversity of star formation histories that can lead to these exact properties.
A second caveat to our study of dynamically formed BBHs is that, with the approach described here, we are not able to simulate low-mass and intermediate-mass clusters. We present a first approximation of their contribution to the total number of BBH mergers in each of our simulated galaxies in Sect. 4.4.
4.2. Comparison with other studies
Several studies have looked at the formation of stellar clusters in cosmological simulations of galaxies. In their series of papers, Li et al. (2017, 2018) and Li & Gnedin (2019) simulated a suite of MW-like galaxies and could model the formation of individual GMCs. Cluster formation was in turn based on a process of accretion and feedback with sub-grid physics. Li et al. (2017) found correlations between major galaxy mergers and the main episodes of cluster formation, in good agreement with our results on the impact of each galaxy’s star formation history on the formation of massive clusters (Sect. 3.4). Li et al. (2018) found rather steep cluster initial mass functions with slopes between −2 and −3, consistent with our values (Table 2).
The E-MOSAICS project (Pfeffer et al. 2018) aimed at modelling the formation, evolution, and disruption of star clusters in the galaxies present in the EAGLE simulation (Schaye et al. 2014). Cluster formation is here again a sub-grid process. Each star particle born in the simulation triggers the formation of a population of star clusters with a fraction of stars in bound clusters depending on the properties of the interstellar medium (Kruijssen 2012). These clusters evolve across time in the simulations accounting for stellar mass-loss, two-body interactions, and tidal shocks. The main difference with our MW-like zoom-in simulation m12i is that they were able to reproduce with reasonable agreement the population of GCs in the MW. More specifically, they found galaxies in their collection of simulations where massive clusters form at very early times, thus recovering the population of old low-metallicity GCs that do not appear in m12i.
4.3. Local BBH mergers
Using all the BBH mergers reported by the LVK Collaboration after the O3 run, Abbott et al. (2023) found indications of a BBH merger rate increasing with redshift, as ℛBBH(z)∝(1 + z)κ with  , and computed this rate at a fiducial redshift of z = 0.2 to be ℛBBH(z = 0.2) = 17.9 − 44 Gpc−3 yr−1. As our study set contains only six cosmological simulations of galaxies, the inherent stochasticity of each simulation and the importance of each galaxy’s unique star formation history on BBH mergers do not allow us to construct a realistic population of BBH mergers on the scale of the local Universe. However, it is possible to compute a rough estimate of the local BBH merger rate from massive star clusters predicted by our simulations.
We next considered the sub-population of BBHs that merge at redshift z < 0.2 in our simulations, as this is the fiducial redshift at which the BBH merger rate is computed in Abbott et al. (2023). In the following, this sub-population is referred to as local mergers. To build an astrophysical population from these local mergers, each simulated galaxy is associated with a number density calculated from a galaxy stellar mass function. We modelled the stellar mass function with a double Schechter function (Schechter 1976):
![Mathematical equation: $$ \begin{aligned} \Phi ({\mathcal{M} }_{\star })\mathrm{d}{\mathcal{M} }_{\star } = e^{-{\mathcal{M} }_{\star }/\mathcal{M} ^{*}} \left[\Phi ^{*}_1\left(\frac{{\mathcal{M} }_{\star }}{\mathcal{M} ^{*}}\right)^{\alpha _1} + \Phi ^{*}_2\left(\frac{{\mathcal{M} }_{\star }}{\mathcal{M} ^{*}}\right)^{\alpha _2}\right]\frac{\mathrm{d}{\mathcal{M} }_{\star }}{\mathcal{M} ^{*}}, \end{aligned} $$](/articles/aa/full_html/2024/06/aa48716-23/aa48716-23-eq13.gif) (7)
(7)
where the characteristic mass ℳ*, the normalisation parameters  and the power-law slopes α1, 2 are taken from the Tomczak et al. (2014) best-fit double-Schechter function of all galaxies at redshift 0.2 < z < 0.5. This number density will be used as a weighting function to take account of the mass distribution of galaxies observed in our local Universe.
To reduce the stochasticity inherent to our limited sample of cosmological simulations, we grouped the galaxies into logarithmic mass bins. We counted the average number of local BBH mergers in each mass interval and combined this with the number density of galaxies in this particular mass range to obtain a local BBH merger rate. In Table 3 we present the results obtained at each stage of the process. By summing over all the mass bins, we finally get an estimate of the local BBH merger rate from dwarf galaxies ℛBBH(z < 0.2)∼2.26 Gpc−3 yr−1. This result falls below the BBH merger rate inferred with LVK observations 17.9 − 44 Gpc−3 yr−1 (Abbott et al. 2023). However, it is important to note that we have only examined galaxies in a limited (8.5 ≤ log(ℳ⋆/M⊙)≤11) and incomplete mass range (no simulation of galaxy in 10 ≤ log(ℳ⋆/M⊙)≤10.5). We have not explored the contribution of the smallest dwarf galaxies, which are not expected to host any massive clusters, or that of a galaxy more massive than the MW, which would certainly have a very large number of dynamically formed BBH mergers. In addition, this model takes into account BBHs formed in massive star clusters exclusively. The omitted contribution of lower-mass clusters will be discussed in the next section.
Local BBH mergers, number density of galaxies, and local BBH merger rate for our six simulated galaxies.
4.4. BBH formation in low-mass clusters
As the code for cluster evolution CMC that we used is based on a Hénon-style Monte Carlo approach (see Sect. 2.3), a minimum initial number of particles (∼105) is required to ensure that the cluster relaxation timescale is significantly longer than the dynamical timescale. This corresponds to a cluster initial mass Mcl ∼ 6 × 10⁴ M⊙. We have therefore not considered in this work the formation of BBHs in less massive clusters. However, several studies have shown that young stellar clusters could make a great contribution to the population of merging BBHs. Mapelli et al. (2022) predict that the local BBH merger rate density ℛBBH(z < 0.2) is of the same order of magnitude for BBHs formed in GCs and in YSCs in all their models.
Adopting the BBH merger efficiency as a function of metallicity presented in Di Carlo et al. (2020) for YSCs with masses between 103 and 3 × 10⁴ M⊙, we can estimate the number of BBH mergers formed within star clusters in this mass range in our cosmological simulations. We find 1078, 1307, 2351, and 32790 BBH mergers from the YSCs in m11e, m11h, m11d, and m12i, respectively. These figures are comparable to and higher than the number of BBH mergers found in the most massive clusters. This other formation channel should also be taken into account to create a more complete population of BBHs in our simulations.
However, the BBHs formed in YSCs are expected to have quite different physical properties than the ones formed in GCs. Torniamenti et al. (2022) show that low-mass clusters form, for the most part, low-mass BBHs are shaped primarily by binary evolution. In addition, the vast majority of BBHs formed in YSCs reach coalescence after being ejected from their parent cluster. This is because the escape velocity is generally lower in these low-mass clusters. It is therefore impossible for hierarchical mergers to take place in such environments (Gerosa & Berti 2019), which makes this a distinctive feature in the properties of the BBHs formed between these two populations of star clusters.
As most stars form in YSCs, and in particular massive stars (Portegies Zwart et al. 2010), it would be complicated to differentiate BBH mergers formed in low-mass clusters from isolated field mergers in our cosmological simulations, but this question is outside the scope of this work.
5. Conclusions
In this work we have modelled the formation of star clusters in six cosmological zoom-in simulations of galaxies taken from the FIRE-2 project using a cloud-to-cluster formation framework applied to the GMCs identified in each simulation. Extending on the work presented in Paper I and Paper II, we have evolved the massive clusters with the Monte Carlo code CMC and studied the characteristics of the BBH mergers occurring in all six galaxies. The cosmological simulations provide self-consistent environments for star formation, while the impact of the galactic environment on cluster evolution is taken into account through time-dependent tidal fields and dynamical friction. We have found distinct features that could prove decisive in better understanding the properties of BBH mergers observed so far in the first three observation runs and currently during the fourth LVK observing run.
-
The total mass of stars formed in bound clusters scales with the present-day stellar mass of the galaxy. Specifically, the slope of the cluster initial mass function appears to be correlated with the stellar mass of the galaxy, with the more massive galaxies having shallower slopes. Massive clusters (Mcl ≥ 6 × 10⁴ M⊙) are rarely formed in galaxies with present-day stellar masses below ℳ⋆ ∼ 109 M⊙.
-
Certain stellar feedback mechanisms in metal-rich clouds of gas tend to hinder the formation of star clusters. As such, massive clusters generally form at epochs when the metallicity of the galaxy is still sub-solar. The formation of very massive and dense GMCs, resulting mainly from major mergers of massive galaxies, can explain the presence of metal-rich clusters in MW-like galaxies.
-
In the most massive dwarf galaxies (ℳ⋆ ≳ 109 M⊙), a small number of very massive clusters, which are particularly efficient at forming merging BBHs, can make up for a similar contribution to the total population of merging BBHs as the less massive ones. In galaxies with masses similar to the MW or even more massive, one extremely massive and dense cluster may be sufficient to dominate the formation of merging BBHs over all the other massive clusters.
-
In agreement with previous studies, we find that the physical properties of BBHs formed in massive clusters can have very distinct features. The possibility of hierarchical mergers in such dense environments allows for the formation of BHs above the pair-instability mass gap, which are often part of BBHs with unequal mass components. These extreme events, which are hard to explain with isolated binary evolution, could be unique signatures of dynamical formation.
-
In addition to the general scaling with the galaxy stellar mass, there are clear correlations between the star formation history of each galaxy and the BBH merger rate from massive clusters. In particular, major mergers of galaxies appear to drive the formation of massive clusters, which in turn result in the formation of merging BBHs.
This study represents the first attempt to estimate the populations of merging BBHs formed in massive clusters within cosmological simulations of galaxies. These results highlight the importance of modelling the formation of merging BBHs at a galactic level. In a follow-up study, we will explore different formation channels of BBHs in these realistic environments and use constraints from the ever-growing list of BBH mergers reported by the LVK Collaboration to infer their respective contributions.
See LVK Public Alerts at https://gracedb.ligo.org/superevents/public/O4/
https://wwwmpa.mpa-garching.mpg.de/gadget/users-guide.pdf
Acknowledgments
Tristan Bruel and Astrid Lamberts are supported by the ANR COSMERGE project, grant ANR-20-CE31-001 of the French Agence Nationale de la Recherche. Carl L. Rodriguez acknowledges support from NSF Grant AST-2009916, NASA ATP Grant 80NSSC22K0722, a Alfred P. Sloan Research Fellowship, and a David and Lucile Packard Foundation Fellowship. This work was supported by the “Programme National des Hautes Energies” (PNHE) of CNRS/INSU co-funded by CEA and CNES’ and the authors acknowledge HPC resources from “Mesocentre SIGAMM” hosted by Observatoire de la Côte d’Azur. This work made use of infrastructure services provided by the Science IT team of the University of Zurich (www.s3it.uzh.ch). Support for MYG was provided by NASA through the NASA Hubble Fellowship grant #HST-HF2-51479 awarded by the Space Telescope Science Institute, which is operated by the Association of Universities for Research in Astronomy, Inc., for NASA, under contract NAS5-26555.
References
- Abbott, B. P., Abbott, R., Abbott, T. D., et al. 2016, Phys. Rev. Lett., 116, 061102 [Google Scholar]
- Abbott, R., Abbott, T. D., Abraham, S., et al. 2020a, ApJ, 900, L13 [NASA ADS] [CrossRef] [Google Scholar]
- Abbott, R., Abbott, T. D., Abraham, S., et al. 2020b, Phys. Rev. D, 102, 043015 [NASA ADS] [CrossRef] [Google Scholar]
- Abbott, R., Abbott, T. D., Acernese, F., et al. 2023, Phys. Rev. X, 13, 011048 [NASA ADS] [Google Scholar]
- Adamo, A., Kruijssen, J. M. D., Bastian, N., Silva-Villa, E., & Ryon, J. 2015, MNRAS, 452, 246 [NASA ADS] [CrossRef] [Google Scholar]
- Antonini, F., & Gieles, M. 2020, Phys. Rev. D, 102, 123016 [NASA ADS] [CrossRef] [Google Scholar]
- Arca Sedda, M., Mapelli, M., Spera, M., Benacquista, M., & Giacobbo, N. 2020, ApJ, 894, 133 [NASA ADS] [CrossRef] [Google Scholar]
- Artale, M. C., Mapelli, M., Giacobbo, N., et al. 2019, MNRAS, 487, 1675 [NASA ADS] [CrossRef] [Google Scholar]
- Banerjee, S. 2017, MNRAS, 467, 524 [NASA ADS] [Google Scholar]
- Bavera, S. S., Fragos, T., Zevin, M., et al. 2021, A&A, 647, A153 [NASA ADS] [CrossRef] [EDP Sciences] [Google Scholar]
- Beasley, M. A. 2020, Reviews in Frontiers of Modern Astrophysics (Springer International Publishing), 245 [CrossRef] [Google Scholar]
- Behroozi, P. S., Wechsler, R. H., & Wu, H.-Y. 2012, ApJ, 762, 109 [Google Scholar]
- Belczynski, K., Kalogera, V., & Bulik, T. 2002, ApJ, 572, 407 [NASA ADS] [CrossRef] [Google Scholar]
- Belczynski, K., Holz, D. E., Bulik, T., & O’Shaughnessy, R. 2016, Nature, 534, 512 [NASA ADS] [CrossRef] [Google Scholar]
- Benincasa, S. M., Loebman, S. R., Wetzel, A., et al. 2020, MNRAS, 497, 3993 [NASA ADS] [CrossRef] [Google Scholar]
- Berek, S. C., Eadie, G. M., Speagle, J. S., & Harris, W. E. 2023, ApJ, 955, 22 [NASA ADS] [CrossRef] [Google Scholar]
- Bethe, H. A., & Brown, G. E. 1998, ApJ, 506, 780 [Google Scholar]
- Binney, J., & Tremaine, S. 2008, Galactic Dynamics: Second Edition (Princeton: Princeton University Press) [Google Scholar]
- Bouffanais, Y., Mapelli, M., Santoliquido, F., et al. 2021a, MNRAS, 507, 5224 [NASA ADS] [CrossRef] [Google Scholar]
- Bouffanais, Y., Mapelli, M., Santoliquido, F., et al. 2021b, MNRAS, 505, 3873 [NASA ADS] [CrossRef] [Google Scholar]
- Breivik, K., Coughlin, S., Zevin, M., et al. 2020, ApJ, 898, 71 [Google Scholar]
- Briel, M. M., Eldridge, J. J., Stanway, E. R., Stevance, H. F., & Chrimes, A. A. 2022, MNRAS, 514, 1315 [NASA ADS] [CrossRef] [Google Scholar]
- Broekgaarden, F. S., Berger, E., Stevenson, S., et al. 2022, MNRAS, 516, 5737 [NASA ADS] [CrossRef] [Google Scholar]
- Caldwell, N., Schiavon, R., Morrison, H., Rose, J. A., & Harding, P. 2011, AJ, 141, 61 [NASA ADS] [CrossRef] [Google Scholar]
- Chatterjee, S., Rodriguez, C. L., & Rasio, F. A. 2017, ApJ, 834, 68 [NASA ADS] [CrossRef] [Google Scholar]
- Chevance, M., Kruijssen, J. M. D., Hygate, A. P. S., et al. 2019, MNRAS, 493, 2872 [Google Scholar]
- Choksi, N., Gnedin, O. Y., & Li, H. 2018, MNRAS, 480, 2343 [NASA ADS] [CrossRef] [Google Scholar]
- Chruślińska, M. 2024, Ann. Phys., 536, 2200170 [CrossRef] [Google Scholar]
- Claeys, J. S. W., Pols, O. R., Izzard, R. G., Vink, J., & Verbunt, F. W. M. 2014, A&A, 563, A83 [NASA ADS] [CrossRef] [EDP Sciences] [Google Scholar]
- Di Carlo, U. N., Giacobbo, N., Mapelli, M., et al. 2019, MNRAS, 487, 2947 [NASA ADS] [CrossRef] [Google Scholar]
- Di Carlo, U. N., Mapelli, M., Giacobbo, N., et al. 2020, MNRAS, 498, 495 [NASA ADS] [CrossRef] [Google Scholar]
- Dominik, M., Belczynski, K., Fryer, C., et al. 2012, ApJ, 759, 52 [Google Scholar]
- El-Badry, K., Quataert, E., Wetzel, A., et al. 2017, MNRAS, 473, 1930 [Google Scholar]
- El-Badry, K., Quataert, E., Weisz, D. R., Choksi, N., & Boylan-Kolchin, M. 2018, MNRAS, 482, 4528 [Google Scholar]
- Eldridge, J. J., & Stanway, E. R. 2016, MNRAS, 462, 3302 [Google Scholar]
- Elson, R. A. W., Fall, S. M., & Freeman, K. C. 1987, ApJ, 323, 54 [Google Scholar]
- Escala, I., Wetzel, A., Kirby, E. N., et al. 2017, MNRAS, 474, 2194 [Google Scholar]
- Fall, S. M., & Zhang, Q. 2001, ApJ, 561, 751 [NASA ADS] [CrossRef] [Google Scholar]
- Farag, E., Renzo, M., Farmer, R., Chidester, M. T., & Timmes, F. X. 2022, ApJ, 937, 112 [NASA ADS] [CrossRef] [Google Scholar]
- Faucher-Giguère, C.-A., Lidz, A., Zaldarriaga, M., & Hernquist, L. 2009, ApJ, 703, 1416 [Google Scholar]
- Forbes, D. A., Bastian, N., Gieles, M., et al. 2018, Proc. R. Soc. A: Math. Phys. Eng. Sci., 474, 20170616 [Google Scholar]
- Fryer, C. L., Belczynski, K., Wiktorowicz, G., et al. 2012, ApJ, 749, 91 [Google Scholar]
- Gerosa, D., & Berti, E. 2019, Phys. Rev. D, 100, 041301 [NASA ADS] [CrossRef] [Google Scholar]
- Giacobbo, N., & Mapelli, M. 2018, MNRAS, 480, 2011 [Google Scholar]
- González, E., Kremer, K., Chatterjee, S., et al. 2021, ApJ, 908, L29 [CrossRef] [Google Scholar]
- Grevesse, N., & Sauval, A. J. 1998, Space Sci. Rev., 85, 161 [Google Scholar]
- Grudić, M. Y., Diederik Kruijssen, J. M., Faucher-Giguère, C.-A., et al. 2021, MNRAS, 506, 3239 [NASA ADS] [CrossRef] [Google Scholar]
- Grudić, M. Y., Hafen, Z., Rodriguez, C. L., et al. 2022, MNRAS, 519, 1366 [CrossRef] [Google Scholar]
- Guszejnov, D., Grudić, M. Y., Offner, S. S. R., et al. 2019, MNRAS, 492, 488 [Google Scholar]
- Harris, W. E. 1996, AJ, 112, 1487 [Google Scholar]
- Hénon, M. H. 1971, Ap&SS, 14, 151 [Google Scholar]
- Hobbs, G., Lorimer, D. R., Lyne, A. G., & Kramer, M. 2005, MNRAS, 360, 974 [Google Scholar]
- Hopkins, P. F. 2015, MNRAS, 450, 53 [Google Scholar]
- Hopkins, P. F., Quataert, E., & Murray, N. 2012, MNRAS, 421, 3488 [NASA ADS] [CrossRef] [Google Scholar]
- Hopkins, P. F., Kereš, D., Oñorbe, J., et al. 2014, MNRAS, 445, 581 [NASA ADS] [CrossRef] [Google Scholar]
- Hopkins, P. F., Wetzel, A., Kereš, D., et al. 2018, MNRAS, 480, 800 [NASA ADS] [CrossRef] [Google Scholar]
- Hopkins, P. F., Chan, T. K., Garrison-Kimmel, S., et al. 2020, MNRAS, 492, 3465 [NASA ADS] [CrossRef] [Google Scholar]
- Hurley, J. R., Tout, C. A., & Pols, O. R. 2002, MNRAS, 329, 897 [Google Scholar]
- Johnson, L. C., Seth, A. C., Dalcanton, J. J., et al. 2016, ApJ, 827, 33 [NASA ADS] [CrossRef] [Google Scholar]
- Jordán, A., McLaughlin, D. E., Côté, P., et al. 2007, ApJS, 171, 101 [CrossRef] [Google Scholar]
- Joshi, K. J., Rasio, F. A., & Zwart, S. P. 2000, ApJ, 540, 969 [NASA ADS] [CrossRef] [Google Scholar]
- Kasen, D., Woosley, S. E., & Heger, A. 2011, ApJ, 734, 102 [NASA ADS] [CrossRef] [Google Scholar]
- Kim, J.-H., Abel, T., Agertz, O., et al. 2013, ApJS, 210, 14 [CrossRef] [Google Scholar]
- Kim, J.-G., Ostriker, E. C., & Filippova, N. 2021, ApJ, 911, 128 [NASA ADS] [CrossRef] [Google Scholar]
- Kremer, K., Ye, C. S., Rui, N. Z., et al. 2020, ApJS, 247, 48 [NASA ADS] [CrossRef] [Google Scholar]
- Kroupa, P. 2001, MNRAS, 322, 231 [NASA ADS] [CrossRef] [Google Scholar]
- Kruijssen, J. M. D. 2012, MNRAS, 426, 3008 [Google Scholar]
- Kruijssen, J. M. D., Pfeffer, J. L., Reina-Campos, M., Crain, R. A., & Bastian, N. 2019, MNRAS, 486, 3180 [Google Scholar]
- Lacey, C., & Cole, S. 1993, MNRAS, 262, 627 [NASA ADS] [CrossRef] [Google Scholar]
- Lahén, N., Naab, T., Johansson, P. H., et al. 2019, ApJ, 879, L18 [CrossRef] [Google Scholar]
- Lamberts, A., Garrison-Kimmel, S., Hopkins, P. F., et al. 2018, MNRAS, 480, 2704 [NASA ADS] [CrossRef] [Google Scholar]
- Lamberts, A., Blunt, S., Littenberg, T. B., et al. 2019, MNRAS, 490, 5888 [NASA ADS] [CrossRef] [Google Scholar]
- Leitherer, C., Schaerer, D., Goldader, J. D., et al. 1999, ApJS, 123, 3 [Google Scholar]
- Li, H., & Gnedin, O. Y. 2014, ApJ, 796, 10 [Google Scholar]
- Li, H., & Gnedin, O. Y. 2019, MNRAS, 486, 4030 [NASA ADS] [CrossRef] [Google Scholar]
- Li, H., Gnedin, O. Y., Gnedin, N. Y., et al. 2017, ApJ, 834, 69 [NASA ADS] [CrossRef] [Google Scholar]
- Li, H., Gnedin, O. Y., & Gnedin, N. Y. 2018, ApJ, 861, 107 [Google Scholar]
- Ma, X., Grudić, M. Y., Quataert, E., et al. 2020, MNRAS, 493, 4315 [NASA ADS] [CrossRef] [Google Scholar]
- Mandel, I., & Broekgaarden, F. S. 2022, Liv. Rev. Relat., 25, 1 [Google Scholar]
- Mapelli, M. 2020, Formation Channels of Single and Binary Stellar-Mass Black Holes (Singapore: Springer), 1 [Google Scholar]
- Mapelli, M., Giacobbo, N., Toffano, M., et al. 2018, MNRAS, 481, 5324 [NASA ADS] [CrossRef] [Google Scholar]
- Mapelli, M., Bouffanais, Y., Santoliquido, F., Arca Sedda, M., & Artale, M. C. 2022, MNRAS, 511, 5797 [NASA ADS] [CrossRef] [Google Scholar]
- Marchant, P., Renzo, M., Farmer, R., et al. 2019, ApJ, 882, 36 [Google Scholar]
- Morscher, M., Pattabiraman, B., Rodriguez, C., Rasio, F. A., & Umbreit, S. 2015, ApJ, 800, 9 [NASA ADS] [CrossRef] [Google Scholar]
- Muratov, A. L., & Gnedin, O. Y. 2010, ApJ, 718, 1266 [Google Scholar]
- Neijssel, C. J., Vigna-Gómez, A., Stevenson, S., et al. 2019, MNRAS, 490, 3740 [Google Scholar]
- O’Shaughnessy, R., Bellovary, J. M., Brooks, A., et al. 2016, MNRAS, 464, 2831 [Google Scholar]
- Padoan, P., Haugbølle, T., & Nordlund, Å. 2012, ApJ, 759, L27 [Google Scholar]
- Pattabiraman, B., Umbreit, S., Liao, W.-K., et al. 2013, ApJS, 204, 15 [NASA ADS] [CrossRef] [Google Scholar]
- Pfeffer, J., Kruijssen, J. M. D., Crain, R. A., & Bastian, N. 2018, MNRAS, 475, 4309 [Google Scholar]
- Planck Collaboration VI. 2020, A&A, 641, A6 [NASA ADS] [CrossRef] [EDP Sciences] [Google Scholar]
- Portegies Zwart, S. F., & McMillan, S. L. W. 1999, ApJ, 528, L17 [Google Scholar]
- Portegies Zwart, S. F., McMillan, S. L., & Gieles, M. 2010, ARA&A, 48, 431 [NASA ADS] [CrossRef] [Google Scholar]
- Rodriguez, C. L., & Loeb, A. 2018, ApJ, 866, L5 [NASA ADS] [CrossRef] [Google Scholar]
- Rodriguez, C. L., Morscher, M., Pattabiraman, B., et al. 2015, Phys. Rev. Lett., 115, 051101 [Google Scholar]
- Rodriguez, C. L., Chatterjee, S., & Rasio, F. A. 2016, Phys. Rev. D, 93, 084029 [NASA ADS] [CrossRef] [Google Scholar]
- Rodriguez, C. L., Amaro-Seoane, P., Chatterjee, S., & Rasio, F. A. 2018, Phys. Rev. Lett., 120, 151101 [NASA ADS] [CrossRef] [Google Scholar]
- Rodriguez, C. L., Kremer, K., Grudić, M. Y., et al. 2020, ApJ, 896, L10 [NASA ADS] [CrossRef] [Google Scholar]
- Rodriguez, C. L., Weatherford, N. C., Coughlin, S. C., et al. 2022, ApJS, 258, 22 [NASA ADS] [CrossRef] [Google Scholar]
- Rodriguez, C. L., Hafen, Z., Grudić, M. Y., et al. 2023, MNRAS, 521, 124 [CrossRef] [Google Scholar]
- Santoliquido, F., Mapelli, M., Giacobbo, N., Bouffanais, Y., & Artale, M. C. 2021, MNRAS, 502, 4877 [NASA ADS] [CrossRef] [Google Scholar]
- Santoliquido, F., Mapelli, M., Artale, M. C., & Boco, L. 2022, MNRAS, 516, 3297 [NASA ADS] [CrossRef] [Google Scholar]
- Schaye, J., Crain, R. A., Bower, R. G., et al. 2014, MNRAS, 446, 521 [Google Scholar]
- Schechter, P. 1976, ApJ, 203, 297 [Google Scholar]
- Sigurdsson, S., & Hernquist, L. 1993, Nature, 364, 423 [Google Scholar]
- Smith, B. D., & Lang, M. 2019, J. Open Sour. Softw., 4, 1881 [NASA ADS] [CrossRef] [Google Scholar]
- Srinivasan, R., Lamberts, A., Bizouard, M. A., Bruel, T., & Mastrogiovanni, S. 2023, MNRAS, 524, 60 [CrossRef] [Google Scholar]
- Stevenson, S., Vigna-Gómez, A., Mandel, I., et al. 2017, Nat. Commun., 8, 14906 [Google Scholar]
- Su, K.-Y., Hopkins, P. F., Hayward, C. C., et al. 2017, MNRAS, 471, 144 [NASA ADS] [CrossRef] [Google Scholar]
- Tomczak, A. R., Quadri, R. F., Tran, K.-V. H., et al. 2014, ApJ, 783, 85 [Google Scholar]
- Torniamenti, S., Rastello, S., Mapelli, M., et al. 2022, MNRAS, 517, 2953 [NASA ADS] [CrossRef] [Google Scholar]
- The LIGO Scientific Collaboration, Virgo Collaboration & KAGRA Collaboration (Abbott, R., et al.) 2023, Phys. Rev. X, 13, 041039 [Google Scholar]
- van Haaften, L. M., Nelemans, G., Voss, R., et al. 2013, A&A, 552, A69 [NASA ADS] [CrossRef] [EDP Sciences] [Google Scholar]
- van Son, L. A. C., Mink, S. E. D., Broekgaarden, F. S., et al. 2020, ApJ, 897, 100 [NASA ADS] [CrossRef] [Google Scholar]
- Vink, J. S., & de Koter, A. 2005, A&A, 442, 587 [NASA ADS] [CrossRef] [EDP Sciences] [Google Scholar]
- Vink, J. S., de Koter, A., & Lamers, H. J. G. L. M. 2001, A&A, 369, 574 [NASA ADS] [CrossRef] [EDP Sciences] [Google Scholar]
- Wetzel, A. R., Hopkins, P. F. H., Kim, J.-H., et al. 2016, ApJ, 827, L23 [NASA ADS] [CrossRef] [Google Scholar]
- Wetzel, A., Hayward, C. C., Sanderson, R. E., et al. 2023, ApJS, 265, 44 [NASA ADS] [CrossRef] [Google Scholar]
- Wong, K. W. K., Breivik, K., Kremer, K., & Callister, T. 2021, Phys. Rev. D, 103, 083021 [Google Scholar]
- Woosley, S. E. 2017, ApJ, 836, 244 [Google Scholar]
- Woosley, S. E., & Heger, A. 2021, ApJ, 912, L31 [NASA ADS] [CrossRef] [Google Scholar]
- Zevin, M., Bavera, S. S., Berry, C. P. L., et al. 2021, ApJ, 910, 152 [Google Scholar]
All Tables
Properties of the primary halo at redshift z = 0 for all the zoom-in simulations used in this study.
Local BBH mergers, number density of galaxies, and local BBH merger rate for our six simulated galaxies.
All Figures
|
Fig. 1. Diagram of our procedure for modelling the formation and evolution of star clusters in a FIRE-2 cosmological zoom-in simulation of a galaxy. The method is described in full in Sect. 2. |
| In the text | |
|
Fig. 2. SFR (left) and mean metallicity of newly formed stars (right) as a function of time in our six FIRE-2 cosmological simulations. The SFR and mean metallicity are calculated using time bins of 250 Myr. |
| In the text | |
|
Fig. 3. Distributions in masses and radii of all the GMCs identified in the MW-like galaxy m12i (left), in m11d (centre), and in the four other cosmological simulations of dwarf galaxies considered in this study (right). The diagonal dashed grey lines represent lines of constant surface density |
| In the text | |
|
Fig. 4. Initial mass distributions of all clusters sampled in our six zoom-in simulations of galaxies. We consider here all the clusters formed without taking their different formation redshifts into account. The different simulations are indicated with the same colours as in Fig. 2. Dashed lines correspond to the best power-law fits. The grey shaded region indicates the mass range Mcl < 6 × 10⁴ M⊙, which we do not model with CMC. This limit roughly corresponds to an initial number of particles of 105. |
| In the text | |
|
Fig. 5. Metallicity distributions of all clusters sampled in our six zoom-in simulations of galaxies (top). The different simulations are indicated with the same colours as in Fig. 2. The minimal value of metallicity admitted in the FIRE-2 simulations is ∼10−4 Z⊙, which causes a stacking at low-metallicity visible on the plot. Metallicity distributions in the simulations m11d (centre) and m12i (bottom) of all stars (black line), all clusters (coloured line), massive clusters (filled area), and clusters in which merging BBHs form (hatched area). All histograms are normalised to one. |
| In the text | |
|
Fig. 6. Masses and radii of all the clusters sampled in the MW-like galaxy m12i (left), in m11d (centre), and in the four other cosmological simulations of dwarf galaxies considered in this study (right). Red dots indicate the number of BBHs formed in each cluster. |
| In the text | |
|
Fig. 7. Formation efficiency of merging BBHs per unit cluster initial stellar mass in all our clusters integrated with CMC. Boxes indicate the first to third quartiles, with red horizontal lines at the medians. Silver dots show outliers outside the first and third quartiles. The solid black line shows the best-fit power law and the shaded grey area represents the 1σ deviation on the power law coefficients. |
| In the text | |
|
Fig. 8. BBH primary mass (left) and mass ratio (right) distributions in the simulated galaxies m11e, m11h, and m11d. On the right-hand side plot, the hatched areas show the mass ratio distributions for the BBHs with a primary mass MBH1 > 50 M⊙ in all four galaxies combined. |
| In the text | |
|
Fig. 9. Distributions of delay times for all BBHs in the simulated galaxies m11e, m11h, m11d, and m12i. The hatched areas show the distribution of delay times for the massive BBHs (MBH1 > 50 M⊙) in all four galaxies combined. The dashed black lines show 1/τ distributions matching the delay times in m11d and m12i. |
| In the text | |
|
Fig. 10. Dynamical BBH merger rate in the simulated galaxies m11e, m11h, m11d, and m12i (left to right). In each subplot, the BBH merger rate is shown as a solid coloured line (number of mergers per unit time). Dotted lines represent the BBH merger rates of massive BBHs (MBH1 > 50 M⊙). The filled areas correspond to the formation rate of massive clusters. They indicate the total mass of massive clusters formed, divided by 105 M⊙, per unit time. The solid black line shows the SFR, divided by 105 M⊙, for comparison. |
| In the text | |
Current usage metrics show cumulative count of Article Views (full-text article views including HTML views, PDF and ePub downloads, according to the available data) and Abstracts Views on Vision4Press platform.
Data correspond to usage on the plateform after 2015. The current usage metrics is available 48-96 hours after online publication and is updated daily on week days.
Initial download of the metrics may take a while.