Fig. 10.
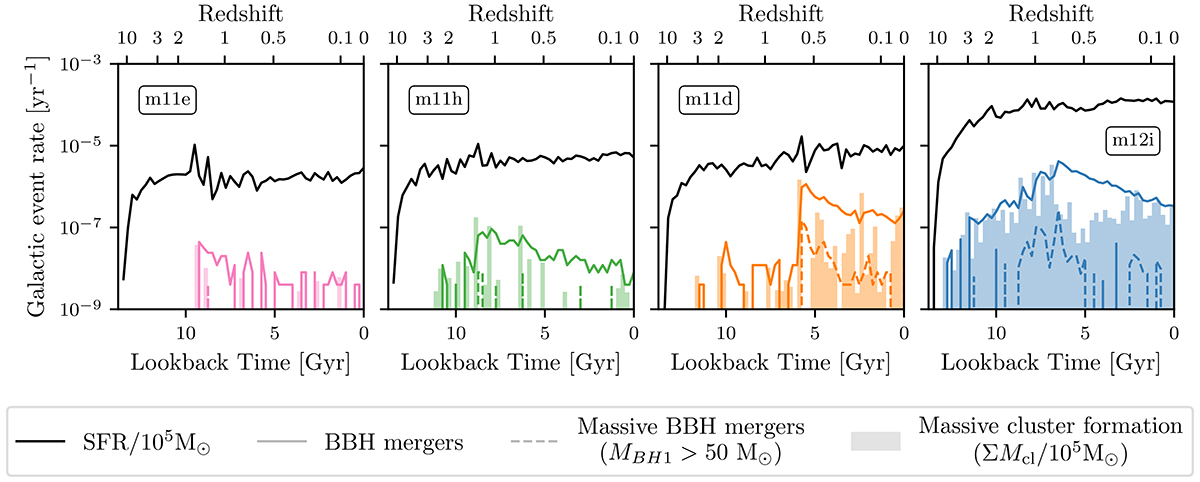
Download original image
Dynamical BBH merger rate in the simulated galaxies m11e, m11h, m11d, and m12i (left to right). In each subplot, the BBH merger rate is shown as a solid coloured line (number of mergers per unit time). Dotted lines represent the BBH merger rates of massive BBHs (MBH1 > 50 M⊙). The filled areas correspond to the formation rate of massive clusters. They indicate the total mass of massive clusters formed, divided by 105 M⊙, per unit time. The solid black line shows the SFR, divided by 105 M⊙, for comparison.
Current usage metrics show cumulative count of Article Views (full-text article views including HTML views, PDF and ePub downloads, according to the available data) and Abstracts Views on Vision4Press platform.
Data correspond to usage on the plateform after 2015. The current usage metrics is available 48-96 hours after online publication and is updated daily on week days.
Initial download of the metrics may take a while.