| Issue |
A&A
Volume 692, December 2024
|
|
|---|---|---|
| Article Number | A85 | |
| Number of page(s) | 9 | |
| Section | Astrophysical processes | |
| DOI | https://doi.org/10.1051/0004-6361/202451278 | |
| Published online | 04 December 2024 | |
Analytical study of the merging rate of low-mass intermediate-mass black holes in preparation for the future Einstein Telescope
1
Department of Chemical, Physical, Mathematical and Natural Sciences, University of Sassari, Via Vienna, 07100 Sassari, Italy
2
Istituto Nazionale di Fisica Nucleare – Sezione di Cagliari, Monserrato, 09042 Cagliari, Italy
3
Department of Physics and Astronomy, University of Catania, Via S. Sofia, 95123 Catania, Italy
4
Istituto Nazionale di Fisica Nucleare – Laboratori Nazionali del Sud, Via S. Sofia, 95125 Catania, Italy
5
Dipartimento di Fisica, Università degli Studi di Milano-Bicocca, Piazza della Scienza 3, 20126 Milano, Italy
6
Istituto Nazionale Fisica Nucleare – Sezione di Milano-Bicocca, Piazza della Scienza 3, 20126 Milano, Italy
7
Department of Physics, University of Naples Federico II, 80126 Naples, Italy
8
Istituto Nazionale di Fisica Nucleare – Sezione di Napoli, Via Cinthia, 80126 Napoli, Italy
9
Scuola Internazionale Superiore di Studi Avanzati, Via Bonomea, 34136 Trieste, Italy
⋆ Corresponding authors; This email address is being protected from spambots. You need JavaScript enabled to view it.
; This email address is being protected from spambots. You need JavaScript enabled to view it.
Received:
27
June
2024
Accepted:
26
October
2024
Abstract
Context. The detection of gravitational wave (GW) signals by Advanced LIGO, Virgo, and KAGRA interferometers opened a new chapter in our understanding of the formation of compact objects. In particular, the detection of GW190521 is observational confirmation of the existence of intermediate-mass black holes (IMBHs); yet more direct observations are needed to better understand the mechanisms behind their formation.
Aims. In this study, we explore the potential of the next-generation ground-based detector, the Einstein Telescope (ET), to advance our understanding of astrophysics through the detection of GWs emitted by IMBHs. To achieve this, the ET is designed to have improved sensitivity in the low-frequency range of approximately 2–10 Hz, enabling the detection of GWs originating from binary systems containing IMBHs with masses in the range of approximately 102–105 M⊙.
Methods. We consider black holes (BHs) in the pair-instability form via the hierarchical merger model in galaxies, and approximate the number of events that could be observed by the ET.
Results. Our findings indicate that ET could detect a binary black hole (BBH) merger rate of around 2 × 10⁵ Gpc−3 yr−1 for BH masses ranging from 10 to 200 M⊙, with around 100 Gpc−3 yr−1 of this rate specifically attributed to BHs in the 100–200 M⊙ mass range, which we classify as low-mass IMBHs in this study. This suggests that ET could detect several dozen events similar to GW190521. The exact locations of these BBH mergers are not specified and we count our BH mergers across the entire universe up to a redshift of z ≈ 2.
Conclusions. Observations made with the ET are expected to significantly enhance our comprehension of galactic BH growth, and the existence and characteristics of low-mass IMBHs.
Key words: black hole physics / gravitational waves / stars: black holes
© The Authors 2024
 Open Access article, published by EDP Sciences, under the terms of the Creative Commons Attribution License (https://creativecommons.org/licenses/by/4.0), which permits unrestricted use, distribution, and reproduction in any medium, provided the original work is properly cited.
This article is published in open access under the Subscribe to Open model. This email address is being protected from spambots. You need JavaScript enabled to view it. to support open access publication.
1. Introduction
Since the detection of gravitational waves (GWs) from the merger of binary black holes (BBHs) by the Laser Interferometer Gravitational-Wave Observatory (LIGO) in 2015 (Abbott et al. 2016), the scientific community has revealed dozens of other detections of GWs from the coalescence of compact objects with stellar mass (either a pair of BHs, a pair of neutron stars (NSs), or a combination of the two). Black holes (BHs) can be organized into different groups according to their mass. The so-called stellar-mass BHs are thought to originate from the core collapse of massive stars (Fryer 2013; Camenzind 2007) in a process that is still not fully understood (Volonteri 2012; Perets 2022), and they are expected to have masses of between 3 and 100 M⊙. Mandic et al. (2016) also suggested that large-mass BH binary systems, such as GW150914, could be of primordial origin, whose progenitors formed via the accretion of the first massive stars of Pop III. The lower mass limit for large-mass BHs lies in between the least massive BH and the upper limit for a neutron star (Bailyn et al. 1998). The upper mass limit for a stellar-mass BH can be formed due to the accretion of one of the BHs revealed through X-ray emission in a binary system (Lewin et al. 1997), though stellar evolution models predict a gap in the stellar BH mass distribution (see Farmer et al. 2019). In their most massive form, with masses of up to 108 M⊙, BHs are found at the centers of galaxies, and they are associated with active galactic nuclei (AGNs), and are classified as supermassive black holes (SMBHs; Kormendy & Richstone 1995). The heaviest known SMBH associated with a quasar is TON 618 with a mass of about 7 × 10¹⁰ M⊙ (Shemmer et al. 2004).
There is also a class of BHs in between stellar-mass BHs and SMBHs, namely the intermediate-mass black holes (IMBHs), which have masses of about 102–105 M⊙; these might be the progenitors of SMBHs (Ebisuzaki et al. 2001). Several formation scenarios for IMBHs have been discussed in the literature, ranging from the evolution of Population III stars in primordial gas clouds (Ohkubo et al. 2009; Susa et al. 2014), to dynamical encounters, and mergers of stellar-mass BHs (see e.g., Di Carlo et al. 2021; Rose et al. 2022).
GW190521 was observed in 2019, originating from a pair of BHs with masses of about 85 and 66 M⊙, which is within the mass gap predicted by standard pair-instability supernova theory. This interaction led to the formation of an IMBH after their merger. This is the only such observation made by the current GW detectors where the nearly isotropic spin orientation for the formed IMBH is consistent with the dynamical formation scenario of a hierarchical BH merger (Abbott et al. 2020a). This event had a duration of about 0.1s, appearing in the frequency band of the gravitational interferometers between 30 and 80 Hz and peaking at 60 Hz, which is characteristic of a massive system (Abbott et al. 2020a). Although this observation of GW190521 strongly suggests that two massive BHs can subsequently form an IMBH via hierarchical multiple low-mass BH coalescence (Abbott et al. 2016; Chatziioannou et al. 2019), GW signals from similar events are expected to be observed by the future GW detectors. More direct observations of this kind are necessary to better understand the mechanisms behind the formation of IMBHs (with masses of between 102 and 105 M⊙), as GWs emitted by their progenitors during the merger are most likely to be observed in the frequency range reaching down to ∼1 Hz (Maggiore et al. 2020).
The Einstein Telescope (ET), the European third-generation GW detector hosted in an underground infrastructure (Di Pace et al. 2022), will be able to detect up to as many as several hundred GW signals per year (105–106) at a redshift of z = 10 (Maggiore et al. 2020) and will be able to probe, for the first time, signals in the low-frequency range. Compared to current detectors1, ET will improve the sensitivity at low frequencies, especially below 10 Hz. As a consequence, the GW signal will be detectable by the instrument at frequencies below 20–30 Hz, allowing for earlier and more comprehensive observations. This will allow us to reconstruct the GW signal in the early inspiral phase of compact binary coalescence before the merger, as these signals will remain detectable within the sensitivity range of ET for a longer duration. This increases the signal-to-noise ratio (S/N) by about 50 for a BH–BH pair with a total mass of 50–100 M⊙, allowing more accurate parameter estimations (Maggiore et al. 2020). The ET will significantly enhance our understanding of galactic BH growth, the existence and properties of IMBHs, and the astrophysics of globular clusters (GCs). Furthermore, thanks to improvements in its sensitivity, the ET in particular will be a valuable addition to multi-messenger observations focusing on astrophysical transients.
Given the extraordinary potentiality of ET, we present a study of the rate of low-mass IMBH merger events per year that ET is likely to be able to observe for different combinations of masses. In particular, we analyze the rate of IMBHs that exhibit masses similar to those of the BHs that gave rise to the GW190521 detection. Our analytical method and model are reported in Sect. 2, followed by our results in Sect. 2.5. Finally, we discuss and summarize our findings in Sects. 3 and 4, respectively.
2. Method and model
The detection of GW190521 showed that its progenitors likely had masses in the pair-instability gap (from about 65 to 130 M⊙), formed via a supernova explosion (Woosley & Heger 2021), rather than through standard stellar evolution. Stars with a low helium core mass (32–64 M⊙) are subject to pulsational pair instability, leaving behind remnants with masses less than 65 M⊙, while stars with a high helium core mass (64–135 M⊙) either experience pair instability supernovae (PISN) or directly collapse into IMBHs (Mapelli et al. 2020). Indeed, Abbott et al. (2020b) showed that the heavier binary component of GW190521 is consistent with BH formation via PISN. These authors also presented several possible formation scenarios for BHs in the pair-instability mass gap, such as hierarchical mergers occurring within galaxies.
In the present work, we assume that stellar-mass BHs are already formed in molecular clouds (Rice & Zhang 2021) given that their mass is no less than 10 M⊙. In such an environment, two equal-mass BHs can form simultaneously, and through a hierarchical process, they can merge with others to form larger BHs over time (Matsubayashi et al. 2004). Based on such a model for the formation of massive BHs, we extend the semi-analytical approach presented by Shinkai et al. (2017) in terms of cosmological constraints and get our final result: the cumulative distribution of BH mergers in a galaxy, enabling the estimation of IMBH merger rates. We outline our method below, which we used to estimate the observational detectability of IMBH merger events with the future ET.
2.1. Global mass distribution
Understanding the typical masses of galaxies and their distribution is a complex task that can be approached primarily through the halo mass function, a valuable tool that provides insights into the abundance and characteristics of galactic halos.
The halo mass function, f(σ), determines the quantity of halos that have emerged with a specific mass at a given redshift and cosmology. To define the number density of collapsed halos with mass M at redshift z, nh(M, z), Press & Schechter (1974) outlined the differential number density related to f(σ) in the generic formalism
 (1)
(1)
where  is the mean mass density of the Universe and σ(M, z) is the variance on the mass scale M. This variance can be expressed as
 (2)
(2)
where b(z) is the growth factor, P(k) is the linear power spectrum,  is the top-hat window function, and
  is the smoothing scale. The power spectrum can be parameterized as
 (3)
(3)
where ns = 0.96 is a free parameter and T(k) is the transfer function provided by Bardeen et al. (1987),
![Mathematical equation: $$ \begin{aligned} T(k)&= \frac{\ln (1+2.34q)}{2.34q}[1+3.89q+(16.1q)^2 \nonumber \\&+(5.46q)^3+(6.71q)^4]^{-1/4}, \end{aligned} $$](/articles/aa/full_html/2024/12/aa51278-24/aa51278-24-eq7.gif) (4)
(4)
with q ≡ k/hΓ,* where Γ* is given by Meiksin et al. (1999) (see their Table 1).
While the Press-Schechter theory was originally proposed as the first detailed model for the mass function, we employ the Sheth-Tormen halo mass function (Sheth & Tormen 1999) for the halo mass distribution. This function is an extension of the Press-Schechter formalism and has been found to align well with the outcomes of numerical simulations, as demonstrated by Jenkins et al. (2001) and others. The Sheth-Tormen mass function can be expressed as
![Mathematical equation: $$ \begin{aligned} f(\sigma ) = 0.3222\sqrt{\frac{2a}{\pi }}\left[1+\left(\frac{\sigma ^2}{a\delta _c^2}\right)^p\right]\frac{\delta _c}{\sigma } \exp \left(-\frac{a\delta _c^2}{2\sigma ^2}\right) ,\end{aligned} $$](/articles/aa/full_html/2024/12/aa51278-24/aa51278-24-eq8.gif) (5)
(5)
where a = 0.707, p = 0.3, and δc = 1.686.
Putting all the above equations together, we can express the number density of halos with masses between M and M + dM as
 (6)
(6)
The standard procedure for evaluating nh(M, z) involves first calculating σ(M, z) and its derivative. These quantities are then combined with the mass function, f(σ), to estimate the number density of halos.
By including the sub-haloes, Vale & Ostriker (2006) assume that all galaxies are either hosted individually in a parent halo or in one of the sub-haloes in the case of multiple systems, like clusters. We assume that considering haloes and sub-haloes comprehensively covers all hosts. Vale & Ostriker (2006) define the distribution of sub-haloes based on the occupation number (the number of sub-haloes in a parent halo of a given mass), Nsh(M), as
 (7)
(7)
where at high halo masses (approximately above ∼1013h−1 M⊙), the occupation number scales roughly as N ∼ M0.9. The number densities of halos, sub-haloes, and the sum of halos and sub-haloes,
 (8)
(8)
up to z ∼ 2 are illustrated in Fig. 1.
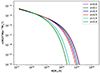 |
Fig. 1. Evolution of the halo number density, n(M), as a function of halo mass for redshifts in the range 0 ≤ z ≤ 2. |
Finally, the expected values of collapsed objects in the i-th mass bin and α-th redshift bin is given by Miao et al. (2023)
 (9)
(9)
where the volume element is
 (10)
(10)
where ΔΩ is the survey area in square degrees and
 (11)
(11)
The redshift evolution of  is depicted in Fig. 2. Throughout this paper, we use a standard cosmology of h = 0.7, and Ωm = 1 − ΩΛ = 0.3.
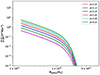 |
Fig. 2. Evolution of |
2.2. Hierarchical accumulation of black hole candidates in galaxies
The process described in Shinkai et al. (2017) is known as the hierarchical growth model, which explains how two nearby equal-mass BHs merge simultaneously and continue to undergo mergers resulting in IMBHs and SMBHs. An assumption is made that molecular clouds have sufficient material and gravitational force to undergo further collapse, leading to the formation of a BH at their cores. These clouds are likely the result of the collapse and fragmentation of giant molecular clouds with mass density functions similar to a Schechter-like function (Inutsuka et al. 2015). Similarly, the shape of the cluster mass function that originates from an individual molecular cloud is consistent with a Schechter-like function (Fujii & Portegies Zwart 2015). Based on the similarity of the mass scaling of giant molecular clouds and star clusters, we express the cumulative mass function of the BH-forming molecular clouds as
 (12)
(12)
This function describes the distribution of molecular clouds, indicating that there are different sizes and masses of these objects within the cloud population. In Fig. 3, we demonstrate the cumulative mass function for different initial molecular cloud masses (Mg) adopting the results of Fujii & Portegies Zwart (2015) simulations, A = 0.64, β=-1.73, and Mc, max = 0.20Mg0.76. We consider the total number of these BH-forming molecular clouds as the total (initial) number of BH candidates in a galaxy.
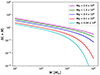 |
Fig. 3. Cumulative BH mass function. The colors represent different masses of initial molecular clouds, Mg, 2 × 10⁶, 106, 4 × 10⁵, 105, and 4 × 10⁴ M⊙, respectively. |
The next step is to assume a cluster with Nk equal-mass BHs of initial mass Mk. Thus, the total mass of this cluster, Mtotal, could be MkNk. The BHs within the cluster continue to form binaries and to merge. For the kth generation, the number of BHs is given by
 (13)
(13)
In other words, the number of BHs decreases with each generation as the BHs merge. The masses of the BHs formed in each generation follow a correlation; the mass Mk + 1 of BHs in the kth generation is given by
 (14)
(14)
Here, 2k − 1 represents the exponential growth in mass with each generation, while Mk represents the initial mass of each BH. It is important to note that the model presents a discrete distribution of BH masses, meaning that BH masses exist as distinct values rather than a continuous range. To approximate the number of binaries N(M), we can consider the number of initial fractions in the cluster. N(M) can be approximated as the total mass, Mtotal, divided by the kth BH mass, Mk + 1. In other words,
 (15)
(15)
To calculate the possible events of BH mergers in the Universe, Nmerger(MBH, z), we need to combine the product of Eqs. (8) and (12) together with Eqs. (13) and (15):
 (16)
(16)
The cumulative distribution function of BH mergers is illustrated in Fig. 4. The term  in the calculation above accounts for how the BHs with a total mass MIMBH are formed from smaller BHs with mass Mk + 1 at each stage of their growth. Including this term ensures that the merger rate is appropriately scaled based on the mass ratio between the IMBH and the BHs involved in the hierarchical accumulation process2.
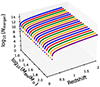 |
Fig. 4. Cumulative distribution function showing the number of BH mergers in relation to the redshift and mass of BHs, binned for different MBH. |
2.3. Simulated data
In order to estimate the rates of GW events, one must simulate the three typical phases of the signal-namely the inspiral phase, the merging phase, and the ring-down phase-and then analyze these simulations considering the signal and noise characteristics of a given detector. In this work, we simulate the waveform for low-mass IMBHs, such as GW190521, and apply the antenna response function for ET to calculate their respective S/Ns.
The LALsuite library (LIGO Scientific Collaboration 2020) is used to generate a BBH template waveform3: the LALsuite library is a package for gravitational and relativistic astrophysics, which we use to perform a numerical simulation of BBH coalescence events. The characteristics throughout all of the phases of a BBH waveform (inspiral, merger, and ringdown) are constructed accurately through phenomenological waveform4 models based on numerical-relativity simulations (Husa et al. 2016; Khan et al. 2016).
To better simulate the waveform, we assumed an isotropic distribution of the gravitational sources in the sky for equal-mass, non-spinning BHs, whereby
-
The inclination angle is generated according to a sin distribution in the interval [0,π];
-
The phase and polarization angle are generated according to a uniform distribution in the range [0, 2π];
-
A random sky location is extracted uniformly on a sphere.
The assumption of equal-mass binaries was made based on previous studies of the formation of GW190521, which analyzed hierarchical mergers of BHs in different stellar environments, specifically nuclear star clusters (NSCs), GCs, and young star clusters (YSCs). In dense stellar environments, such as GCs, IMBHs can form through repeated mergers of smaller black holes, leading to a population of relatively equal-mass binaries (see e.g., Mapelli et al. 2021).
As in earlier studies, for GW190521-like events in clusters, spin is generally negligible during the formation and merger process. The dominant factor is the dynamical interaction within the cluster, which drives the merger. Spin could be influenced later in the merger by triple interactions, but it is not a key initial factor in their formation (Banerjee 2022).
Nonetheless, we set the polarization of waveforms given as:
 (17)
(17)
 (18)
(18)
Such waveforms can be further decomposed using spin-weighted spherical harmonics of weight -2, as
 (19)
(19)
These polarized waveforms are then processed by an antenna response function to simulate their detection given a ground-based interferometer, while no background noise is added.
We adopt the optimally matched filtering S/N ρopt to evaluate the detectability of a GW signal with a given interferometer. This is defined according to the equation discussed in Gabbard et al. (2018):
 (20)
(20)
where u is the generated template and the inner product ⟨a, b⟩ is the noise-weighted cross-correlation (Owen & Sathyaprakash 1999):
![Mathematical equation: $$ \begin{aligned} \langle a, b \rangle = 4 \, \mathfrak{R} \left[ \int _{f_{\rm min}}^\infty \, df \frac{\tilde{a}^\star (f) \tilde{b}(f)}{S_n(f)} \right], \end{aligned} $$](/articles/aa/full_html/2024/12/aa51278-24/aa51278-24-eq27.gif) (21)
(21)
where  (
( ) is the frequency-domain representation of the strain a (b), Sn is the single-sided detector noise power spectral density (PSD), and fmin is the frequency of the GW template at the beginning of the time-series. As the ET will extend the lower frequency limit of the observation band toward 2 Hz (see e.g., Allocca et al. 2021), the chosen values of fmin are expected to fall within this range.
2.4. Sensitivity curves
The detector’s sensitivity curve represents the various noise sources across different frequencies that can affect its performance. This sensitivity needs to be taken into account when estimating the number of GW events that can be observed. There are several types of noise that can affect this curve. One of them is the seismic noise, which influences the low-frequency part of the spectrum (below a few Hz). Between a few Hz and a few tens of Hz, the main sources of noise are thermal noise, caused by random displacements of the mirror surfaces, and the Newtonian noise, which arises from gravitational disturbances due to the movement of nearby masses exerting dynamic forces on the mirrors.
Quantum noises, coming from both vacuum fluctuations of the electromagnetic field and quantum radiation pressure induced on the mirror, have a large impact of more than a few tens of Hz. All these noise sources together limit GW detections, and can be reduced by adopting improvements in the technology of the detector as well as data analysis techniques used to detect a GW. Current GW detectors, such as Advanced LIGO and Virgo, use seismic isolators that can dump the seismic noise (Acernese et al. 2010), while optimal choices of laser and mirrors can reduce the thermal and quantum noises.
One of the biggest challenges of the next generation of GW observatories will be to achieve one order of magnitude less noise with respect to Advanced LIGO and Virgo. The ET will be characterized by a triangular shape with a “xylophone” design. Each arm will be at least 10 km in length and be composed of two different interferometers: one optimized for low frequencies (ETLF) and one for high frequencies (ETHF). Furthermore, the ET will be built underground, allowing the use of cryogenic techniques for the low-frequency part to reduce thermal noise, along with seismic and Newtonian noises.
Studies have been carried out to estimate the ET design sensitivity curve, called ETD5. This estimation takes into consideration the choice of the configuration (e.g., detector geometry) and other parameters such as mirror material, diameter, and masses, as adopted in Hild et al. (2011). Further refinement is being developed by both the ET Instrumental Science Board (ISB) and the ET Observational Science Board (OSB) through comparison of science cases (Branchesi et al. 2023). In our study, we decided to use the ETD sensitivity curve reported in blue in Fig. 5. The design sensitivity curves of both Advanced LIGO and Virgo are also reported in the same figure in orange and green, respectively (sensitivities available from the LALsuite library LIGO Scientific Collaboration 2020). As evident in Fig. 5, the third-generation sensitivity curve represents a clear improvement over the second-generation ones. We would like to highlight that, since the ET design is not yet fixed, nor is its location, the sensitivity curves will continue to evolve and the present work will be updated in the future.
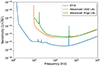 |
Fig. 5. Sensitivity curves used in the present paper. The design sensitivity of the ET is marked in blue. The Advanced LIGO and Virgo curves are colored orange and green, respectively. |
2.5. Merger rate of GW190521-like events
In this section, we investigate the merger rates of BBH events, specifically targeting those with mass characteristics similar to GW190521, which have masses between 100 M⊙ and 200 M⊙ and are defined in this study as low-mass IMBHs. Our exploration is initiated with simulations of S/Ns for BBHs at varying distances, from Figs. 6 to 8. The simulated S/N is considered for the BBH sources placed at fixed distances ranging from 1 to 5300 Mpc; this upper limit on distance is the luminosity distance of GW190521, corresponding to a redshift of about 0.8 (Abbott et al. 2020a,b). Furthermore, we assume equal-mass BBHs with a mass range spanning from 20 to 100 M⊙ with 5 M⊙ increments. The various configurations of BBHs studied can be found in Table 1.
Simulated S/Ns for BBH masses and distances.
We express the merger rate for BBHs as the anticipated number of BBH mergers per year, denoted as
 (22)
(22)
where V represents the volume of space within which the BBH mergers are simulated.
We derive the potential number of BBH mergers, Nmerger(MBH, z), applying simulated source distances and transforming them into the parameter z with Eq. (16). Consequently, the results for Nmerger(MBH, z) as a function of BH mass and redshift z are illustrated in Fig. 4.
To obtain an estimation of the rate of observable intermediate-mass BBH mergers, we define detectable events as those exceeding a detection threshold of S/N ≥ 12 for all BBH populations. For “golden events”6, this threshold rises to S/N ≥ 100, consistent with detectability values for ET designs (Branchesi et al. 2023).
Figure 6 depicts the cumulative number of BBH mergers identified with detection thresholds set at S/N ≥ 12 and S/N ≥ 100. In Fig. 7, we present the simulated S/N at distances of 1000 Mpc and 5300 Mpc, utilizing the sensitivity curves of ET, with detection thresholds set at S/N ≥ 12 and S/N ≥ 100. The choice of a 1000 Mpc distance was made because we attain a satisfactory S/N within the range of 1000 Mpc. Furthermore, we also explore the source distance as a function of BH mass using the sensitivity curve of ET as presented in Fig. 8.
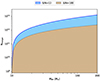 |
Fig. 6. Cumulative number of BBH mergers versus final BH masses associated with our detection thresholds at S/N ≥ 12 and S/N ≥ 100. |
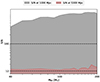 |
Fig. 7. S/N plotted against final BH masses at 1000 Mpc and 5300 Mpc for ET. The horizontal dashed lines correspond to our detection threshold S/N = 12 and S/N = 100. |
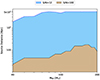 |
Fig. 8. ET source distance as a function of the final BH masses corresponding to our detection thresholds of S/N ≥ 12 and S/N ≥ 100. |
We limit the growth of the final BH mass to a maximum of 200 M⊙, as defined by Eq. (14), which is in the same range as the estimated mass of GW190521 (∼150 M⊙). Ultimately, the merger rate of BBH events, Rmerger, is calculated using Eq. (22), and the results are presented in Fig. 9 for all applicable S/Ns (S/N ≥ 12).
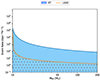 |
Fig. 9. The merger rate of BBH events as a function of mass, considering S/N ≥ 12. The hatched curve, distinguished by an orange edge color, demonstrates the corresponding Advanced LIGO event rate. |
3. Discussion and conclusions
In this section, we discuss the results of our study on the detectability of IMBH mergers by ET. In Fig. 10, we see an inverse relationship between S/N and redshift, confirming the suppression of S/N as redshift increases. The distinct decline observed before z ∼ 2 provides a well-defined redshift cut-off for the formation of the low-mass IMBHs examined in this study. The gray-shaded area represents the S/N for the entire population of BBH mergers in our simulations. Within this area, we highlight two specific examples: one for 25–25 M⊙ and another for 75–75 M⊙, effectively visualizing the impact of mass variations on S/N. The horizontal dashed lines represent the two detection thresholds, S/N = 8 and S/N = 12, which are associated with the current generation of detectors and the future ET, respectively.
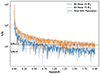 |
Fig. 10. S/N vs. Redshift: We observe an inverse proportionality between the S/N and redshift; as the redshift increases, the S/N does decrease, confirming the suppression due to redshift. The gray shaded area covers the S/Ns for all BBH systems. where two specific examples are demonstrated: one for 25–25 M⊙ BBH mergers and another for 75–75 M⊙ mergers. The horizontal dashed lines correspond to two detection threshold S/N = 8 and S/N = 12. |
Figure 7 serves as a window onto the detectability landscape for IMBH mergers, revealing how the S/N varies with distance, and offers valuable insights into the observational reach of the ET for GW190521-like events. In Fig. 7, it is evident that IMBHs, particularly in the mass range of 100–200 M⊙, emerge as the optimal targets for ET at 1000 Mpc, and are the “golden events” mentioned in Sect. 2.5. In addition, at distances of approximately 5300 Mpc, the lower limit of our S/N threshold (i.e., S/N ≥ 12) aligns with the detection capability of ET as in Branchesi et al. (2023), and in simulations where BBH mergers can be detected with an S/N of 8 or higher (Alhassan et al. 2023).
Furthermore, our analysis explores the relationship between the distance to the source, the final BH mass, and their impact on detectability by ET. Figure 8 presents the localization of final BHs, indicating a lower potential detectability of golden events within the 100–200 M⊙ mass range at approximately 100–200 Mpc, contrasting with a higher detectability at greater distances (around 5300 Mpc) at S/N ≥ 12.
The correlation between event rates and the mass of the merging BHs is shown in Fig. 9. We estimate that events falling within the 100–200 M⊙ mass interval could be observed by ET at a rate of ∼100 events Gpc−3 yr−1. Nonetheless, as shown in Fig. 9, taking into account the sensitivity curve of Advanced LIGO reveals that the rate of events similar to GW190521 falls below 2 events Gpc−3 yr−1, in line with expectations.
The expected number of detections versus redshift for BH masses in the range of 10–200 M⊙ is illustrated in Fig. 11. We observe a steep decline in detections before z = 2, reconfirming the suppression of detection with increasing redshift. To account for mass differences, we used a color bar representing masses binned by the number of detections across different redshifts.
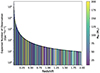 |
Fig. 11. The expected number of detections versus redshift, binned for different MBH. |
While the total number of coalescing BBHs that we find is comparable with that of Branchesi et al. (2023), of namely ∼1.2 × 10⁵ in one year, our event rate estimation surpasses that of other studies. For example, Abbott et al. (2020a, b) estimate the merger rate of GW190521 to be ∼0.13 Gpc−3 yr−1. Fragione et al. (2022) calculated the merger rate of IMBH binaries in NSCs and found rates of around 1.5 Gpc−3 yr−1 for IMBHs in the mass range of 100–200 M⊙. Additionally, González Prieto et al. (2022) projected a peak IMBH merger rate of R ∼ 2 Gpc−3 yr−1 at a redshift of z ≈ 2, considering masses of between 120 and 500 M⊙ in young, massive star clusters. Moreover, in the case of zero-metal (Population III or Pop III) stars, the event rate of BBH mergers from binary Pop III star evolution is estimated at 0.1–0.8 Gpc−3 yr−1 (Kinugawa et al. 2021; Wang et al. 2022). On the other hand, based on the hierarchical growth model, Shinkai et al. (2017) found a peak of seven events per year at ∼60 M⊙. Nevertheless, our calculations estimate a BBH merger event rate of 2 × 10⁵ Gpc−3 yr−1 for masses of 10–200 M⊙ and 100 events Gpc−3 yr−1 within the 100–200 M⊙ mass range. Similar to Shinkai et al. (2017), we do not specify the exact location of these mergers; instead, we count our BH mergers across the entire Universe up to a redshift of z = 2.
In addition, we compared our low-mass BBH (≤100 M⊙) merger rate estimation to that of other studies that take into account different locations for BBH hierarchical mergers. Considering NSCs, accretion disks surrounding AGNs, and GCs as possible locations for BBH hierarchical mergers, the present predictions for BBH merger rates are 4–60 Gpc−3 yr−1 (at z = 0) for GCs (Rodriguez & Loeb 2018; Fragione & Kocsis 2018), approximately 0.01–1 Gpc−3 yr−1 for NSCs (Miller & Lauburg 2009; Antonini & Rasio 2016; Chattopadhyay et al. 2023), and a range of 0.002–60 Gpc−3 yr−1 for AGN disks (Gröbner et al. 2020; Tagawa et al. 2020).
4. Summary
In this paper, we investigate events similar to that producing the GW signal GW190521, employing the capabilities of the next-generation ground-based detector, ET. The improved sensitivity of ET in the low-frequency range (2–10 Hz) allows the detection of GWs from binary systems containing IMBHs, as their signal will be within the lower frequency range of the detectors. This study includes a meticulous exploration of hierarchical merger models in galaxies, focusing on the formation of low-mass IMBHs in the pair-instability gap. We use a model that incorporates the halo formation model and estimates the hierarchical accumulation of BHs from the giant molecular cloud, presuming a hierarchical growth pattern of merged cores. We ran simulations of non-spinning BBH mergers for various masses, considering the potential sources of noise affecting the detector. Simulated S/Ns are considered for sources at various distances, including the detected distance of GW190521.
We calculated the merger rate of IMBHs by combining the number of mergers with the volume of space within which they are simulated. The present study focuses on IMBHs with masses ranging from 100 to 200 M⊙, which corresponds to the recognized mass range of the IMBHs responsible for GW190521. To ensure our method aligns with recent IMBH detection rates, we set a detection threshold of S/N ≥ 100, consistent with the “golden events” identified in the recent ET collaboration study.
Our key findings can be summarized as follows:
-
In the S/N range of 12 to about 1000, low-mass IMBHs, those within the mass range of 100–200 M⊙, emerge as ideal targets for ET at a distance of 1000 Mpc, with even the golden events remaining detectable.
-
At distances of about 5300 Mpc, the minimum detectability threshold, set at S/N ≥ 12, aligns with the detection capability of ET.
-
Our analysis specifically examines the detectability of sources by ET, considering both the source distance and the mass of the final BH. We find that while low-mass IMBH events have limited detectability as golden events (S/N ≥ 100) at distances around 100–200 Mpc, they become detectable at greater distances (up to approximately 5300 Mpc) when the S/N threshold is lowered to ≥12.
-
Our estimated event rate for BBH mergers is approximately 2 × 10⁵ Gpc−3 yr−1 for BH masses between 10 and 200 M⊙, with about 100 Gpc−3 yr−1 of this rate specifically corresponding to low-mass IMBHs similar to GW190521 event.
-
While considering equal-mass and non-spinning binaries may not fully capture the diversity of real-world IMBH mergers, they do represent a significant portion of expected events, especially in certain formation scenarios.
In conclusion, our study highlights that low-mass IMBHs, particularly in the 100–200 M⊙ mass range, are promising targets for detection by ET. While the study simplifies certain aspects of binary mergers, the expected event rates suggest that ET could detect several dozen events similar to GW190521, providing valuable insights into the nature of IMBHs.
LIGO, Virgo and KAGRA detectors.
We suppose the final IMBH mass is 10−1MSMBH while SMBHs typically have a mass that is a small fraction of the total mass of the galaxy, MSMBH = 2 × 10⁻⁴Mgalaxy (see, e.g., King 2003).
The IMRPhenomD model generates GW signals for merging black hole binaries with non-precessing spins. The waveforms are produced in the frequency domain and include the inspiral, merger, and ringdown parts for the dominant spherical harmonic mode of the signal (Pürrer et al. 2023).
These events are characterized by particularly favorable properties, such as S/N ≥ 100, making them especially significant in the context of BBH detection.
Acknowledgments
We would like to thank the anonymous referee for their thorough review and constructive feedback on our manuscript. Authors gratefully acknowledge the support of the Italian Ministry of Education, University and Research within the PRIN 2017 Research Program Frame work, no. 2017SYRTC. Authors also thanks the University of Sassari that funded this study thanks to the Accordo di Programma tra la Regione Autonoma della Sardegna, l’Università degli Studi di Sassari, l’Istituto Nazionale di Fisica Nucleare, l’Istituto Nazionale di Geofisica e Vulcanologia, l’Università degli studi di Cagliari e l’IGEA S.p.a. finalizzato alla realizzazione nella Regione Autonoma della Sardegna di una infrastruttura a basso rumore sismico e antropico dedicata alla ricerca di base nell’ambito della rivelazione di onde gravitazionali, fisica della gravitazione, geofisica e sue applicazione (progetto SAR-GRAV). Intervento finanziato con risorse FSC 20142020 Patto per lo sviluppo della Regione Sardegna. The authors’ grateful acknowledgment also goes to the contribution of the Fondi di Ateneo per la ricerca 2019 and Fondi di Ateneo per la ricerca 2020 of the University of Sassari.
References
- Abbott, B. P., Abbott, R., Abbott, T. D., et al. 2016, Phys. Rev. Lett., 116, 061102 [Google Scholar]
- Abbott, R., Abbott, T. D., Abraham, S., et al. 2020a, Phys. Rev. Lett., 125, 101102 [Google Scholar]
- Abbott, R., Abbott, T. D., Abraham, S., et al. 2020b, ApJ, 900, L13 [NASA ADS] [CrossRef] [Google Scholar]
- Acernese, F., Antonucci, F., Aoudia, S., et al. 2010, Astropart. Phys., 33, 182 [NASA ADS] [CrossRef] [Google Scholar]
- Alhassan, W., Bulik, T., & Suchenek, M. 2023, MNRAS, 519, 3843 [CrossRef] [Google Scholar]
- Allocca, A., Berbellini, A., Boschi, L., et al. 2021, Eur. Phys. J. Plus, 136, 511 [NASA ADS] [CrossRef] [Google Scholar]
- Antonini, F., & Rasio, F. A. 2016, ApJ, 831, 187 [Google Scholar]
- Bailyn, C. D., Jain, R. K., Coppi, P., & Orosz, J. A. 1998, ApJ, 499, 367 [NASA ADS] [CrossRef] [Google Scholar]
- Banerjee, S. 2022, A&A, 665, A20 [NASA ADS] [CrossRef] [EDP Sciences] [Google Scholar]
- Bardeen, J. M., Bond, J. R., & Efstathiou, G. 1987, ApJ, 321, 28 [NASA ADS] [CrossRef] [Google Scholar]
- Branchesi, M., Maggiore, M., David, A., et al. 2023, JCAP, 2023, 068 [CrossRef] [Google Scholar]
- Camenzind, M. 2007, Compact Objects in Astrophysics: White Dwarfs, Neutron Stars, and Black Holes (Berlin: Springer-Verlag) [Google Scholar]
- Chattopadhyay, D., Stegmann, J., Antonini, F., Barber, J., & Romero-Shaw, I. M. 2023, MNRAS, 526, 4908 [NASA ADS] [CrossRef] [Google Scholar]
- Chatziioannou, K., Cotesta, R., Ghonge, S., et al. 2019, Phys. Rev. D, 100, 104015 [NASA ADS] [CrossRef] [Google Scholar]
- Di Carlo, U. N., Mapelli, M., Pasquato, M., et al. 2021, MNRAS, 507, 5132 [NASA ADS] [CrossRef] [Google Scholar]
- Di Pace, S., Mangano, V., Pierini, L., et al. 2022, Galaxies, 10, 65 [NASA ADS] [CrossRef] [Google Scholar]
- Ebisuzaki, T., Makino, J., Tsuru, T. G., et al. 2001, ApJ, 562, L19 [NASA ADS] [CrossRef] [Google Scholar]
- Farmer, R., Renzo, M., de Mink, S. E., Marchant, P., & Justham, S. 2019, ApJ, 887, 53 [Google Scholar]
- Fragione, G., & Kocsis, B. 2018, Phys. Rev. Lett., 121, 161103 [Google Scholar]
- Fragione, G., Loeb, A., Kocsis, B., & Rasio, F. A. 2022, ApJ, 933, 170 [NASA ADS] [CrossRef] [Google Scholar]
- Fryer, C. L. 2013, CQG, 30, 244002 [NASA ADS] [CrossRef] [Google Scholar]
- Fujii, M. S., & Portegies Zwart, S. 2015, MNRAS, 449, 726 [NASA ADS] [CrossRef] [Google Scholar]
- Gabbard, H., Williams, M., Hayes, F., & Messenger, C. 2018, Phys. Rev. Lett., 120, 141103 [NASA ADS] [CrossRef] [Google Scholar]
- González Prieto, E., Kremer, K., Fragione, G., et al. 2022, ApJ, 940, 131 [CrossRef] [Google Scholar]
- Gröbner, M., Ishibashi, W., Tiwari, S., Haney, M., & Jetzer, P. 2020, A&A, 638, A119 [NASA ADS] [CrossRef] [EDP Sciences] [Google Scholar]
- Hild, S., Abernathy, M., Acernese, F., et al. 2011, CQG, 28, 094013 [NASA ADS] [CrossRef] [Google Scholar]
- Husa, S., Khan, S., Hannam, M., et al. 2016, Phys. Rev. D, 93, 044006 [NASA ADS] [CrossRef] [Google Scholar]
- Inutsuka, S.-I., Inoue, T., Iwasaki, K., & Hosokawa, T. 2015, A&A, 580, A49 [NASA ADS] [CrossRef] [EDP Sciences] [Google Scholar]
- Jenkins, A., Frenk, C. S., White, S. D. M., et al. 2001, MNRAS, 321, 372 [Google Scholar]
- Khan, S., Husa, S., Hannam, M., et al. 2016, Phys. Rev. D, 93, 044007 [Google Scholar]
- King, A. 2003, ApJ, 596, L27 [Google Scholar]
- Kinugawa, T., Nakamura, T., & Nakano, H. 2021, MNRAS, 501, L49 [Google Scholar]
- Kormendy, J., & Richstone, D. 1995, ARA&A, 33, 581 [Google Scholar]
- Lewin, W. H. G., van Paradijs, J., & van den Heuvel, E. P. J. 1997, X-ray Binaries (Cambridge, UK: Cambridge University Press) [Google Scholar]
- LIGO Scientific Collaboration 2020, LALSuite: LIGO Scientific Collaboration Algorithm Library Suite, Astrophysics Source Code Library [record ascl:2012.021] [Google Scholar]
- Maggiore, M., Van Den Broeck, C., Bartolo, N., et al. 2020, JCAP, 2020, 050 [CrossRef] [Google Scholar]
- Mandic, V., Bird, S., & Cholis, I. 2016, Phys. Rev. Lett., 117, 201102 [NASA ADS] [CrossRef] [Google Scholar]
- Mapelli, M., Spera, M., Montanari, E., et al. 2020, ApJ, 888, 76 [NASA ADS] [CrossRef] [Google Scholar]
- Mapelli, M., Dall’Amico, M., Bouffanais, Y., et al. 2021, MNRAS, 505, 339 [CrossRef] [Google Scholar]
- Matsubayashi, T., Shinkai, H.-A., & Ebisuzaki, T. 2004, ApJ, 614, 864 [NASA ADS] [CrossRef] [Google Scholar]
- Meiksin, A., White, M., & Peacock, J. A. 1999, MNRAS, 304, 851 [NASA ADS] [CrossRef] [Google Scholar]
- Miao, H., Gong, Y., Chen, X., et al. 2023, MNRAS, 519, 1132 [Google Scholar]
- Miller, M. C., & Lauburg, V. M. 2009, ApJ, 692, 917 [Google Scholar]
- Ohkubo, T., Nomoto, K., Umeda, H., Yoshida, N., & Tsuruta, S. 2009, ApJ, 706, 1184 [NASA ADS] [CrossRef] [Google Scholar]
- Owen, B. J., & Sathyaprakash, B. S. 1999, Phys. Rev. D, 60, 022002 [CrossRef] [Google Scholar]
- Perets, H. B. 2022, ApJ, 927, L23 [NASA ADS] [CrossRef] [Google Scholar]
- Press, W. H., & Schechter, P. 1974, ApJ, 187, 425 [Google Scholar]
- Pürrer, M., Khan, S., Ohme, F., Birnholtz, O., & London, L. 2023, IMRPhenomD: Phenomenological waveform model, Astrophysics Source Code Library [record ascl:2307.019] [Google Scholar]
- Rice, J. R., & Zhang, B. 2021, ApJ, 908, 59 [NASA ADS] [CrossRef] [Google Scholar]
- Rodriguez, C. L., & Loeb, A. 2018, ApJ, 866, L5 [NASA ADS] [CrossRef] [Google Scholar]
- Rose, S. C., Naoz, S., Sari, R., & Linial, I. 2022, ApJ, 929, L22 [NASA ADS] [CrossRef] [Google Scholar]
- Shemmer, O., Netzer, H., Maiolino, R., et al. 2004, ApJ, 614, 547 [NASA ADS] [CrossRef] [Google Scholar]
- Sheth, R. K., & Tormen, G. 1999, MNRAS, 308, 119 [Google Scholar]
- Shinkai, H.-A., Kanda, N., & Ebisuzaki, T. 2017, ApJ, 835, 276 [NASA ADS] [CrossRef] [Google Scholar]
- Susa, H., Hasegawa, K., & Tominaga, N. 2014, ApJ, 792, 32 [NASA ADS] [CrossRef] [Google Scholar]
- Tagawa, H., Haiman, Z., & Kocsis, B. 2020, ApJ, 898, 25 [NASA ADS] [CrossRef] [Google Scholar]
- Vale, A., & Ostriker, J. P. 2006, MNRAS, 371, 1173 [NASA ADS] [CrossRef] [Google Scholar]
- Volonteri, M. 2012, Science, 337, 544 [NASA ADS] [CrossRef] [Google Scholar]
- Wang, L., Tanikawa, A., & Fujii, M. 2022, MNRAS, 515, 5106 [NASA ADS] [CrossRef] [Google Scholar]
- Woosley, S. E., & Heger, A. 2021, ApJ, 912, L31 [NASA ADS] [CrossRef] [Google Scholar]
All Tables
All Figures
|
Fig. 1. Evolution of the halo number density, n(M), as a function of halo mass for redshifts in the range 0 ≤ z ≤ 2. |
| In the text | |
|
Fig. 2. Evolution of |
| In the text | |
|
Fig. 3. Cumulative BH mass function. The colors represent different masses of initial molecular clouds, Mg, 2 × 10⁶, 106, 4 × 10⁵, 105, and 4 × 10⁴ M⊙, respectively. |
| In the text | |
|
Fig. 4. Cumulative distribution function showing the number of BH mergers in relation to the redshift and mass of BHs, binned for different MBH. |
| In the text | |
|
Fig. 5. Sensitivity curves used in the present paper. The design sensitivity of the ET is marked in blue. The Advanced LIGO and Virgo curves are colored orange and green, respectively. |
| In the text | |
|
Fig. 6. Cumulative number of BBH mergers versus final BH masses associated with our detection thresholds at S/N ≥ 12 and S/N ≥ 100. |
| In the text | |
|
Fig. 7. S/N plotted against final BH masses at 1000 Mpc and 5300 Mpc for ET. The horizontal dashed lines correspond to our detection threshold S/N = 12 and S/N = 100. |
| In the text | |
|
Fig. 8. ET source distance as a function of the final BH masses corresponding to our detection thresholds of S/N ≥ 12 and S/N ≥ 100. |
| In the text | |
|
Fig. 9. The merger rate of BBH events as a function of mass, considering S/N ≥ 12. The hatched curve, distinguished by an orange edge color, demonstrates the corresponding Advanced LIGO event rate. |
| In the text | |
|
Fig. 10. S/N vs. Redshift: We observe an inverse proportionality between the S/N and redshift; as the redshift increases, the S/N does decrease, confirming the suppression due to redshift. The gray shaded area covers the S/Ns for all BBH systems. where two specific examples are demonstrated: one for 25–25 M⊙ BBH mergers and another for 75–75 M⊙ mergers. The horizontal dashed lines correspond to two detection threshold S/N = 8 and S/N = 12. |
| In the text | |
|
Fig. 11. The expected number of detections versus redshift, binned for different MBH. |
| In the text | |
Current usage metrics show cumulative count of Article Views (full-text article views including HTML views, PDF and ePub downloads, according to the available data) and Abstracts Views on Vision4Press platform.
Data correspond to usage on the plateform after 2015. The current usage metrics is available 48-96 hours after online publication and is updated daily on week days.
Initial download of the metrics may take a while.