Open Access
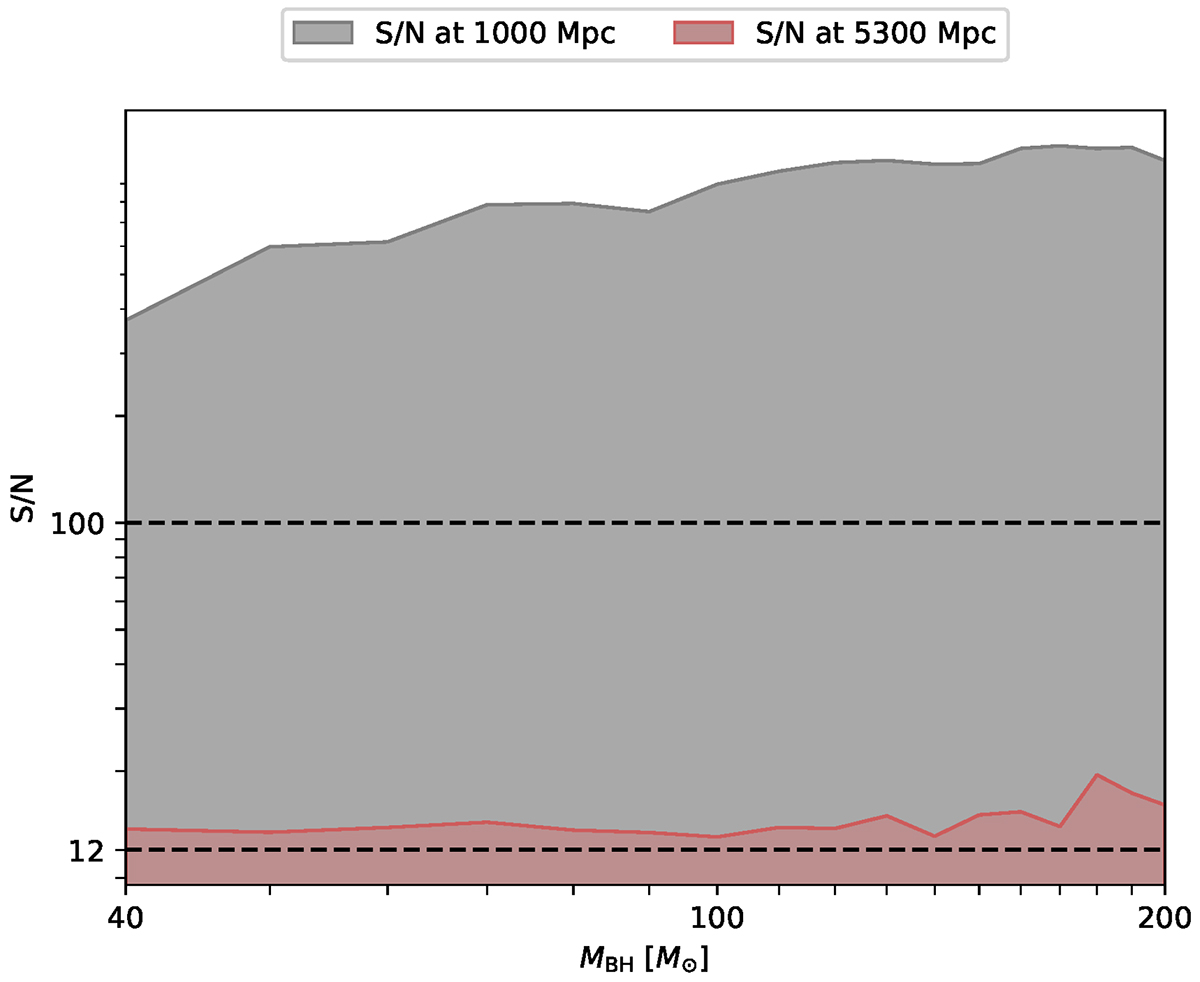
Fig. 7.
Download original image
S/N plotted against final BH masses at 1000 Mpc and 5300 Mpc for ET. The horizontal dashed lines correspond to our detection threshold S/N = 12 and S/N = 100.
Current usage metrics show cumulative count of Article Views (full-text article views including HTML views, PDF and ePub downloads, according to the available data) and Abstracts Views on Vision4Press platform.
Data correspond to usage on the plateform after 2015. The current usage metrics is available 48-96 hours after online publication and is updated daily on week days.
Initial download of the metrics may take a while.