Fig. 7.
Download original image
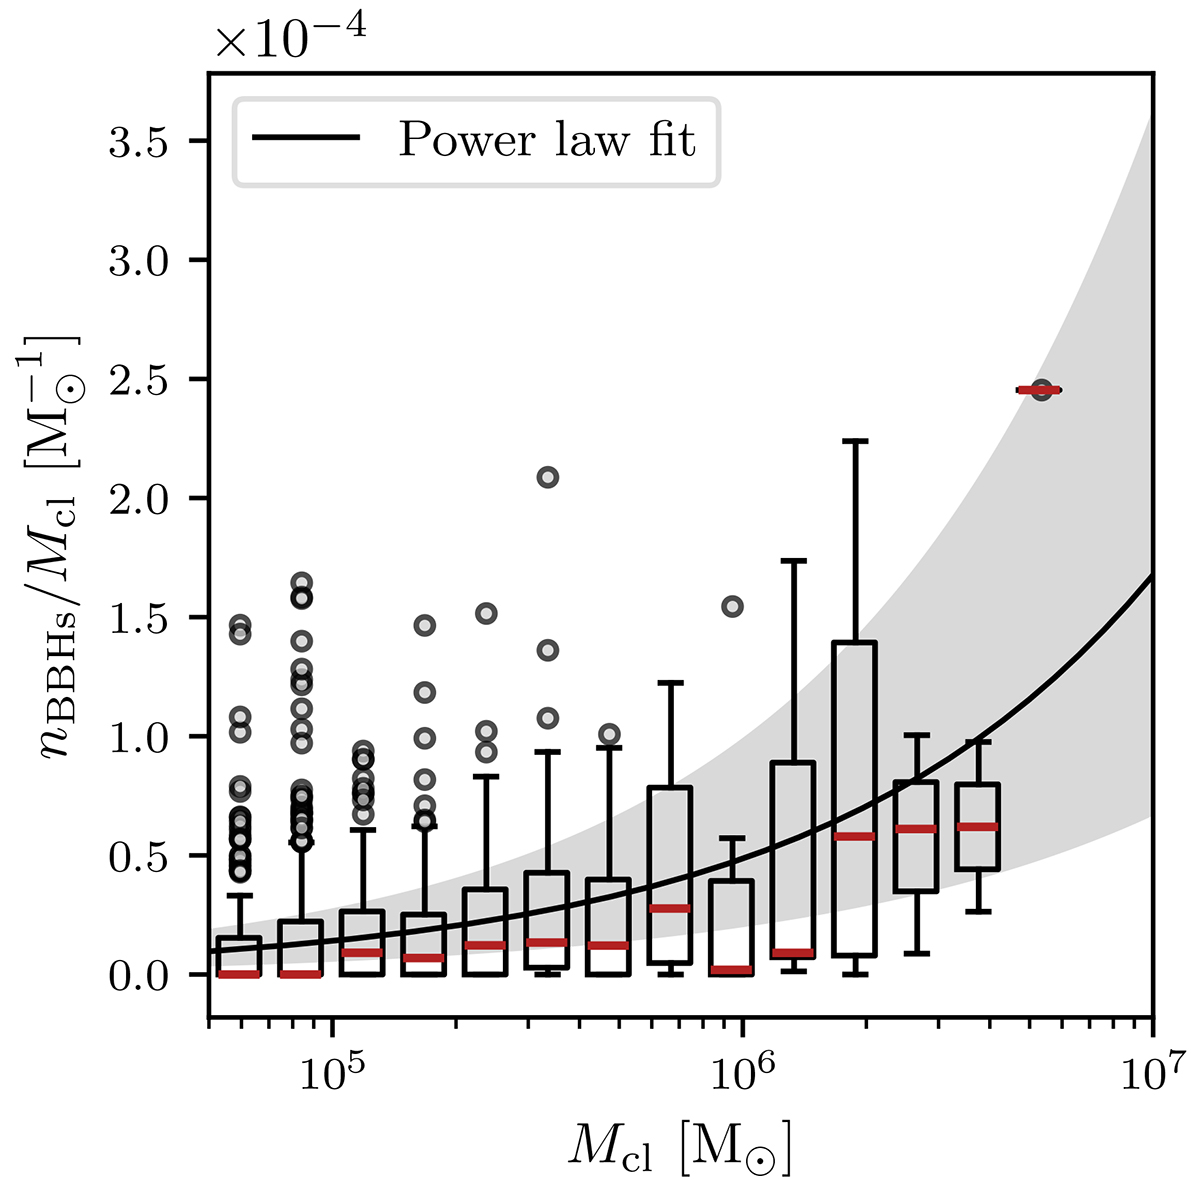
Formation efficiency of merging BBHs per unit cluster initial stellar mass in all our clusters integrated with CMC. Boxes indicate the first to third quartiles, with red horizontal lines at the medians. Silver dots show outliers outside the first and third quartiles. The solid black line shows the best-fit power law and the shaded grey area represents the 1σ deviation on the power law coefficients.
Current usage metrics show cumulative count of Article Views (full-text article views including HTML views, PDF and ePub downloads, according to the available data) and Abstracts Views on Vision4Press platform.
Data correspond to usage on the plateform after 2015. The current usage metrics is available 48-96 hours after online publication and is updated daily on week days.
Initial download of the metrics may take a while.