Fig. 4.
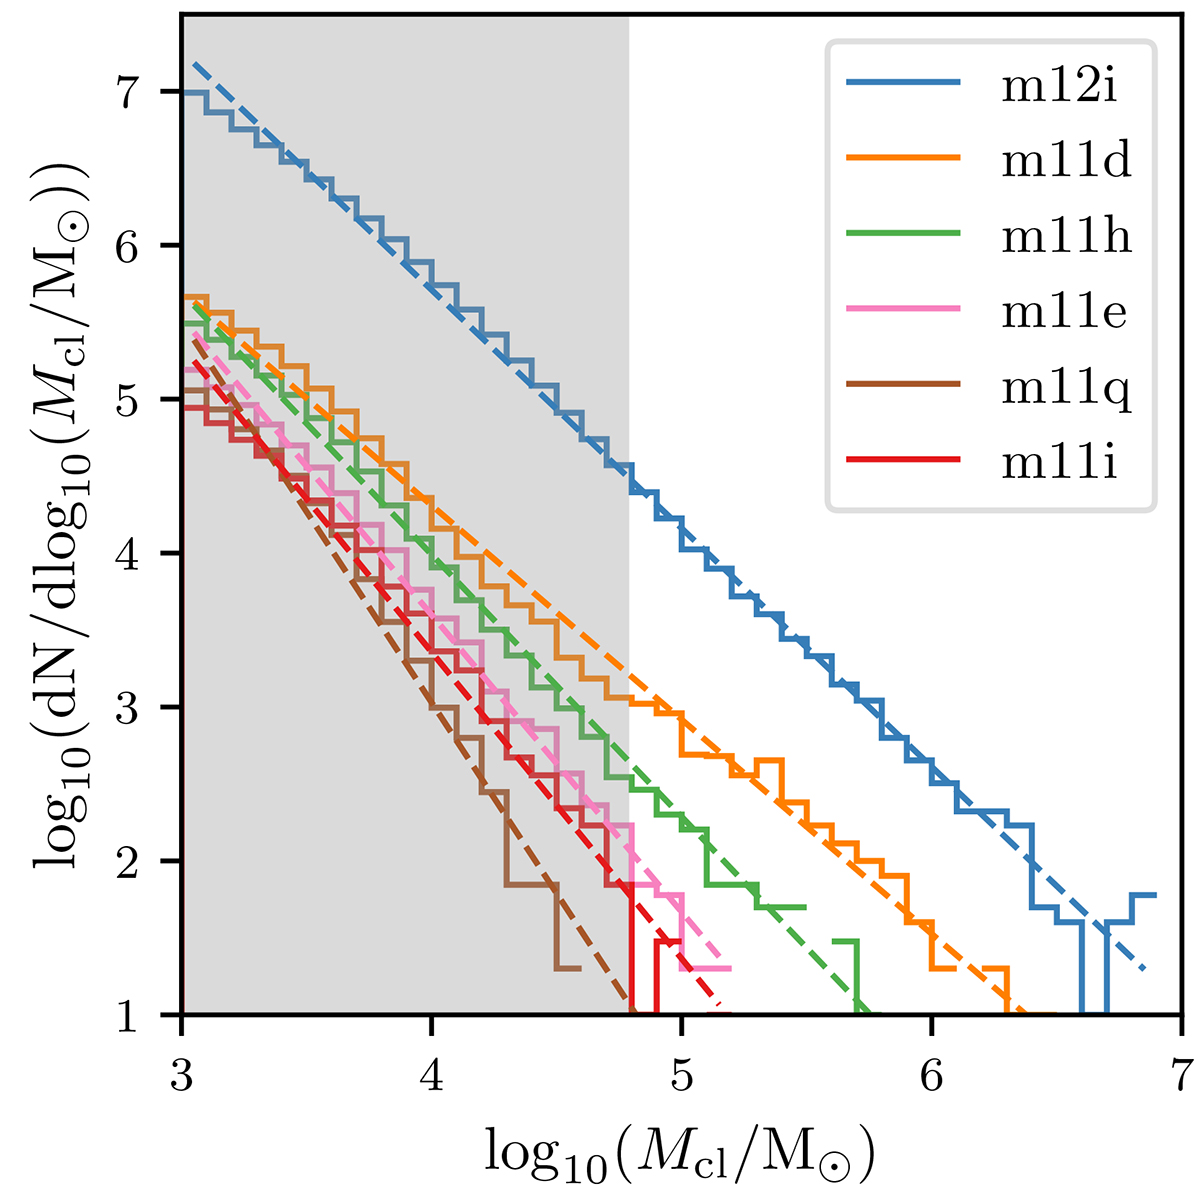
Download original image
Initial mass distributions of all clusters sampled in our six zoom-in simulations of galaxies. We consider here all the clusters formed without taking their different formation redshifts into account. The different simulations are indicated with the same colours as in Fig. 2. Dashed lines correspond to the best power-law fits. The grey shaded region indicates the mass range Mcl < 6 × 10⁴ M⊙, which we do not model with CMC. This limit roughly corresponds to an initial number of particles of 105.
Current usage metrics show cumulative count of Article Views (full-text article views including HTML views, PDF and ePub downloads, according to the available data) and Abstracts Views on Vision4Press platform.
Data correspond to usage on the plateform after 2015. The current usage metrics is available 48-96 hours after online publication and is updated daily on week days.
Initial download of the metrics may take a while.