Fig. 5.
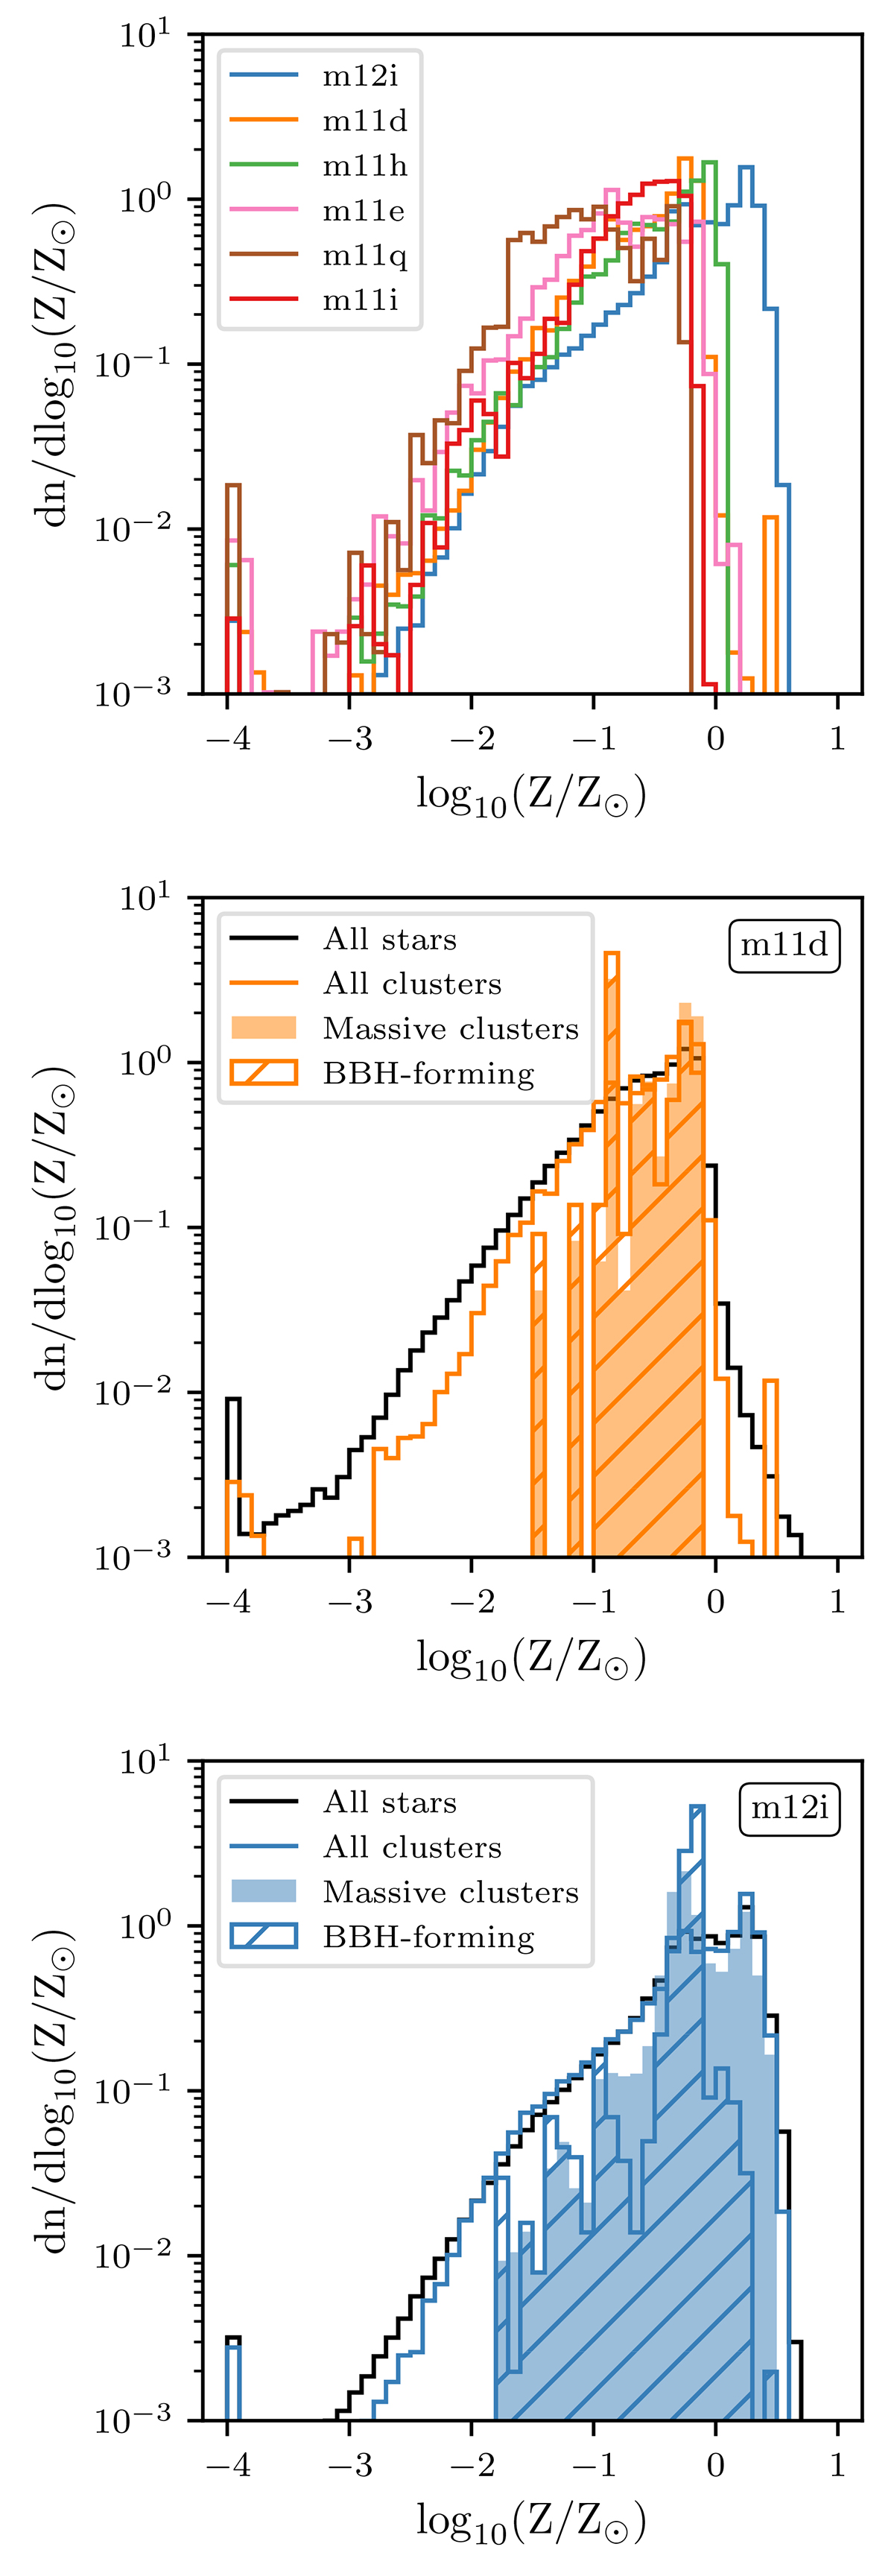
Download original image
Metallicity distributions of all clusters sampled in our six zoom-in simulations of galaxies (top). The different simulations are indicated with the same colours as in Fig. 2. The minimal value of metallicity admitted in the FIRE-2 simulations is ∼10−4 Z⊙, which causes a stacking at low-metallicity visible on the plot. Metallicity distributions in the simulations m11d (centre) and m12i (bottom) of all stars (black line), all clusters (coloured line), massive clusters (filled area), and clusters in which merging BBHs form (hatched area). All histograms are normalised to one.
Current usage metrics show cumulative count of Article Views (full-text article views including HTML views, PDF and ePub downloads, according to the available data) and Abstracts Views on Vision4Press platform.
Data correspond to usage on the plateform after 2015. The current usage metrics is available 48-96 hours after online publication and is updated daily on week days.
Initial download of the metrics may take a while.