Open Access
Fig. 9.
Download original image
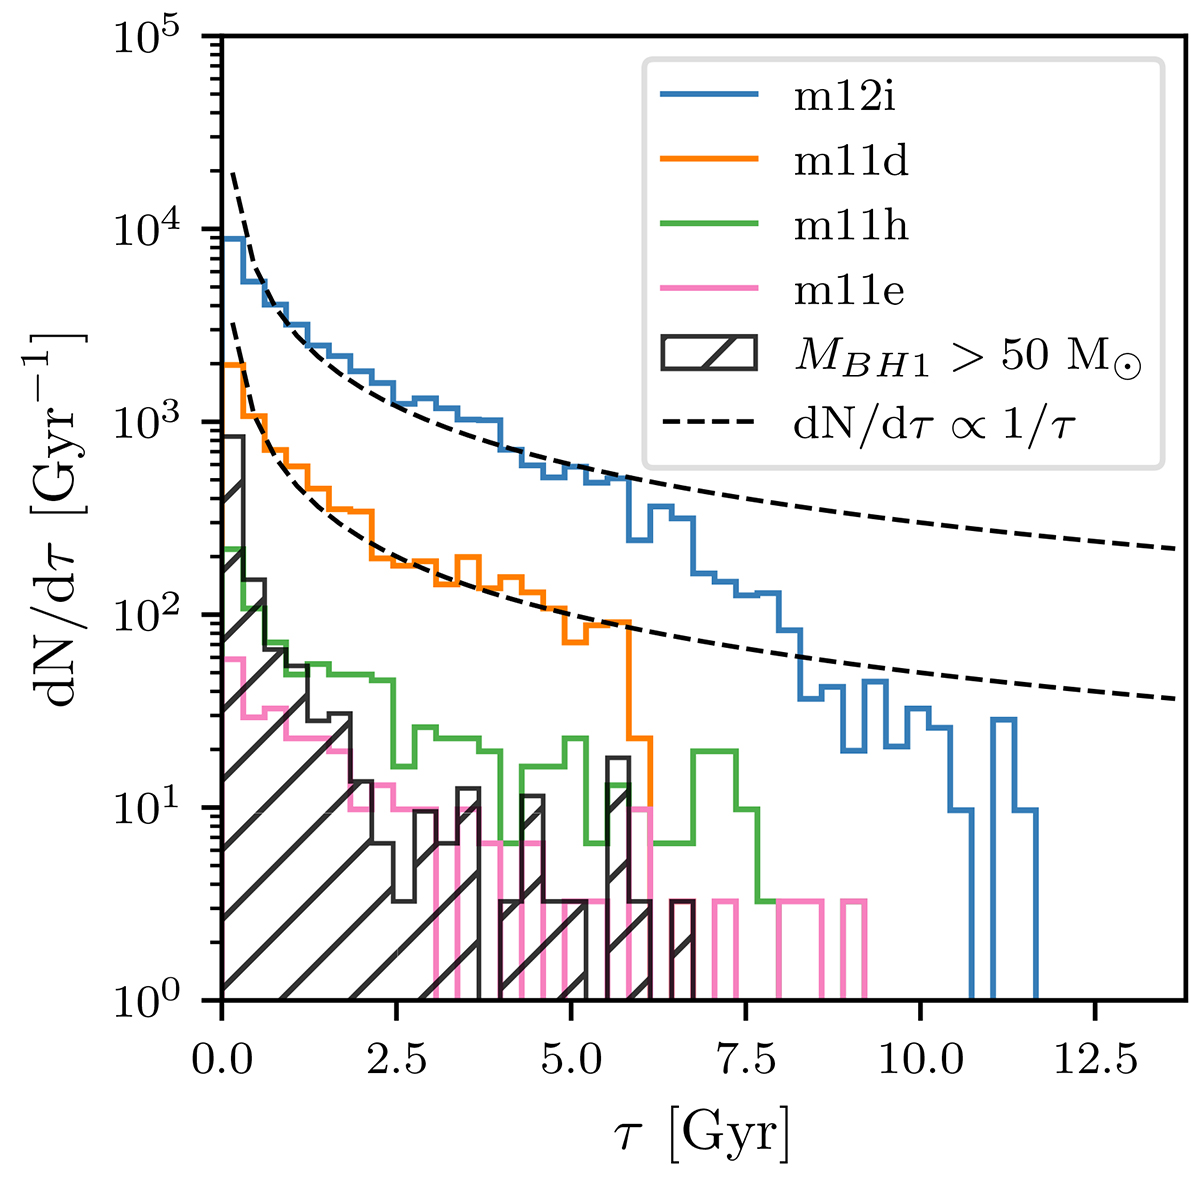
Distributions of delay times for all BBHs in the simulated galaxies m11e, m11h, m11d, and m12i. The hatched areas show the distribution of delay times for the massive BBHs (MBH1 > 50 M⊙) in all four galaxies combined. The dashed black lines show 1/τ distributions matching the delay times in m11d and m12i.
Current usage metrics show cumulative count of Article Views (full-text article views including HTML views, PDF and ePub downloads, according to the available data) and Abstracts Views on Vision4Press platform.
Data correspond to usage on the plateform after 2015. The current usage metrics is available 48-96 hours after online publication and is updated daily on week days.
Initial download of the metrics may take a while.