| Issue |
A&A
Volume 686, June 2024
|
|
|---|---|---|
| Article Number | A135 | |
| Number of page(s) | 10 | |
| Section | Planets and planetary systems | |
| DOI | https://doi.org/10.1051/0004-6361/202348707 | |
| Published online | 07 June 2024 | |
Survival of the long-lived inner disk of PDS70
1
Mullard Space Science Laboratory, University College London,
Holmbury St Mary,
Dorking, Surrey
RH5 6NT, UK
e-mail: p.pinilla@ucl.ac.uk
2
Max-Planck-Institut für Astronomie,
Königstuhl 17,
69117
Heidelberg, Germany
3
Université Côte d’Azur, Observatoire de la Côte d’Azur, CNRS, Laboratoire Lagrange,
Bd de l’Observatoire,
CS 34229
06304
Nice Cedex 4, France
4
Université Grenoble Alpes, CNRS, Institut de Planétologie et d’Astrophysique (IPAG),
38000
Grenoble, France
5
Department of Astrophysics/IMAPP, Radboud University,
PO Box 9010,
6500 GL
Nijmegen, The Netherlands
6
SRON,
Niels Bohrweg 2,
Leiden, The Netherlands
7
Department of Astronomy, University of Florida,
Gainesville, FL
32611, USA
8
Dipartimento di Fisica, Università degli Studi di Milano,
Via Celoria 16,
20133
Milano, Italy
Received:
22
November
2023
Accepted:
6
March
2024
The K7 T Tauri star PDS 70 remains the best laboratory for investigating the influence of giant planet formation on the structure of the parental disk. One of the most intriguing discoveries is the detection of a resolved inner disk from ALMA observations that extends up to the orbit of PDS 70b. It is challenging to explain this inner disk because most of the dust particles are expected to be trapped at the outer edge of the gap opened by PDS 70b and PDS 70c. By performing dust evolution models in combination with radiative transfer simulations that match the gas disk masses obtained from recent thermo-chemical models of PDS 70, we find that when the minimum grain size in the models is larger than 0.1 µm, there is an efficient filtration of dust particles, and the inner disk is depleted during the first million year of dust evolution. To maintain an inner disk, the minimum grain size in the models therefore needs to be smaller than 0.1 µm. Only when grains are that small are they diffused and dragged along with the gas throughout the gap opened by the planets. The small grains transported in the inner disk grow and drift into it, but the constant reservoir of dust particles that are trapped at the outer edge of the gap and that continuously fragment allows the inner disk to refill on million-year timescales. Our flux predictions at millimeter wavelength of these models agree with ALMA observations. These models predict a spectral index of 3.2 in the outer and 3.6 in the inner disk. Our simple analytical calculations show that the water emission in the inner disk that was recently observed with the James Webb Space Telescope may originate from these ice-coated small grains that flow through the gap, grow, and drift toward the innermost disk regions to reach the water snowline. These models may mirror the history and evolution of our Solar System, in which Jupiter and Saturn played a crucial role in shaping the architecture and properties of the planets.
Key words: planets and satellites: formation / protoplanetary disks
© The Authors 2024
 Open Access article, published by EDP Sciences, under the terms of the Creative Commons Attribution License (https://creativecommons.org/licenses/by/4.0), which permits unrestricted use, distribution, and reproduction in any medium, provided the original work is properly cited.
This article is published in open access under the Subscribe to Open model. Subscribe to A&A to support open access publication.
1 Introduction
Although planets form in protoplanetary disks, it remains hard to discover them while they are still surrounded by their parental disk remains. Protoplanet candidates are still highly debated (Asensio-Torres et al. 2021; Benisty et al. 2023; Ren et al. 2023). The K7 T Tauri star PDS 70 remains the best laboratory for studying the influence of giant planet formation on the disk structure.
PDS 70 is 5.4 Myr old and is located in the Upper Centaurus Lupus association at a distance of 113.47pc (Müller et al. 2018; Gaia Collaboration 2021). It hosts a disk with a large cavity that is visible at different wavelengths, including scattered light (Dong et al. 2012) and (sub-)millimeter observations (Hashimoto et al. 2015; Keppler et al. 2019). Inside the cavity, two planets at separations of ~22 au (PDS 70b) and ~34 au (PDS 70c) have been discovered (Keppler et al. 2018; Müller et al. 2018) that are still accreting material from the disk (with values of ~10−8–10−7 MJup yr−1 for PDS 70b and ~10−8 MJup yr−1 for PDS 70c, Aoyama & Ikoma 2019; Haffert et al. 2019; Thanathibodee et al. 2019; Hashimoto et al. 2020; Zhou et al. 2021). The masses of these planets are difficult to constrain observationally.
Wang et al. (2021) provided dynamical constrains of the planet masses by enforcing dynamical stability of the planet orbits. They obtained values of  for PDS 70b and
  for PDS 70c. Most likely, the masses of PDS 70b and PDS 70c range between 1 and 10 MJup, which is also supported by hydrodynamical models and radiative transfer simulations of this system (Bae et al. 2019; Toci et al. 2020).
The planetary accretion of PDS 70b and PDS 70c suggests that gas flows through the gap. This has been supported by recent observations from The Atacama Large Millimeter/submillimeter Array (ALMA) of different molecules (Keppler et al. 2019; Facchini et al. 2021), where 12CO and HCO+ were observed within the orbit of PDS 70b. Portilla-Revelo et al. (2023) analyzed these ALMA observations and suggested that the depletion factor of the gas density inside the gap is such that both planets are as massive as 4 MJup. Circumplanetary disks (CPDs) around both planets have been directly or indirectly observed. For PDS 70b, the spectrum in the K band from the Very Large Tele-scope/SINFONI supports a scenario of dust around PDS 70b, which was interpreted as a CPD (Christiaens et al. 2019). The CPD of PDS 70c was directly detected with ALMA (Isella et al. 2019; Benisty et al. 2021). Interestingly, tentative co-orbital submillimeter emission within the Lagrangian region L5 of the protoplanet PDS 70b has recently been suggested by reanalyzing the ALMA data (Balsalobre-Ruza et al. 2023).
One of the most intriguing discoveries from the ALMA observations is the detection of a resolved inner disk (Long et al. 2018; Keppler et al. 2019; Benisty et al. 2021). This is consistent with the detection of near-infrared excess in the spectral energy distribution (SED, Dong et al. 2012), which could be explained by a population of small (micron-sized) dust particles close to the star. It is currently unclear how this inner disk can exist and be sustained over million-year timescales with the current estimate of mass accretion rate onto the star (Campbell-White et al. 2023). Due to the dust trapping at the outer edge of the common gap created by the two giant planets (PDS 70b and PDS 70c), it is expected that most of the dust is blocked and stops the dust filtration and flow of dust from the outer to the inner disk (e.g., Pinilla et al. 2016; Drążkowska et al. 2019). It is important to determine the physical conditions for which this inner disk can be sustained for understanding whether terrestrial planets can still form within this inner region. In addition, the pebble flux from the outer to the inner disk can also determine the number of essential elements for sustaining life, such as water, that could be available within the snowline in the gas phase and that may be accreted by forming planets.
Observational evidence recently showed that water vapor is likely delivered to the inner disk through icy pebbles that drift inward (e.g., Salyk et al. 2011, 2019). Observations of the luminosity of infrared H2O emission from Spitzer and the James Webb Space Telescope (JWST) spectra and the spatially resolved dust disk radius obtained from ALMA images suggest that the disks that are large and host substructures (which retain the pebbles in the outer disk) with a lower H2O content (Banzatti et al. 2020, Banzatti et al. 2023). This is supported by models that include dust evolution, substructures, water sublimation, and the diffusion of water vapor in the inner disk (e.g., Kalyaan et al. 2021, 2023). This introduces a new idea in the field, according to which the origin of water on the inner terrestrial planets does not only rely on local collisions of water-bearing planetesimals, but may mainly come from drifting icy-particles.
The JWST observations of PDS 70 with the Mid-InfraRed Instrument (MIRI) revealed a wealth of water lines, implying the presence of water in the inner disk (<1 au) and indicating that potential planets forming in the inner disk may have access to a water reservoir despite the two giant planets in the outer disk (Perotti et al. 2023). This challenges current models of dust evolution with giant embedded planets that are massive enough to open deep gaps, such as PDS 70b and PDS 70c, where dust trapping is expected to be very efficient at the edge of their gap.
In this paper, we perform dust evolution and radiative transfer models for the conditions of PDS 70 (Sect. 2) to investigate how its inner disk can survive over million-year timescales. The results of these models and the comparison with current and future ALMA observations are presented in Sect. 3. The results and limitations are discussed in Sect. 4, in addition to the comparison with recent JWST observations. Finally, we present the main conclusions of this work in Sect. 5.
2 Models
2.1 Hydrodynamicsl models
The results from hydrodynamical models of planet-disk interaction performed by Bae et al. (2019) were used as input for the dust evolution models presented in this work. The models from Bae et al. (2019) were tailored to simulate the structure of PDS 70. The authors performed these simulations with the two-dimensional locally isothermal hydrodynamical code FARGO–ADSG (Baruteau et al. 2019), which is an extension of the publicly available FARGO code (Benítez-Llambay & Masset 2016). In the models taken for this work, the mass of PDS 70b was 5MJup and that of PDS 70c was 2.5 MJup. The disk viscosity (α) was assumed to be constant over radius as well as over time, and to be equal to 1 × 10⁻³. The initial disk mass was 3 × 10⁻³ M⊙.
To input the gas density distribution from the 2D (radial and azimuthal) hydrodynamical simulations to the 1D (radial) dust evolution models, the results from the hydro models were azimuthally averaged over 0.1 Myr (between t = 0.9 and 1 Myr) after the disk had reached a quasi-steady state (Fig. 2 in Bae et al. 2019). After this time, the disk mass was 9 × 10⁻⁴ M⊙, which is the disk mass we used as input in the dust evolution models. The planets migrated in the simulations, which means that their radial locations changed over time, although the migration was pretty slow (0.3 and 0.5 au Myr−1 for b and c, respectively).
The averaged gas surface density and radial grid were used for the dust evolution models, and we assumed that the gas density remained steady during the dust evolution described in the next subsection.
2.2 Dust evolution models
For the dust evolution, we used the code Dustpy (Stammler & Birnstiel 2022), version 1.0.3. Dustpy calculates the growth and fragmentation of dust particles, as well as their dynamics. Because we assumed that the gas surface density profile remained constant over time, we did not include gas evolution in these models. Details about the equations solved in these dust evolution models are given in Birnstiel et al. (2010) and Stammler & Birnstiel (2022).
The original radial grid from the hydrodynamical simulations that had 672 cells (from 2.2 and 198 au) was interpolated to 100 cells to speed up the dust evolution models. With this resolution, we resolved the outer edge of the gap, where particles accumulate with about 26 radial cells, and the gap and inner disk were resolved with more radial cells because the grid is logarithmically spaced. A resolution test is present in Appendix A. The peak of the pressure maximum from the hydro models is about 60 au. This peak should coincide with the peak of the ring observed at millimeter observations at 77 au. In our models, we took the pressure maximum as the reference point, and we therefore scaled the results from the hydrodynamical simulation before performing the dust evolution models, such that the pressure maximum was at 77 au. After this correction, the radial grid extended from 2.9 to 249 au.
The stellar parameters were the same as in Bae et al. (2019), that is, a 0.85 M⊙ stellar mass. The viscosity was taken as in the hydrodynamical simulations (α = 10−3), which was also assumed for dust diffusion and for the vertical and radial turbulence of the dust (Pinilla et al. 2021).
The fragmentation velocity of the particles was assumed to be 10 m s−1. This fragmentation velocity assumes that the outer layer of the grains is composed of water-ice, for which the sticking force is thought to be strong. Currently, there are no laboratory experiments that reproduce the collisions of waterice dust particles at the low temperatures and pressures of those of protoplanetary disks (Blum et al. 2000; Wada et al. 2009; Gundlach et al. 2018; Arakawa et al. 2023). Laboratory experiments that decreased the temperature of dust collision experiments to ~150–180 K suggested that water-ice particles may not be as sticky as thought before and that the fragmentation velocity is lower (~1 m s−1, e.g., Musiolik & Wurm 2019; Steinpilz et al. 2019). Pinilla et al. (2021) demonstrated that when the fragmentation velocity of the particles is 1 m s−1 in the entire disk, the disk needs to have low turbulence to be able to reproduce millimeter observations of typical disks. However, with low turbulence (α < 10−4), a Jupiter-mass planet is expected to create multiple types of substructures, which are not observed in the PDS 70 disk, including multiple rings, gaps, and asymmetries (e.g. Ataiee et al. 2013; Bae et al. 2018). We therefore decided to work with the hydrodynamical results that assumed α = 10−3, for which υf = 10 m s−1 works well to reproduce observations.
The dust density distribution was initially assumed as the interstellar medium to follow a power law as n(a) ∝ a−3.5 from a minimum grain size, which we varied between [1 × 10⁻⁶, 1 × 10⁻⁵, 5 × 10⁻⁵] cm. The maximum grain size in the initial dust size distribution was 1 × 10⁻⁴ cm. We therefore present results from three different models. We note that in Pinilla et al. (2016), we investigated the effect of assuming a different power law for the initial condition of dust distribution on the dust trapping and filtration, and we found that the results are not affected by this assumption.
These initial minimum grain sizes were selected to explore the dust filtration at the outer edge of the gap and investigate the size of dust particles that is required to maintain the inner disk. Because the grains were allowed to grow, the maximum grain size of the grid was 10 cm, and we took 7 grid cells for each order of magnitude in mass (Stammler & Birnstiel 2022). This means that the grain size grid had 148, 127, and 113 cells when ainitial = [1 × 10⁻⁶–10−4] cm, ainitial = [1 × 10⁻⁵–10−4] cm, and ainitial = [5 × 10⁻⁵–10−4] cm, respectively. The initial dust-to-gas ratio was 1/100. The volume density of the particles (ρs) was set to 0.85 g cm−3 in order to be consistent with the grain composition and opacities assumed in the radiative transfer simulations. The simulations ran from 0 to 10 Myr. Under the hypothesis that the two planets required at least 1 Myr to form in addition to the 1 Myr of planet-disk interaction in the hydrodynamical models, the initial time of the dust evolution models should be seen as at least 2 Myr of the disk age.
2.3 Radiative transfer simulations
To compare the results from the dust evolution models to previous and future ALMA observations and give predictions for different wavelengths, we performed radiative transfer calculations with RADMC3D (Dullemond et al. 2012). The opacity of each grain size was calculated using optool (Dominik et al. 2021), and we assumed that the grains were porous spheres with a vacuum volume fraction of 40% and that they were composed of 10% silicate, 20% carbon, and 30% water ice (Ricci et al. 2010). This composition gives a volume density of the dust particles of 0.85 g cm−3. Stadler et al. (2022) and Zormpas et al. (2022) demonstrated that with these opacities, the models ofdust evolution and radiative transfer agree better with observations, specifically, with the millimeter fluxes and spectral indices (in contrast to the DSHARP opacities, Birnstiel et al. 2018).
The only source of radiation is the central star, which was assumed to be a black-body with a temperature of 3972 K. For our calculations, we assumed 1 × 10⁷ photons and 5 × 10⁶ scattering photons.
We calculated the total volume dust density of each grain size as
 (1)
(1)
where z = r cos(θ) and R = r sin(θ), with θ being a polar angle. Σd is the dust surface density obtained from the dust evolution models. The radial grid was assumed as in the dust evolution models, and for the vertical and azimuthal grid, we assumed 32 and 64 cells, respectively. The dust scale height hd for each particle size was given by (Youdin & Lithwick 2007; Birnstiel et al. 2010)
 (2)
(2)
where α = 10−3 as in the hydrodynamical and dust evolution models, and St is the Stokes number of the dust particles calculated at the midplane, which is
 (3)
(3)
with a as the grain size, and Σg the gas surface density. A similar procedure was used for example by Pohl et al. (2017) and Pinilla et al. (2021).
3 Results
3.1 Dust density distribution
Figure 1 shows the dust density distribution after 1 Myr (top panels) and 10 Myr (bottom panels) of evolution as a function of grain size and distance from the star. The y-axis of each column is different because it depends on the initial grain size that is assumed in the models (given in the title of each column). The plots include the St=1 (solid white line), which is proportional to the gas surface density taken from the hydrodynamical simulations.
The left column of Fig. 1 corresponds to models where ainitial = [5 × 10⁻⁵–10−4] cm, which is our model with the largest minimum grain size. As expected, the filtration of dust particles at the outer edge of the gap created by the planets is very efficient in this case. At 1 Myr of evolution, the dust grains that were initially within the gap have drifted toward the star, and after 10 Myr of evolution, very little dust is left in the inner disk.
This efficient filtration can be understood in terms of the radial dust velocity of particles, which is given by
 (4)
(4)
where υr,gas is the radial gas velocity, P is the gas pressure, ρ is the gas volume density, and Ω is the Keplerian frequency.
Only when υr,dust is positive are particles trapped. This implies that particles larger than critical size acritical are filtered out (Pinilla et al. 2012), with
 (5)
(5)
Because all the terms in Eq. (5) are quantities related to the gas, except for ρs (which is the volume density of the dust particles set to 1.6 g cm−2), acritical can be calculated given the gas density distribution from the hydrodynamical simulations. When we assume hydrostatic equilibrium of a locally isothermal disk and viscous accretion to calculate ρ and υr,gas, respectively, acritical at the outer edge of the gap is ~0.1 µm. For this reason, when ainitial = [5 × 10⁻⁵–10−4] cm, the dust filtering at the outer edge of the gap is very effective, which leads to a high depletion of dust in the inner disk. In a few words, the dust of the inner disk disconnects from the outer disk, and the dust that was initially inside the gap drifts toward the star, while in the outer disk, it drifts toward the pressure maximum at the outer edge of the gap.
The values of acritical at the outer edge of the gap do not change significantly when considering the gas radial velocity directly from the hydrodynamical simulations. However, we did not perform dust evolution models with these gas velocities due to the large fluctuations near the planet (see for example Fig. 3 in Drążkowska et al. 2019), which can lead to artificial dust accumulations when gas and dust evolution are not modeled simultaneously.
The result of efficient filtration is seen in Fig. 2, which corresponds to the total dust disk mass within 16 au as a function of time for the models of Fig. 1. The reference location of 16 au is taken below to compare to the results from Portilla-Revelo et al. (2023). The total dust mass within this inner region at the initial time is the same for all the three models (~0.9 M⊕). In the model where ainitial = [5 × 10⁻⁵–10−4] cm, this mass is reduced to 3.3 × 10⁻⁴ M⊕ (or 0.025 MMoon) after 1 Myr of evolution, and it continues to decrease, reaching values of 8.4 × 10⁻⁶ M⊕ after 10 Myr.
The results of these models motivated us to decrease the size of the initial dust particles to as low as the critical grain size (Eq. (5)) of 0.1 µm or even lower. The middle and right columns of Fig. 1 show the dust density distribution with ainitial = [10−5–10−4] cm and ainitial = [10−6–10−4] cm, respectively. These results show that the dust density distribution in the inner disk increases in these two cases and that the dust filtration at the outer edge of the gap is not total. The dust mass within 16 au for the ainitial = [10−5–10−4] cm case decreases to 4.6 × 10⁻⁴ M⊕ after 1 Myr of dust evolution, similar to the case of ainitial = [5 × 10⁻⁵–10−4] cm, but after this time, the dust mass does not significantly decrease over the next million years (Fig. 2). This is because the inner disk is continuously replenished by the very small grains (~0.1 µm) that can flow through the gap. The replenishment of the inner disk from the outer disk dust trap is more efficient when the initial dust size distribution includes smaller grains, ainitial = [10−6–10−4] cm, as grains with lower Stokes number can be more efficiently dragged and diffused by the gas. This is reflected in the total amount of dust that remains in the inner disk in these simulations (Fig. 2). For this case, the total amount of dust mass is ~1.6 × 10⁻³ M⊕ after 1 Myr of evolution, which remains constant until the end of the simulations (10 Myr). This amount of dust is much lower than the dust inferred by Benisty et al. (2021) for the inner disk of 0.08–0.36 M⊕ for a minimum and a maximum grain size of 0.05 µm and 10 µm, respectively, and the DSHARP opacities (Birnstiel et al. 2018). In our models, the maximum grain size in the inner disk varied between amax ~10–100 µm depending on the distance from the star, as shown in Fig. 3. Therefore, our models have grains of higher opacity at millimeter wavelengths than those considered in Benisty et al. (2021), especially when comparing the DSHARP opacities with those used in our models from Ricci et al. (2010; see for example Fig. A.3 in Stadler et al. 2022). Even with lower dust masses, our models can therefore reproduce the millimeter emission of the inner disk observed with ALMA. It is worthwhile to note that the obtained grain distribution in the inner disk (Fig. 3) is very different from the size distribution of interstellar grains from (MRN distribution Mathis et al. 1977) of n(a) ∝ a−3.5, which was assumed in the calculations by Benisty et al. (2021), and this is plotted in Fig. 3 for comparison. Most of the recent dust models for the interstellar medium find a different size distributions than the MRN (e.g. Köhler et al. 2015; Jones et al. 2017; Hensley & Draine 2023), which can also affect the inferred dust mass from the inner disk presented in Benisty et al. (2021).
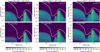 |
Fig. 1 Results from dust evolution models for the PDS 70 disk. Specifically, dust density distributions after 1 Myr (top panels) and 10 Myr (bottom panels) of evolution as a function of grain size (y-axis) and distance from the star (x-axis). The difference in simulations is the minimum grain size in the initial dust size distribution, that is, decreasing from the left to the right column. The y-axis is different for each column because the grain size grid depends on the initial grain size that is assumed (given in the title of each column). |
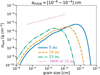 |
Fig. 3 Grain size distribution at radial distances of 5, 10, and 15 au (this means inside the orbit of PDS 70b) for the models where ainitial = [1 × 10⁻⁶–10−4] cm. The dotted line shows the MNR distribution at 10 au for comparison. |
 |
Fig. 4 Comparison between models and ALMA observations of PDS 70. Left panel: ALMA dust continuum emission at 855 µm from Benisty et al. (2021) vs. synthetic images at the same wavelength taking the models of Fig. 1 after 1 Myr of evolution. The beam for the synthetic images is assumed to be as in the observations, i.e., ~0.046″×0.36″ with a position angle of 51.5°. |
3.2 Comparison with ALMA observations
Figure 4 shows the comparison of models and current ALMA observations of PDS 70. For this comparison, synthetic images were created at the same wavelength (855 µm) as the observations presented in Benisty et al. (2021), assuming the dust density distribution from the models shown in Fig. 1 after 1 Myr of evolution. The beam for the synthetic images was assumed to be as in the ALMA observations, that is, ~0.046″×0.36″, with a position angle of 51.5°.
The synthetic images in Fig. 4 demonstrate that the dust evolution models assuming ainitial = [5 × 10⁻⁵–10−4] cm or ainitial = [10−5–10−4] cm do not reproduce the emission of the inner disk that is observed. This is also shown in the left panel of Fig. 5, which corresponds to the comparison of the azimuthally averaged radial intensity profiles of the deprojected images from the observations and the models.
The model in which ainitial = [10−6–10−4] cm can reproduce the emission of the inner disk well even when the total dust mass within this region is very low (~2 × 10⁻³ M⊕). It is worth mentioning that the models with small grains also predict an inner shoulder just within the main ring. This emission is located near the location of the outer planet, in which a small bump is created in between the two gaps. There is a similar shape of emission in the actual observations (Band 7; Benisty et al. 2021) with an inner shoulder within the bright ring (Figs. 4 and 5), but the models underpredict the flux of this structure because the grain size of the dust particles is small at that location. Nonetheless, it is interesting to see that the emission of this shoulder also increases as the minimum grain size in the simulations is smaller and when the filtration is less efficient (left panel in Fig. 5). A higher angular resolution is required to understand the properties of this emission and test whether it is a well-separated ring, for example.
The right panel of Fig. 5 shows the averaged radial intensity profiles of deprojected images obtained at different ALMA bands, showing that the emission decreases at longer wavelengths in the model with ainitial = [10−6–10−4] cm and assuming the same angular resolution as for the observations from Benisty et al. 2021; left panel in Fig. 4). The detection of the inner disk would depend on the sensitivity of the observations to detect it. Already in Band 3 (3 mm), the flux of the inner disk is a few micron-Jy per beam.
Figure 6 shows the total millimeter flux as a function of wavelength from the same ALMA bands as in the right panel of Fig. 4. The fluxes were calculated in three different regions (as denoted in the right panel of Fig. 5), the inner disk (r <16 au), the gap (16 au < r < 36 au), and the ring (36 au < r < 112 au). Using curvefit within scipy (Virtanen et al. 2020), we fit  to find the spectral index αmm of each region. The spectral index of the ring has values of αmm = 3.2. Because the total flux is dominated by the ring emission, the spectral index integrated over the entire disk is also 3.2, which is similar to the value within the gap (3.3).
In this model, the spectral index is slightly higher in the inner disk, with a value of αmm = 3.6. Hence, these models suggest that the spectral index that can be obtained from observations using optically thin wavelengths will show a high spectral index of ~3.2 with a slightly increased inner disk. This value of the spectral index is high compared to the averaged values found in protoplanetary disks (e.g., Tazzari et al. 2021), but for a set of transition disks, Pinilla et al. (2014) showed that the observed spectral index increased with the size of the cavity and that overall, transition disks have a higher spectral index than the disks without cavities. Specifically, the linear relation between the spectral index and the cavity size (defined as the peak observed in millimeter emission) is αmm = 0.011 × Rcavity + 2.36. For a cavity size of ~74 au (Keppler et al. 2019), the expected αmm is 3.2, as found in our models, suggesting that the spatially integrated spectral index of PDS 70 agrees with observations of other transition disks.
These values, however, do not match the spectral index of 2.7 obtained from the total flux at 855 µm (~176 mJy, Keppler et al. 2019) and at 1.3 mm (~57 mJy, Facchini et al. 2021), which could be due to the high optical depth of the observations, especially at 855 µm. Observations at multiple wavelengths where the emission is optically thin are needed to test current models and the results of Fig. 6.
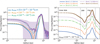 |
Fig. 5 Models and observational predictions for PDS 70disk. Left: comparison of the azimuthally averaged radial intensity profiles of the depro-jected images of the continuum from ALMA Band 7 observations (crosses) and the synthetic images from Fig. 4. The shaded area is the standard deviation of each elliptical bin divided by the square root of the number of beams spanning the full azimuthal angle at each radial bin. Right: predictions for several ALMA bands for the case where ainitial = [10−6–10−4] cm, assuming that all the images have the same resolution as the observations in Band 7 (Fig. 4). |
4 Discussion
4.1 Effect of the gas disk mass and turbulence
The filtration of dust particles at the outer edge of a gap depends on how well the particles are coupled to the gas and on the level of dust diffusion driven by the disk turbulence.
The coupling of dust particles to the gas is quantified by the Stokes number given in Eq. (3). Particles with St≪1 are well coupled to the gas and can be dragged along with it, while St ~ 1 are well trapped and hence filtered out. There is an uncertainty related to the bulk density of the dust particles, and hence an uncertainty related to the dust composition and porosity. In this work, we tested dust evolution models in which the bulk density was assumed to be 1.6 g cm−3, similar to the value obtained when the DSHARP opacities are assumed. This change leads to Stokes numbers that are higher by a factor of ~2 for the same grain size and gas surface density, which does not affect the results presented in this work significantly. In our models, the main uncertainty in the Stokes number is the gas surface density, which directly depends on the gas disk mass. This still remains unknown from observations of most disks and, PDS 70 is no exception.
Portilla-Revelo et al. (2023) performed detailed thermo-chemical models of the ALMA Band 6 observations, in particular, to model the distribution of three CO isotopologs, in order to constrain the gas distribution of PDS 70. Their analysis suggested a gas mass of 3.2 × 10⁻³ MJup within the dust-depleted gap (between 16 and 41 au). The gas mass within the same region in our models is 3.0 × 10⁻³MJup, which agrees well with the values from Portilla-Revelo et al. (2023).
The total disk mass (inside 130 au) from Portilla-Revelo et al. (2023) is 3.0 × 10⁻⁴ M⊙, while in our models, it is 9.0 × 10⁻⁴ M⊙. An assumed lower disk mass would imply that the Stokes number is higher for a given grain size, and as result, less filtration is expected. In other words, a less massive disk would imply that the minimum grain size would need to be lower than the best-case scenario explored in this work (i.e., <1 × 10⁻⁶ cm). Nano-size particles like this have been suggested to be present from observations of some protoplanetary disks (Habart et al. 2021; Kokoulina et al. 2021).
It is still possible that the gas disk mass obtained from CO observations is undestimated because of different chemical and physical processes that can convert most CO into otherrefractory molecules or because CO is sequestered into icy bodies (Schwarz et al. 2018; Krijt et al. 2020). As a test, we performed three dust evolution models in which the gas disk mass was increased by a factor of ten and assumed the same initial grain size as in the models presented in Sect. 3. The summary of these simulations is presented in Fig. 7, and it corresponds to the evolution of the dust mass for each case (as Fig. 2). These results show that when the disk mass is higher, the filtration is lower for a given initial particle size distribution. For instance, for the models with ainitial = [5 × 10⁻⁵–10−4] cm, the dust mass from 1 to 10 Myr is 4 × 10⁻³ M⊕ (similar to the dust mass in the models of Sect. 3, but for ainitial = [10−6–10−4] cm) and does not continuously decrease as in the case of Fig. 2. This highlights the importance of obtaining better constraints on the gas disk mass, which can have a large impact on the dust filtration effect and the dust density distribution in the inner disk of PDS 70.
Recently, Trapman et al. (2022) suggested a new method for measuring gas disk masses from observing N2H+ and CO iso-topologs, which was tested against HD observations of several disks. These observations have not been performed for PDS 70so far, but it would be interesting to test this method in future observations and compare it with the disk masses from Portilla-Revelo et al. (2023), which agree with the values used in this work.
The level of turbulence can also change the effect of filtration, with higher turbulence implying less filtration. However, multiple models and observations of disks suggest that turbulence is rather low (α ≲ 10−3–10−4, see e.g. the recent review by Rosotti 2023). For transition disks in particular, a higher viscosity would imply a less empty cavity or no cavity at all, regardless of the mass of the planets that are embedded in the disk (de Juan Ovelar et al. 2016). On the other hand, a lower viscosity for PDS 70 disk would imply more filtration, but also multiple rings and gaps created by the planets that are embedded in this disk (e.g., Dong et al. 2017; Bae et al. 2018). As a result, a viscosity of α ~ 10−3, as we used here, seems appropriate for PDS 70. The intrinsic nature of α–viscosity is complex in any case. It depends on how the disks are ionized and coupled to the magnetic fields (e.g., Lesur et al. 2023), which can lead to spatial variations of a depending on different enviromental, stellar, and disk properties (Delage et al. 2022).
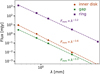 |
Fig. 6 Total millimeter flux as a function of wavelength from the same ALMA bands as in the right panel of Fig. 5 (case of ainitial = [10−6–10−4] cm). The fluxes are calculated in three different regions (as denoted in the right panel of Fig. 4), the inner disk (r < 16 au), the gap (16 au < r < 36 au), and the ring (36 au < r < 112 au). The dashed line shows the best power-law fit to the data and the spectral index for each region. |
4.2 Inner emission and comparison with JWST observations
The JWST/MIRI observations of PDS 70 revealed the presence of water in its inner disk (< 1 au, Perotti et al. 2023). Specifically, the H2O spectrum is best fit with a slab model of gas at 600 K inside 0.05 au and a column density of N = 1.4 × 1018 cm−2. Small grains are of great importance to explain this water emission for two reasons: First, small grains can help to shield ultraviolet light and prevent H2O photodissociation (Heays et al. 2017), and second, they can be the particles that can travel across the gap and enrich the inner disk, as demonstrated in this work.
We calculated the total dust mass that potentially reaches the snowline in PDS 70 by taking the dust-loss rates (Ṁdust) at the inner edge of the simulations in Sect. 2, and integrating over either 0–1 Myr, where the vast majority of the accreted dust comes from the initial material that was inside the gap location, or over 1–3.5 Myr, where most of the material comes from the potential replenishment from the outer to the inner disk. We did not integrate over the entire 10 Myr of the dust evolution models because the age of PDS 70 is approximately 5.4 Myr, and as discussed before, the initial time in the dust evolution models should be seen as at least 2 Myr of the disk age.
For the three different values of the initial grain size of the models in Fig. 1, the total dust mass lost to the inner bounday (Mdust,inner) is approximately 0.9 M⊕ between 0 and 1 Myr for all the three models, and from 1 to 3.5 Myr, it varies between 2.7 × 10⁻⁴ M⊕, 4.5 × 10⁻⁴ M⊕ and 4.3 × 10⁻³ M⊕ for ainitial = [5 × 10⁻⁵–10−4] cm, ainitial = [1 × 10⁻⁵–10−4] cm, and ainitial = [1 × 10⁻⁶–10−4] cm, respectively. Taking the latter case, which reproduces the inner emission observed with ALMA, and assuming that (1) 30% of that dust is water ice (fice, as we assumed for the dust opacities), (2) a percentage of this dust is likely to grow to planetesimals near the snowline (e.g., Carrera et al. 2017; Drążkowska & Alibert 2017), we denote this efficiency as ϵplanetesimals), (3) that at least half of the remaining dust particles that reach the snowline is again moved outward via vapor diffusion Kalyaan & Desch (2019), and (4) that at least half of this dust was accreted by the two planets and/or their circumplanetary disks (Drążkowska & Szulágyi 2018), we calculate the column density of water that is expected within the snowline (i.e., rsnow, which we take at 1 au), assuming an optically thin slab, as
 (6)
(6)
where  is the mass of a water molecule, that is, 18 g mol−1, and i is the disk inclination taken to be 51.7°. Assuming that ϵplanetesimals is 10% or 90%, we obtain that
  is ~6.7 × 1019 cm−2 when ϵplanetesimals is 10% and ~7.5 × 1018 cm−2 when ϵplanetesimals is 90%. There are several assumptions in this calculation. In particular, we neglected any chemical effect that can change the water abundance, but this was done just to illustrate that the water column density observed with JWST might solely originate from drifting particles that come from the outer disk, which need to be small enough in our models (<0.1 µm) to pass through the gap formed by the two giant planets in this system.
5 Conclusions
PDS 70 remains the best laboratory for studying the influence of the formation of giant planets on the disk structure and the potential formation of terrestrial planets within the system. One of the intriguing properties of PDS 70 is its inner disk, which was revealed by the spatially resolved emission observed with ALMA at different wavelengths. Its survival is puzzling because dust evolution models suggest that complete filtering of dust particles by the gap created by the planets would stop the dust replenishment from the outer to the inner disk. We confirmed this result by performing advanced dust evolution models, in which the minimum grain size in the models was larger than 0.1 µm. As a consequence, the initial dust that was within the orbit of the planets eventually migrated inward, and the inner disk was depleted within the first million years of the dust evolution.
To maintain an inner disk, the minimum grain size in the models needs to be lower than 0.1 µm. These results mainly depend on the assumption taken for the gas disk mass, and we performed models with values that agreed with recent thermo-chemical models, which were compared with ALMA observations (Portilla-Revelo et al. 2023). Only when the grains are that small are they diffused and dragged along with the gas throughout the gap of the planets. These small grains grow and drift in the inner disk, but the constant reservoir of dust particles that are trapped in the outer edge of the gap and that fragment continuously helps to preserve the inner disk on million-year timescales. Our flux predictions at millimeter wavelength of these models agree with current ALMA observations. Other possible uncertainties originate from the planet masses. If the planet masses are lower than the mass of Jupiter, the filtration effect is not as efficient as presented in this work. However, observations and models of the PDS 70 disk robustly support that PDS 70b and PDS 70c are more massive than Jupiter.
It is possible that the water emission that was recently observed with the JWST from the inner disk of PDS 70 originates from these small grains that cross the gap and then drift toward the inner disk, where they reach the snowline. This idea can be a mirror of our Solar System, in which the formation of Jupiter and Saturn could have blocked the majority of pebbles in the outer disk, but where water ice could still have been carried by the very small grains in the parental disk of the Solar System. Future observations that better constrain the gas disk mass and the level of turbulence in PDS 70 will help us to test our models.
Acknowledgements
We are very thankful to the referee, whose comments helped to clarify different aspects of this paper. This paper makes use of the following ALMA data: ADS/JAO.ALMA#2018.A.00030.S. ALMA is a partnership of ESO (representing its member states), NSF (USA) and NINS (Japan), together with NRC (Canada), MOST and ASIAA (Taiwan), and KASI (Republic of Korea), in cooperation with the Republic of Chile. The Joint ALMA Observatory is operated by ESO, AUI/NRAO and NAOJ. This project has received funding from the UK Research and Innovation (UKRI) under the UK government’s Horizon Europe funding guarantee from ERC (under grant agreement No 101076489). This project has received funding from the European Research Council (ERC) under the European Union’s Horizon 2020 research and innovation programme (PROTOPLANETS, grant agreement No. 101002188). S.F. is funded by the European Union (ERC, UNVEIL, 101076613). Views and opinions expressed are however those of the author(s) only and do not necessarily reflect those of the European Union or the European Research Council. Neither the European Union nor the granting authority can be held responsible for them. S.F. acknowledges financial contribution from PRIN-MUR 2022YP5ACE.
Appendix A Radial resolution test
We performed a dust evolution model to test the radial resolution of our simulations. The left panel of Fig. A.1 shows the dust density distribution at 1 Myr of evolution for the case of ainitial = [5 × 10⁻⁵ – 10−4] cm as in the top left panel of Fig. 1, but with a higher number of radial cells in the simulations (nr = 300). The right panel of Fig. A.1 shows the total dust disk mass as a function of time for both values of the radial resolution (nr = 300 and nr = 100; due to the computational cost of the high-resolution simulations, we only show results up to 1.5 Myr after the dust disk mass no longer changes over time). Figure A.1 shows no differences in the results when assuming nr = 300 versus nr = 100
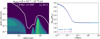 |
Fig. A.1 Resolution test. Left panel: Dust density distribution for the PDS 70 disk after 1 Myr of evolution as in Fig. 1 when ainitial = [5 × 10⁻⁵ – 10−4] cm, and with a radial resolution of nr = 300. Right panel: Total dust disk mass as a function of time for the models considering ainitial = [5 × 10⁻⁵ – 10−4] cm and a radial resolution of the simulation of nr = 300 and nr = 100. |
References
- Aoyama, Y., & Ikoma, M. 2019, ApJ, 885, L29 [NASA ADS] [CrossRef] [Google Scholar]
- Arakawa, S., Tanaka, H., Kokubo, E., Nishiura, D., & Furuichi, M. 2023, A&A, 670, L21 [NASA ADS] [CrossRef] [EDP Sciences] [Google Scholar]
- Asensio-Torres, R., Henning, T., Cantalloube, F., et al. 2021, A&A, 652, A101 [NASA ADS] [CrossRef] [EDP Sciences] [Google Scholar]
- Ataiee, S., Pinilla, P., Zsom, A., et al. 2013, A&A, 553, A3 [Google Scholar]
- Bae, J., Pinilla, P., & Birnstiel, T. 2018, ApJ, 864, L26 [Google Scholar]
- Bae, J., Zhu, Z., Baruteau, C., et al. 2019, ApJ, 884, L41 [NASA ADS] [CrossRef] [Google Scholar]
- Balsalobre-Ruza, O., de Gregorio-Monsalvo, I., Lillo-Box, J., et al. 2023, A&A, 675, A172 [NASA ADS] [CrossRef] [EDP Sciences] [Google Scholar]
- Banzatti, A., Pascucci, I., Bosman, A. D., et al. 2020, ApJ, 903, 124 [NASA ADS] [CrossRef] [Google Scholar]
- Banzatti, A., Pontoppidan, K. M., Carr, J., et al. 2023, ApJ, 957, L22 [NASA ADS] [CrossRef] [Google Scholar]
- Baruteau, C., Barraza, M., Pérez, S., et al. 2019, MNRAS, 486, 304 [Google Scholar]
- Benisty, M., Bae, J., Facchini, S., et al. 2021, ApJ, 916, L2 [NASA ADS] [CrossRef] [Google Scholar]
- Benisty, M., Dominik, C., Follette, K., et al. 2023, Protostars and Planets VII, ASP Conf. Ser., 534, eds. S.-i. Inutsuka, Y. Aikawa, T. Muto, K. Tomida, & M. Tamura (San Francisco: Astronomical Society of the Pacific), 605 [NASA ADS] [Google Scholar]
- Benítez-Llambay, P., & Masset, F. S. 2016, ApJS, 223, 11 [Google Scholar]
- Birnstiel, T., Dullemond, C. P., & Brauer, F. 2010, A&A, 513, A79 [NASA ADS] [CrossRef] [EDP Sciences] [Google Scholar]
- Birnstiel, T., Dullemond, C. P., Zhu, Z., et al. 2018, ApJ, 869, L45 [CrossRef] [Google Scholar]
- Blum, J., Wurm, G., Kempf, S., et al. 2000, Phys. Rev. Lett., 85, 2426 [Google Scholar]
- Campbell-White, J., Manara, C. F., Benisty, M., et al. 2023, ApJ, 956, 25 [NASA ADS] [CrossRef] [Google Scholar]
- Carrera, D., Gorti, U., Johansen, A., & Davies, M. B. 2017, ApJ, 839, 16 [Google Scholar]
- Christiaens, V., Casassus, S., Absil, O., et al. 2019, MNRAS, 486, 5819 [NASA ADS] [CrossRef] [Google Scholar]
- de Juan Ovelar, M., Pinilla, P., Min, M., Dominik, C., & Birnstiel, T. 2016, MNRAS, 459, L85 [NASA ADS] [CrossRef] [Google Scholar]
- Delage, T. N., Okuzumi, S., Flock, M., Pinilla, P., & Dzyurkevich, N. 2022, A&A, 658, A97 [NASA ADS] [CrossRef] [EDP Sciences] [Google Scholar]
- Dominik, C., Min, M., & Tazaki, R. 2021, Astrophysics Source Code Library [record ascl:2104.010] [Google Scholar]
- Dong, R., Hashimoto, J., Rafikov, R., et al. 2012, ApJ, 760, 111 [NASA ADS] [CrossRef] [Google Scholar]
- Dong, R., Li, S., Chiang, E., & Li, H. 2017, ApJ, 843, 127 [Google Scholar]
- Drążkowska, J., & Alibert, Y. 2017, A&A, 608, A92, [Google Scholar]
- Drążkowska, J., & Szulágyi, J. 2018, ApJ, 866, 142 [CrossRef] [Google Scholar]
- Drążkowska, J., Li, S., Birnstiel, T., Stammler, S. M., & Li, H. 2019, ApJ, 885, 91 [Google Scholar]
- Dullemond, C. P., Juhasz, A., Pohl, A., et al. 2012, Astrophysics Source Code Library [record ascl:1202.015] [Google Scholar]
- Facchini, S., Teague, R., Bae, J., et al. 2021, AJ, 162, 99 [NASA ADS] [CrossRef] [Google Scholar]
- Gaia Collaboration (Brown, A. G. A., et al.) 2021, A&A, 649, A1 [NASA ADS] [CrossRef] [EDP Sciences] [Google Scholar]
- Gundlach, B., Schmidt, K. P., Kreuzig, C., et al. 2018, MNRAS, 479, 1273 [NASA ADS] [CrossRef] [Google Scholar]
- Habart, E., Boutéraon, T., Brauer, R., et al. 2021, A&A, 649, A84 [NASA ADS] [CrossRef] [EDP Sciences] [Google Scholar]
- Haffert, S. Y., Bohn, A. J., de Boer, J., et al. 2019, Nat. Astron., 3, 749 [Google Scholar]
- Hashimoto, J., Tsukagoshi, T., Brown, J. M., et al. 2015, ApJ, 799, 43 [CrossRef] [Google Scholar]
- Hashimoto, J., Aoyama, Y., Konishi, M., et al. 2020, AJ, 159, 222 [Google Scholar]
- Heays, A. N., Bosman, A. D., & van Dishoeck, E. F. 2017, A&A, 602, A105 [NASA ADS] [CrossRef] [EDP Sciences] [Google Scholar]
- Hensley, B. S., & Draine, B. T. 2023, ApJ, 948, 55 [Google Scholar]
- Isella, A., Benisty, M., Teague, R., et al. 2019, ApJ, 879, L25 [Google Scholar]
- Jones, A. P., Köhler, M., Ysard, N., Bocchio, M., & Verstraete, L. 2017, A&A, 602, A46 [NASA ADS] [CrossRef] [EDP Sciences] [Google Scholar]
- Kalyaan, A., & Desch, S. J. 2019, ApJ, 875, 43 [Google Scholar]
- Kalyaan, A., Pinilla, P., Krijt, S., Mulders, G. D., & Banzatti, A. 2021, ApJ, 921, 84 [CrossRef] [Google Scholar]
- Kalyaan, A., Pinilla, P., Krijt, S., et al. 2023, ApJ, 954, 66 [NASA ADS] [CrossRef] [Google Scholar]
- Keppler, M., Benisty, M., Müller, A., et al. 2018, A&A, 617, A44 [NASA ADS] [CrossRef] [EDP Sciences] [Google Scholar]
- Keppler, M., Teague, R., Bae, J., et al. 2019, A&A, 625, A118 [NASA ADS] [CrossRef] [EDP Sciences] [Google Scholar]
- Köhler, M., Ysard, N., & Jones, A. P. 2015, A&A, 579, A15 [NASA ADS] [CrossRef] [EDP Sciences] [Google Scholar]
- Kokoulina, E., Matter, A., Lopez, B., et al. 2021, A&A, 652, A61 [NASA ADS] [CrossRef] [EDP Sciences] [Google Scholar]
- Krijt, S., Bosman, A. D., Zhang, K., et al. 2020, ApJ, 899, 134 [NASA ADS] [CrossRef] [Google Scholar]
- Lesur, G., Flock, M., Ercolano, B., et al. 2023, Astronomical Society of the Pacific Conference Series, eds. S. Inutsuka, Y. Aikawa, T. Muto, K. Tomida, & M. Tamura, 534, 465 [NASA ADS] [Google Scholar]
- Long, Z. C., Akiyama, E., Sitko, M., et al. 2018, ApJ, 858, 112 [NASA ADS] [CrossRef] [Google Scholar]
- Mathis, J. S., Rumpl, W., & Nordsieck, K. H. 1977, ApJ, 217, 425 [Google Scholar]
- Müller, A., Keppler, M., Henning, T., et al. 2018, A&A, 617, L2 [Google Scholar]
- Musiolik, G., & Wurm, G. 2019, ApJ, 873, 58 [NASA ADS] [CrossRef] [Google Scholar]
- Perotti, G., Christiaens, V., Henning, T., et al. 2023, Nature, 620, 516 [NASA ADS] [CrossRef] [Google Scholar]
- Pinilla, P., Benisty, M., & Birnstiel, T. 2012, A&A, 545, A81 [NASA ADS] [CrossRef] [EDP Sciences] [Google Scholar]
- Pinilla, P., Benisty, M., Birnstiel, T., et al. 2014, A&A, 564, A51 [NASA ADS] [CrossRef] [EDP Sciences] [Google Scholar]
- Pinilla, P., Klarmann, L., Birnstiel, T., et al. 2016, A&A, 585, A35 [NASA ADS] [CrossRef] [EDP Sciences] [Google Scholar]
- Pinilla, P., Lenz, C. T., & Stammler, S. M. 2021, A&A, 645, A70 [NASA ADS] [CrossRef] [EDP Sciences] [Google Scholar]
- Pohl, A., Benisty, M., Pinilla, P., et al. 2017, ApJ, 850, 52 [Google Scholar]
- Portilla-Revelo, B., Kamp, I., Facchini, S., et al. 2023, A&A, 677, A76 [NASA ADS] [CrossRef] [EDP Sciences] [Google Scholar]
- Ren, B. B., Benisty, M., Ginski, C., et al. 2023, A&A, 680, A114 [NASA ADS] [CrossRef] [EDP Sciences] [Google Scholar]
- Ricci, L., Testi, L., Natta, A., et al. 2010, A&A, 512, A15 [CrossRef] [EDP Sciences] [Google Scholar]
- Rosotti, G. P. 2023, New Astron. Rev., 96, 101674 [NASA ADS] [CrossRef] [Google Scholar]
- Salyk, C., Pontoppidan, K. M., Blake, G. A., Najita, J. R., & Carr, J. S. 2011, ApJ, 731, 130 [Google Scholar]
- Salyk, C., Lacy, J., Richter, M., et al. 2019, ApJ, 874, 24 [NASA ADS] [CrossRef] [Google Scholar]
- Schwarz, K. R., Bergin, E. A., Cleeves, L. I., et al. 2018, ApJ, 856, 85 [Google Scholar]
- Stadler, J., Gárate, M., Pinilla, P., et al. 2022, A&A, 668, A104 [NASA ADS] [CrossRef] [EDP Sciences] [Google Scholar]
- Stammler, S. M., & Birnstiel, T. 2022, ApJ, 935, 35 [NASA ADS] [CrossRef] [Google Scholar]
- Steinpilz, T., Teiser, J., & Wurm, G. 2019, ApJ, 874, 60 [NASA ADS] [CrossRef] [Google Scholar]
- Tazzari, M., Testi, L., Natta, A., et al. 2021, MNRAS, 506, 5117 [NASA ADS] [CrossRef] [Google Scholar]
- Thanathibodee, T., Calvet, N., Bae, J., Muzerolle, J., & Hernández, R. F. 2019, ApJ, 885, 94 [NASA ADS] [CrossRef] [Google Scholar]
- Toci, C., Lodato, G., Christiaens, V., et al. 2020, MNRAS, 499, 2015 [NASA ADS] [CrossRef] [Google Scholar]
- Trapman, L., Zhang, K., van’t Hoff, M. L. R., Hogerheijde, M. R., & Bergin, E. A. 2022, ApJ, 926, L2 [NASA ADS] [CrossRef] [Google Scholar]
- Virtanen, P., Gommers, R., Oliphant, T. E., et al. 2020, Nat. Methods, 17, 261 [Google Scholar]
- Wada, K., Tanaka, H., Suyama, T., Kimura, H., & Yamamoto, T. 2009, ApJ, 702, 1490 [Google Scholar]
- Wang, J. J., Vigan, A., Lacour, S., et al. 2021, AJ, 161, 148 [Google Scholar]
- Youdin, A. N., & Lithwick, Y. 2007, Icarus, 192, 588 [NASA ADS] [CrossRef] [Google Scholar]
- Zhou, Y., Bowler, B. P., Wagner, K. R., et al. 2021, AJ, 161, 244 [NASA ADS] [CrossRef] [Google Scholar]
- Zormpas, A., Birnstiel, T., Rosotti, G. P., & Andrews, S. M. 2022, A&A, 661, A66 [NASA ADS] [CrossRef] [EDP Sciences] [Google Scholar]
All Figures
|
Fig. 1 Results from dust evolution models for the PDS 70 disk. Specifically, dust density distributions after 1 Myr (top panels) and 10 Myr (bottom panels) of evolution as a function of grain size (y-axis) and distance from the star (x-axis). The difference in simulations is the minimum grain size in the initial dust size distribution, that is, decreasing from the left to the right column. The y-axis is different for each column because the grain size grid depends on the initial grain size that is assumed (given in the title of each column). |
| In the text | |
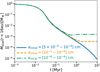 |
Fig. 2 Total dust disk mass within 16 au as a function of time for the models of Fig. 1. |
| In the text | |
|
Fig. 3 Grain size distribution at radial distances of 5, 10, and 15 au (this means inside the orbit of PDS 70b) for the models where ainitial = [1 × 10⁻⁶–10−4] cm. The dotted line shows the MNR distribution at 10 au for comparison. |
| In the text | |
|
Fig. 4 Comparison between models and ALMA observations of PDS 70. Left panel: ALMA dust continuum emission at 855 µm from Benisty et al. (2021) vs. synthetic images at the same wavelength taking the models of Fig. 1 after 1 Myr of evolution. The beam for the synthetic images is assumed to be as in the observations, i.e., ~0.046″×0.36″ with a position angle of 51.5°. |
| In the text | |
|
Fig. 5 Models and observational predictions for PDS 70disk. Left: comparison of the azimuthally averaged radial intensity profiles of the depro-jected images of the continuum from ALMA Band 7 observations (crosses) and the synthetic images from Fig. 4. The shaded area is the standard deviation of each elliptical bin divided by the square root of the number of beams spanning the full azimuthal angle at each radial bin. Right: predictions for several ALMA bands for the case where ainitial = [10−6–10−4] cm, assuming that all the images have the same resolution as the observations in Band 7 (Fig. 4). |
| In the text | |
|
Fig. 6 Total millimeter flux as a function of wavelength from the same ALMA bands as in the right panel of Fig. 5 (case of ainitial = [10−6–10−4] cm). The fluxes are calculated in three different regions (as denoted in the right panel of Fig. 4), the inner disk (r < 16 au), the gap (16 au < r < 36 au), and the ring (36 au < r < 112 au). The dashed line shows the best power-law fit to the data and the spectral index for each region. |
| In the text | |
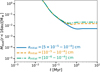 |
Fig. 7 As Fig. 2, but with a gas disk mass that is ten times higher. |
| In the text | |
|
Fig. A.1 Resolution test. Left panel: Dust density distribution for the PDS 70 disk after 1 Myr of evolution as in Fig. 1 when ainitial = [5 × 10⁻⁵ – 10−4] cm, and with a radial resolution of nr = 300. Right panel: Total dust disk mass as a function of time for the models considering ainitial = [5 × 10⁻⁵ – 10−4] cm and a radial resolution of the simulation of nr = 300 and nr = 100. |
| In the text | |
Current usage metrics show cumulative count of Article Views (full-text article views including HTML views, PDF and ePub downloads, according to the available data) and Abstracts Views on Vision4Press platform.
Data correspond to usage on the plateform after 2015. The current usage metrics is available 48-96 hours after online publication and is updated daily on week days.
Initial download of the metrics may take a while.