Open Access
Fig. 3
Download original image
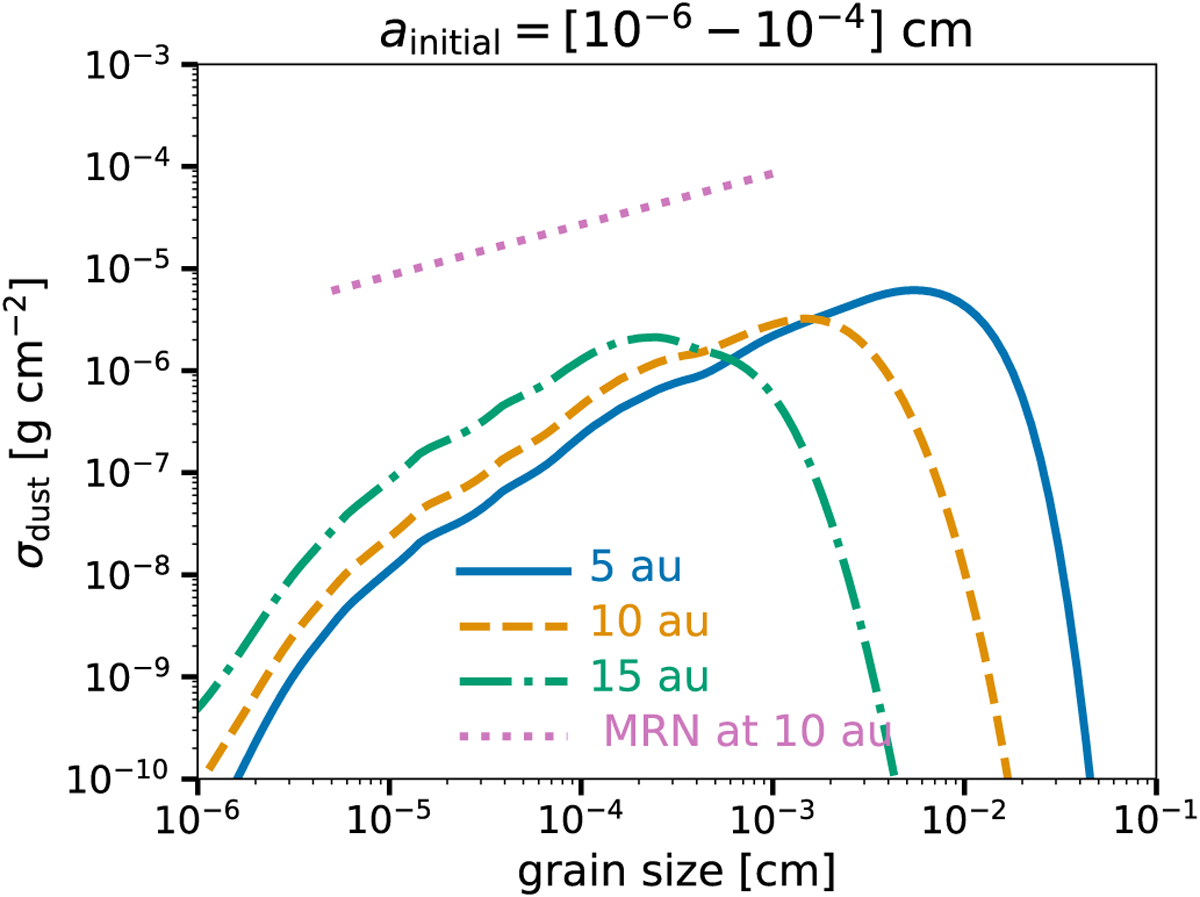
Grain size distribution at radial distances of 5, 10, and 15 au (this means inside the orbit of PDS 70b) for the models where ainitial = [1 × 10⁻⁶–10−4] cm. The dotted line shows the MNR distribution at 10 au for comparison.
Current usage metrics show cumulative count of Article Views (full-text article views including HTML views, PDF and ePub downloads, according to the available data) and Abstracts Views on Vision4Press platform.
Data correspond to usage on the plateform after 2015. The current usage metrics is available 48-96 hours after online publication and is updated daily on week days.
Initial download of the metrics may take a while.