Fig. A.1
Download original image
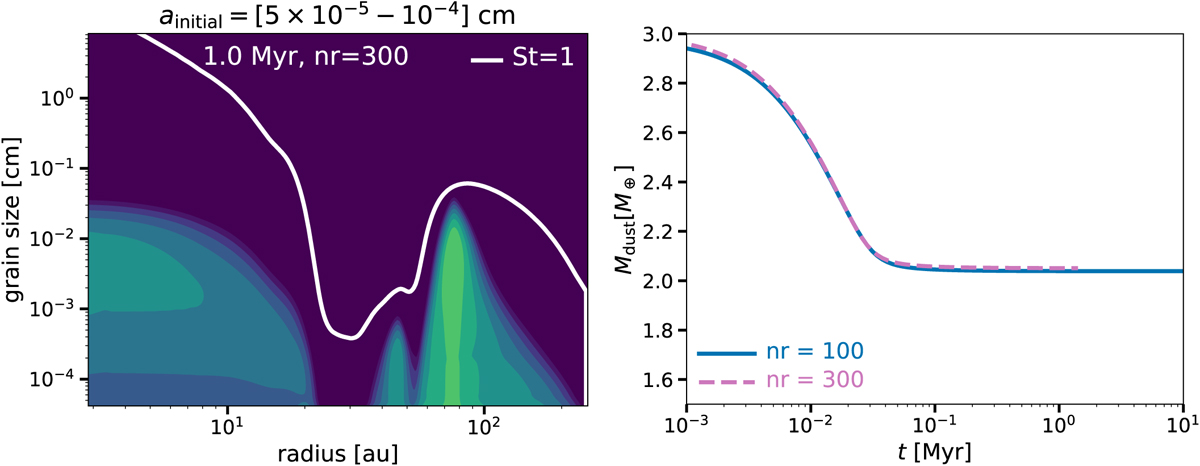
Resolution test. Left panel: Dust density distribution for the PDS 70 disk after 1 Myr of evolution as in Fig. 1 when ainitial = [5 × 10⁻⁵ – 10−4] cm, and with a radial resolution of nr = 300. Right panel: Total dust disk mass as a function of time for the models considering ainitial = [5 × 10⁻⁵ – 10−4] cm and a radial resolution of the simulation of nr = 300 and nr = 100.
Current usage metrics show cumulative count of Article Views (full-text article views including HTML views, PDF and ePub downloads, according to the available data) and Abstracts Views on Vision4Press platform.
Data correspond to usage on the plateform after 2015. The current usage metrics is available 48-96 hours after online publication and is updated daily on week days.
Initial download of the metrics may take a while.