Fig. 1
Download original image
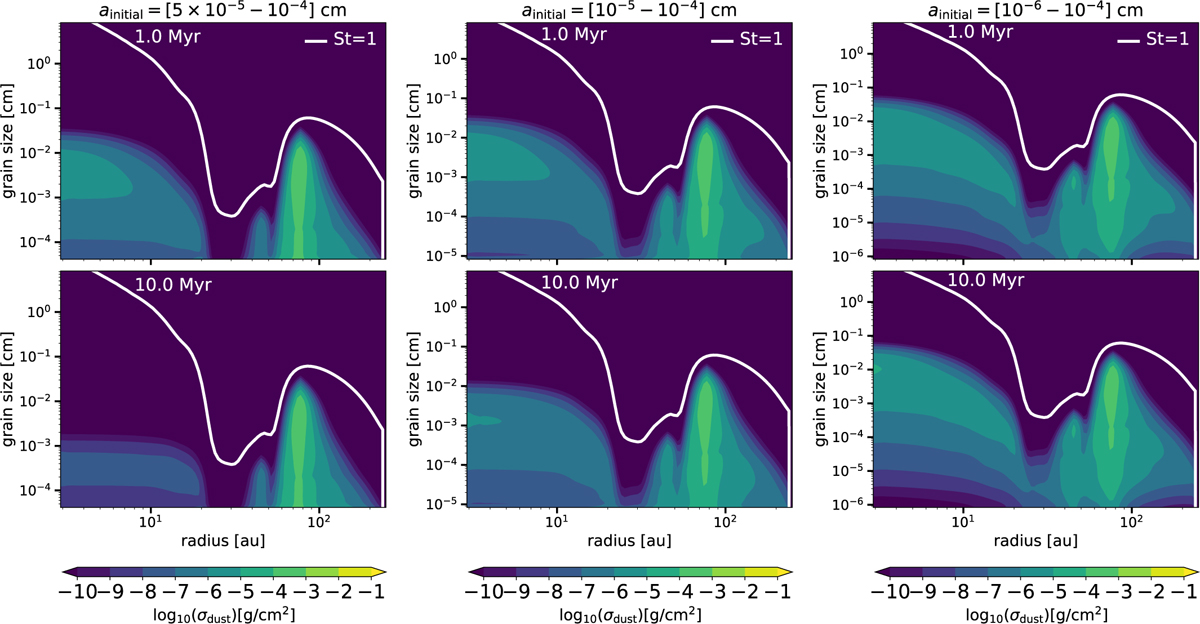
Results from dust evolution models for the PDS 70 disk. Specifically, dust density distributions after 1 Myr (top panels) and 10 Myr (bottom panels) of evolution as a function of grain size (y-axis) and distance from the star (x-axis). The difference in simulations is the minimum grain size in the initial dust size distribution, that is, decreasing from the left to the right column. The y-axis is different for each column because the grain size grid depends on the initial grain size that is assumed (given in the title of each column).
Current usage metrics show cumulative count of Article Views (full-text article views including HTML views, PDF and ePub downloads, according to the available data) and Abstracts Views on Vision4Press platform.
Data correspond to usage on the plateform after 2015. The current usage metrics is available 48-96 hours after online publication and is updated daily on week days.
Initial download of the metrics may take a while.