Fig. 5
Download original image
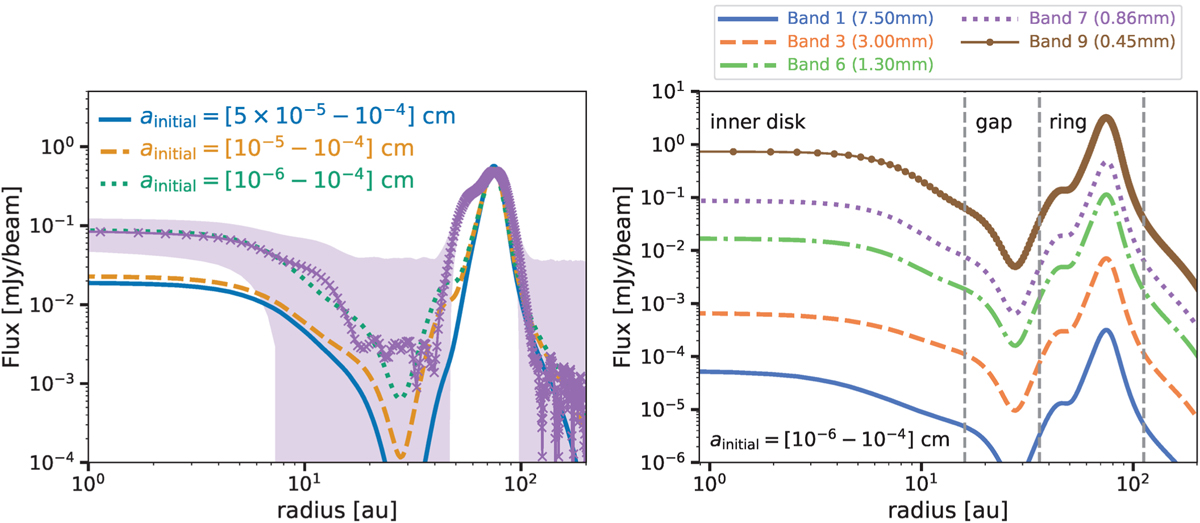
Models and observational predictions for PDS 70disk. Left: comparison of the azimuthally averaged radial intensity profiles of the depro-jected images of the continuum from ALMA Band 7 observations (crosses) and the synthetic images from Fig. 4. The shaded area is the standard deviation of each elliptical bin divided by the square root of the number of beams spanning the full azimuthal angle at each radial bin. Right: predictions for several ALMA bands for the case where ainitial = [10−6–10−4] cm, assuming that all the images have the same resolution as the observations in Band 7 (Fig. 4).
Current usage metrics show cumulative count of Article Views (full-text article views including HTML views, PDF and ePub downloads, according to the available data) and Abstracts Views on Vision4Press platform.
Data correspond to usage on the plateform after 2015. The current usage metrics is available 48-96 hours after online publication and is updated daily on week days.
Initial download of the metrics may take a while.