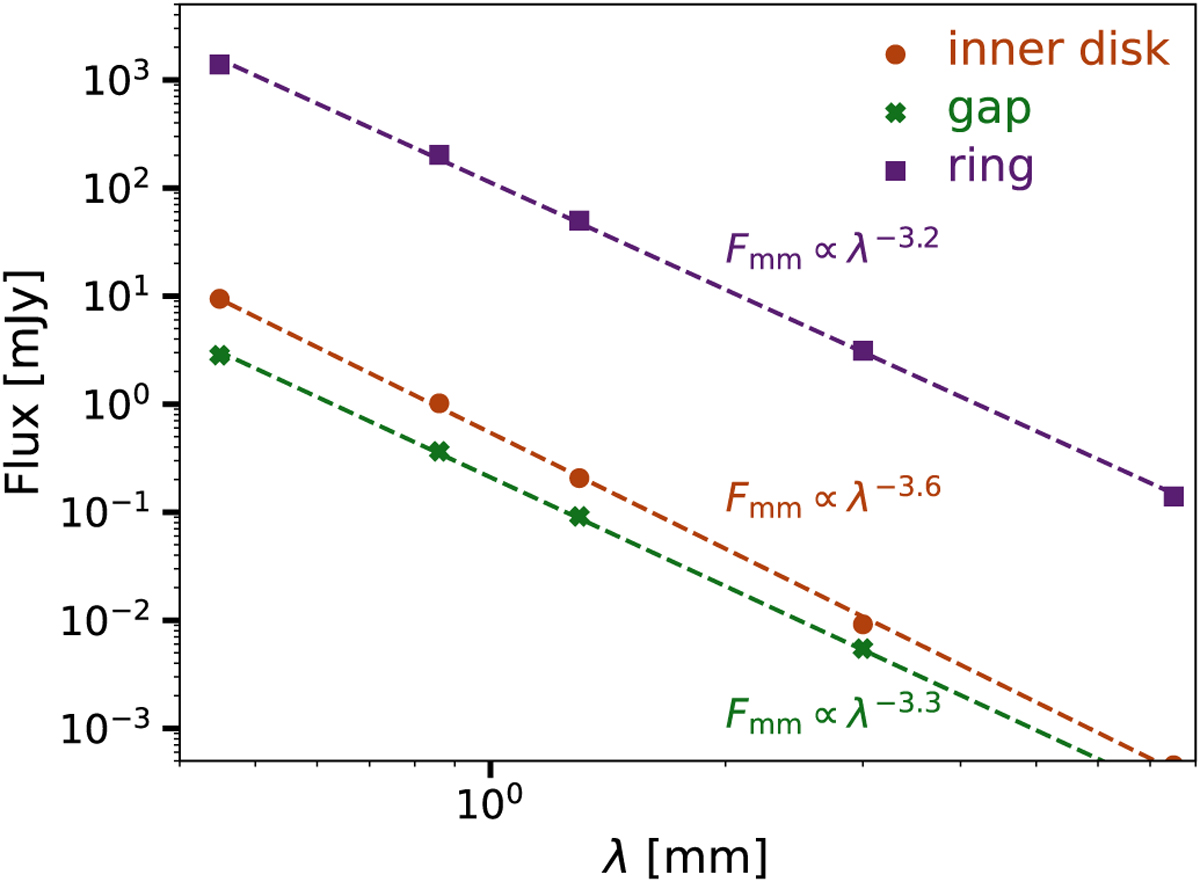
Fig. 6
Download original image
Total millimeter flux as a function of wavelength from the same ALMA bands as in the right panel of Fig. 5 (case of ainitial = [10−6–10−4] cm). The fluxes are calculated in three different regions (as denoted in the right panel of Fig. 4), the inner disk (r < 16 au), the gap (16 au < r < 36 au), and the ring (36 au < r < 112 au). The dashed line shows the best power-law fit to the data and the spectral index for each region.
Current usage metrics show cumulative count of Article Views (full-text article views including HTML views, PDF and ePub downloads, according to the available data) and Abstracts Views on Vision4Press platform.
Data correspond to usage on the plateform after 2015. The current usage metrics is available 48-96 hours after online publication and is updated daily on week days.
Initial download of the metrics may take a while.