| Issue |
A&A
Volume 683, March 2024
|
|
|---|---|---|
| Article Number | A16 | |
| Number of page(s) | 27 | |
| Section | Interstellar and circumstellar matter | |
| DOI | https://doi.org/10.1051/0004-6361/202347726 | |
| Published online | 01 March 2024 | |
Kinematic signatures of planet–disk interactions in vertical shear instability-turbulent protoplanetary disks★
1
Max Planck Institute for Astronomy,
Königstuhl 17,
69117
Heidelberg,
Germany
e-mail: This email address is being protected from spambots. You need JavaScript enabled to view it.
2
Department of Earth, Atmospheric, and Planetary Sciences, Massachusetts Institute of Technology,
Cambridge,
MA
02139,
USA
Received:
14
August
2023
Accepted:
24
October
2023
Abstract
Context. Planets are thought to form inside weakly ionized regions of protoplanetary disks, where turbulence creates ideal conditions for solid growth. However, the nature of this turbulence is still uncertain. In fast cooling parts of this zone the vertical shear instability (VSI) can operate, inducing a low level of gas turbulence and large-scale gas motions. Resolving the kinematic signatures of active VSI could reveal the origin of turbulence in planet-forming disk regions. However, an exploration of kinematic signatures of the interplay between VSI and forming planets is needed for a correct interpretation of radio interferometric observations. A robust detection of VSI would lead the way to a deeper understanding of the impact of gas turbulence on planet formation.
Aims. The objective of this study is to explore the effect of VSI on the disk substructures triggered by an embedded fairly massive planet. We focus on the impact of this interplay on CO kinematic observations with the ALMA interferometer.
Methods. We conducted global 3D hydrodynamical simulations of VSI-unstable disks with and without embedded massive planets, exploring Saturn- and Jupiter-mass cases. We studied the effect of planets on the VSI gas dynamics, and made a comparison with viscous disks. Post-processing the simulations with a radiative transfer code, we examined the kinematic signatures expected in CO molecular line emission, varying disk inclination. Further, we simulated deep ALMA high-resolution observations of our synthetic images, to test the observability of VSI and planetary signatures.
Results. The embedded planet produces a damping of the VSI along a radial region, most effective at the disk midplane. For the Saturn case, the VSI modes are distorted by the planet’s spirals producing mixed kinematic signatures. For the Jupiter case, the planet’s influence dominates the overall disk gas kinematics.
Conclusions. The presence of massive planets embedded in the disk can weaken the VSI large-scale gas flows, limiting its observability in CO kinematic observations with ALMA.
Key words: accretion, accretion disks / turbulence / planets and satellites: formation / protoplanetary disks / planet–disk interactions
The movie associated with Fig. A.4 is available at https://www.aanda.org
© The Authors 2024
 Open Access article, published by EDP Sciences, under the terms of the Creative Commons Attribution License (https://creativecommons.org/licenses/by/4.0), which permits unrestricted use, distribution, and reproduction in any medium, provided the original work is properly cited.
This article is published in open access under the Subscribe to Open model.
Open Access funding provided by Max Planck Society.
1 Introduction
The detection of thousands of exoplanets combined with recent observations of signatures of embedded planets in young gas-rich protoplanetary disks demonstrates that planet formation is a ubiquitous process in nature, and possibly fast and efficient. Nevertheless, the fundamental processes that pave the way from micron-sized dust particles to a planetary embryo are still far from understood. In particular, precise knowledge of the impact of turbulence on the planet formation process and disk evolution is still one of the missing links to connect the early stages of circumstellar disks to mature planetary systems (Drążkowska et al. 2023). Gas turbulence can drive angular momentum transport, and substantially affect the disk dust size and dynamical evolution, the formation of substructures, the disk thermo-chemical evolution, planetary accretion of gas and pebbles, and planet migration (Lesur et al. 2023). Therefore, understanding the origin of turbulence is crucial for further progress in planet formation theories and the interpretation of disk observations. As an example, turbulence is an essential Solar Nebula property to trace back the formation history of our Solar System (Lenz et al. 2020).
Various disk instabilities have been studied to comprehend turbulence in circumstellar disks, evoking different disk local physical conditions; therefore, they possibly operate within the disk in concert. The dominant source of turbulence at each location would depend, for example, on the disk environment, disk and stellar host properties, and the specific disk region’s conditions (Malygin et al. 2017; Pfeil & Klahr 2019; Lyra & Umurhan 2019; Lesur et al. 2023). Among the candidates, we can summarize the magneto-rotational instability (MRI: Balbus & Hawley 1991, 1998; Hawley & Balbus 1991), the vertical shear instability (VSI: Nelson et al. 2013), the convective overstability (COV: Klahr & Hubbard 2014), and the zombie vortex instability (ZVI: Marcus et al. 2015: see e.g., Lesur et al. 2023 and Lyra & Umurhan 2019 for a summary of these instabilities). Therefore, unraveling the physical processes behind disk turbulence requires careful analysis that directly compares resolved observations of protoplanetary disks and state-of-the-art numerical simulations.
In constraining turbulence levels in protoplanetary disks, ALMA dust and gas molecular line observations have been fundamental, providing evidence for weak turbulence in the probed disk regions (e.g., Teague et al. 2016, 2018; Flaherty et al. 2018, 2020; Villenave et al. 2020, 2022). In these regions, tens of au from the central star, purely hydrodynamical instabilities are consistent with the expected low disk ionization (i.e., MRI-dead zone; Gammie 1996) and the observed turbulence upper limits. Among the candidates, the VSI is the most likely to operate on these outer regions, due to the predicted fast cooling rates (Malygin et al. 2017; Pfeil & Klahr 2019; Lyra & Umurhan 2019). Further, spatially and spectrally resolved CO kinematic observations have the potential to confirm such a scenario, detecting coherent corrugated flows driven by VSI (Barraza-Alfaro et al. 2021).
Recent ALMA molecular line observations have demonstrated the feasibility of fully resolving the gas kinematic structure of planet-forming disks, revealing the signatures of perturbations of the disk (sub-)Keplerian gas flow (Teague et al. 2019b, 2021, 2022; Disk Dynamics Collaboration 2020; Garg et al. 2022; Wölfer et al. 2023; Galloway-Sprietsma et al. 2023; Pinte et al. 2023). These deviations from Keplerian rotation could be a dynamical manifestation of disk instabilities (Hall et al. 2020; Barraza-Alfaro et al. 2021), but embedded planets are often favored (e.g., Izquierdo et al. 2022; Stadler et al. 2023; Pinte et al. 2023). In addition to substructures present in dust observations (e.g., van Boekel et al. 2017; Andrews et al. 2018; Segura-Cox et al. 2020; Garufi et al. 2018; Bae et al. 2023; Benisty et al. 2023), this points toward an unseen population of fairly massive planets embedded in the observed protoplanetary disks (see Asensio-Torres et al. 2021), with the exception of the directly observed PDS 70 b and c (Keppler et al. 2018; Benisty et al. 2021).
If massive planets are embedded in the disk (masses comparable to and above the thermal mass, see Lin & Papaloizou 1993 and Goodman & Rafikov 2001), they can strongly modify the disk density and dynamical structure (Keppler et al. 2019; Bae et al. 2019; Paardekooper et al. 2023). Interactions between massive planets and the gaseous protoplanetary disk produces a depleted gap (e.g., Crida & Morbidelli 2007; Bergez-Casalou et al. 2020), spiral wakes around the planet’s location (e.g., Pérez et al. 2018), large-scale spiral arms via Lindblad resonances and buoyancy resonances (e.g., Bae & Zhu 2018a,b; Bae et al. 2021), anti-cyclonic Rossby-wave vortices (Lovelace et al. 1999; Li et al. 2000; de Val-Borro et al. 2007), meridional flows (e.g., Kley et al. 2001; Fung & Chiang 2016; Teague et al. 2019a), and a circumplanetary disk (e.g., D’Angelo et al. 2002, 2003; Gressel et al. 2013; Szulágyi et al. 2014). This myriad of structures has a substantial impact on the disk gas velocities (e.g., Rabago & Zhu 2021). This implies that it has a direct imprint on the observed disk kinematic structure (Perez et al. 2015; Pérez et al. 2018; Teague et al. 2019a; Bae et al. 2021). Moreover, planets could potentially affect the development of the VSI in the disk (Stoll et al. 2017b; Ziampras et al. 2023; Hammer & Lin 2023), and thus the observability of VSI signatures.
In this work, we study the kinematic structure resulting from the interplay between vertical shear instability and the structures triggered by a fairly massive planet. The paper is structured as follows. We describe the numerical methods for the hydrodynamical simulations in Sect. 2, and present their results in Sect. 3. The radiative transfer post-processing, simulated observations, and techniques to extract observables are detailed in Sect. 4, whose results are presented in Sect. 5. In Sect. 6 we discuss a potential approach to confirm VSI signatures observationally, and the limitations of our work. Finally, we summarize the main findings of our study in Sect. 7.
2 Hydrodynamical simulations: methods
We performed 3D global hydrodynamical simulations using the Godunov grid based code PLUTO1 (Mignone et al. 2007). We used the publicly available version 4.4 of PLUTO, solving the Navier-Stokes equations of classical fluid dynamics, without magnetic fields (HD module).
 (1)
(1)
 (2)
(2)
where ρ is the gas mass density, v is the gas velocity vector, P is the pressure, Φ is the gravitational potential, and Π represents the viscous stress tensor. The viscous term is included in the momentum equation only for our α-viscous simulations, while our VSI-unstable disk simulations are inviscid. In our set of simulations, the fluid is affected by the gravitational potentials of a star (Φ★ = −GM★/r) and of embedded planets (see Eq. (5)). The disk self-gravity is not considered in our simulations.
The hydrodynamical equations were solved using a second-order accurate scheme with linear spatial reconstruction, with the least diffuse limiter implemented in PLUTO (monotonized central difference limiter). For the time stepping calculation, we chose the second-order Runge-Kutta time-stepping, while for the solver we used the Harten-Lax-Van Leer Riemann solver. The Courant number was set to 0.3.
We ran a total of five locally isothermal simulations; three VSI-unstable disk simulations for comparison with the case without planets, with a Saturn-mass planet, and with a Jupiter-mass planet; and two α-viscous simulations of planet–disk interactions for comparison with the VSI-unstable cases. For all the simulations the initial conditions of the disk followed the equilibrium solutions of a disk with vertical shear from Nelson et al. (2013; see also Sect. 2.1 in Barraza-Alfaro et al. 2021). For the VSI-unstable disk simulations we ran inviscid numerical simulations; therefore, the code solved the Euler equations. However, for the simulations including viscosity, we included the viscous stresses in the hydrodynamical equations, implemented as a parabolic diffusion term in the momentum equation. The viscosity depends on a shear viscosity coefficient (v), which we set to follow the α-viscosity prescription of Shakura & Sunyaev (1973):
 (3)
(3)
with α constant through the disks, set to α = 5 × 10⁻⁴. The quantities cs and H denote the local sound speed and the disk pressure scale height. For the numerical integration of the diffusion term we chose the super-time-stepping (STS) technique, as implemented in PLUTO, which can accelerate the calculations compared to an explicit treatment.
For the simulation grid the computational domain extends from 0.4 to 2.5 code units of length in the radial direction (r), and in the azimuthal direction (ϕ) the grid covers the full 2π rad. In the meridional direction (colatitude, θ), the grid is set to cover ~10 disk pressure scale heights at R = 1.0, which is 5H for each disk hemisphere. The grid follows a spherical geometry, logarithmically spaced in the radial direction, while evenly spaced in colatitude and azimuth. For the simulations presented, the resolution of the grid is (r,θ,ϕ) = (512, 192, 1024), which gives a resolution of ≈ 19 cells per scale height in the meridional direction at R = 1.0.
We re-scaled the code unit length of the numerical simulations to 100 au; together with the reference aspect ratio at the code unit length of H/R = 0.1, this set a model suited for the disk outer regions. Additionally, the stellar mass was set to be equal to 1 M⊙. Therefore, we used these reference values to re-scale our simulation results in all the figures presented in Sect. 3, and also for the disk model used in the radiative transfer post-processing (Sect. 4).
In the set of simulations presented in this work, we adopted boundary conditions that consist of enforced zero inflow in θ and r, and an extrapolated density and softened vϕ in the meridional direction (see more details in Flock et al. 2017 and Barraza-Alfaro et al. 2021). In order to minimize wave reflections close to the inner and outer radial boundaries, we included buffer zones in which the gas density and radial velocity were damped to the initial profiles with a timescale of 10% of the local orbital period. We applied parabolic damping, as introduced by de Val-Borro et al. (2006). The radial extents covered by the inner and outer buffer zones were equal to 25% of the grid inner radius and 20% of the outer edge radius, respectively.
Planets
We ran simulation of disks with embedded massive planets for two cases, a Saturn-mass case (mp/M⊙ = 0.3 × 10⁻³), and a Jupiter-mass case (mp/M⊙ = 1.0 × 10⁻³). For the disk aspect ratio assumed in our simulations (H/R = 0.1 at the planet’s location), the planet masses correspond to 0.3 and 1.0 thermal masses, respectively, where the thermal mass is the value at which the planet’s Hill sphere matches the sonic point for linear planetary spiral wakes (~ 2H/3; Goodman & Rafikov 2001), defined as:
 (4)
(4)
where ΩP is the planet’s orbital frequency, M★ is the mass of the central star, HP is the pressure scale height at the planet’s position, and Rp is the distance of the planet from the star. The 0.3 Mth planet mass case overlaps with the maximum planet mass studied in Stoll et al. (2017b) of 100 Earth masses, while for planet masses equal to and above 1 Mth nonlinear effects are expected to significantly affect the disk structure (Lin & Papaloizou 1993; Goodman & Rafikov 2001).
For the inclusion of planets, we used a standard approach of slowly inserting the planet as a gravitational potential of a point of mass, with a smoothing around the location of the planet
![Mathematical equation: ${\Phi _P} = \left\{ {\matrix{ { - {{G{M_P}} \over d},} \hfill & {{\rm{ for }}d \ge {d_{rsm}},} \hfill \cr { - {{G{M_P}} \over d}\left[ {{{\left( {{d \over {{d_{rsm}}}}} \right)}^4} - 2{{\left( {{d \over {{d_{rsm}}}}} \right)}^3} + 2\left( {{d \over {{d_{rsm}}}}} \right)} \right],} \hfill & {{\rm{ for }}d < {d_{rsm}},} \hfill \cr } } \right.$](/articles/aa/full_html/2024/03/aa47726-23/aa47726-23-eq5.png) (5)
(5)
where d is the distance between a fluid element and the planet’s position. A potential smoothing length drsm is used to prevent numerical artifacts at the planet’s location. The value of drsm is set to be three cell diagonals evaluated at the planet location. This corresponds to around 56% of Saturn’s and 37% of Jupiter’s Hill spheres (rHill = rp(mp/3M★)1/3)). In order to avoid numerical artifacts during the inclusion of the planet, its mass is smoothly increased from zero to its final mass in 40 and 100 planetary orbits for the Saturn-mass and Jupiter-mass cases, respectively.
To compare our simulations of VSI-unstable disks directly with a case without VSI, we ran the same set of simulations including viscosity following the α-prescription of Shakura & Sunyaev (1973; see Eq. (3)) for a viscosity value comparable to the effective viscosity driven by the VSI (Stoll et al. 2017a). Including viscosity with α = 5 × 10⁻⁴ is enough to damp the VSI in the disk and recover similar structures from previous studies of planet–disk interactions in isothermal disks (e.g., Pérez et al. 2018 and Rabago & Zhu 2021).
We inspected and post-processed the output after 300 orbits (at R = 1.0) of evolution for the VSI simulation without a planet, while for the Jupiter- and Saturn-mass planet simulations we chose the outputs after 145 and 285 orbits, respectively, after the inclusion of the planet. At these selected times the planets have already carved a gap and the structures are in a quasi-steady state.
A summary of the parameters used in the set of simulations is presented in Table 1.
Summary of the parameters used in the global 3D hydrodynamical simulations.
3 Hydrodynamical simulations: results
In this section, we present the results of our set of global 3D hydrodynamical simulations. First, in Sect. 3.1 we inspect the simulation outputs of our three VSI-unstable disk simulations, showing the influence of the planets in the VSI-induced velocity and density structures. The comparison of our set of simulations is performed for the disk midplane layer and above 3 pressure scale heights (Z ~ 3H). Particularly important is to inspect different disk heights, since observations of optically thick CO isotopologues, such as 12CO, trace upper layers of the disk. Optically thinner transitions of less abundant isotopologues, such as C18O can trace deeper disk layers (see Fig. A.3). In Sect. 3.2, we compare the structures obtained in our VSI-unstable and viscous planet-disk interaction simulations, both in the midplane and surface layers.
3.1 Simulations of VSI-unstable disks
A comparison of the face-on view of the simulations at the disk midplane is shown in Fig. 1, while Fig. 2 shows the behavior at 3 pressure scale heights above the midplane layer. In these figures, we present simulations without an embedded planet (first row), with an embedded Saturn-mass planet (second row), and with an embedded Jupiter-mass planet (third row). The columns indicate gas density relative to the initial density field (ρ/ρ0; first column), radial velocity (vr; second column), meridional velocity (vθ; third column), and azimuthal velocity deviations from Keplerian rotation (vϕ − vKep; fourth column). As mentioned above, the simulations have been re-scaled to physical units assuming a central solar-mass star, and disk radii ranging from 40 to 250 au (1 code unit is 100 au). For reference, the midplane sound speed at 100 au for our assumed setup is ≈ 296 m s−1, ≈ 10% of the local Keplerian speed. For visualization purposes, the colorbar limits are adapted to better cover the perturbation’s magnitudes in each panel. In the gas velocity plots, negative values in the radial direction indicate gas moving toward the central star, in the meridional direction positive values indicate gas flowing downward (e.g., positive values at Z ~ 3H represent gas moving toward the midplane); in the azimuthal direction positive means the gas is rotating at velocities higher than the Keplerian rotational velocity (i.e., super-Keplerian). In addition, the location of the planets is indicated by a circle with a radius equal to the planet’s Hill radius, and its orbits are indicated by dotted black lines. The dashed black lines in the first panel mark the buffer zones where the parabolic damping is applied.
In the top row of Figs. 1 and 2 we recover the characteristic velocity structure of a disk unstable to VSI, dominated by a corrugated circulation pattern (see also, e.g., Nelson et al. 2013; Flock et al. 2017; Barraza-Alfaro et al. 2021). In the disk mid-plane (Fig. 1), the axisymmetric meridional flows dominate the disk velocity structure, while closer to the disk surface (Z ≈ 3H; Fig. 2) strong velocity perturbations are seen in all three velocity components. In the simulations including a massive planet (second and third rows in Figs. 1 and 2), a gap depleted of gas is carved by the planet, deeper and more eccentric for the Jupiter-mass planet case. The density contrast produced by the planet-carved gaps is significantly higher than any of the density perturbations produced by VSI alone, which are also only present in the surface layers. At the edges and inside the planet-carved gaps, rings of super- and sub-Keplerian gas are seen, while similar non-Keplerian flows are induced by the VSI-induced density perturbations at the surface layers, although with a corrugated morphology. Additionally, asymmetric structures are triggered by the planet: spiral arms via Lindblad resonances are induced by the planets in the density, radial velocity and azimuthal velocity fields, clearly seen at the disk midplane (see also Fig. 5). Around the planet’s location, strong planetary spiral wakes are also produced by the massive planets. Finally, a large-scale vortex is produced at the outer edge of the gap carved by the Jupiter-mass planet, seen as a horseshoe-shaped gas overdensity; however, it is less prominent in the disk velocities. While VSI also induces asymmetries, as multiple vortices are also present in the disk without planets, they have smaller size scales compared to the Jupiter-induced asymmetry for the examined outputs. At the disk midplane, we observe that the planet-induced perturbations dominate the overall disk structure for ρ, vr, and υϕ. Interestingly, in the meridional velocities, corrugated meridional flows induced by the VSI-unstable modes are still significant, however, only in the outermost region of the disk. This velocity structure is a consequence of the damping of the VSI produced by the presence of the massive planets being more efficient at the midplane layer. The efficient damping toward the disk midplane can also be linked to the vertical shear rate (R∂Ω/dz) increasing with disk height, and therefore maintaining stronger VSI motions toward the disk upper layers. The planet-induced damping of the VSI is apparent in the region inside the planet’s radial location, along the planetary gap, and also at the gap’s outer edge. In the disk’s upper layers, damping of the VSI meridional flows still seems to be present for the Jupiter-mass case, whereas for the Saturn-mass case a mixture of VSI-induced structures and the planet-induced spiral arms is observed. The structure of vθ and vϕ at Z ≈ 3H for the simulations without a planet and a Saturn-mass planet appears to be similar overall. Global damping of the VSI-induced flows is produced by the Saturn-mass planet, inducing perturbations that reach lower velocities for all components. Finally, in the disk surface layers influenced by the Jupiter-mass planet, the localized velocity flows around the planet’s location are the strongest features in the radial and meridional directions, while in the azimuthal direction a ring of super-Keplerian gas at the outer gap edge is the most prominent velocity perturbation. From kinematic observations, identifying the symmetric and asymmetric velocity and density structures in a resolved view of the disk is required to separate different scenarios (see Sect. 5).
To highlight the stronger damping of the VSI at the disk midplane produced by the presence of the embedded planets, we show a Z – R view of our set of VSI-unstable disk simulations in Fig. 3. We present the azimuthally averaged fields, following the same order of presentation as in Figs. 1 and 2. The vertical sliced view of the disk gas velocities shows that the damping of the VSI is more effective in the region below 3 pressure scale heights from the disk midplane (black dotted lines). In the outermost regions of the disk flows induced by the VSI are still active, characterized by columns of gas moving upward or downward. A sketch of the meridional velocity structure in a VSI-unstable disk with an embedded massive planet is presented in Fig. A.1. The different symmetry of the flow direction with respect to the midplane can be exploited to separate between VSI- and planet-induced perturbations (discussed in Sect. 6). In the radial and azimuthal directions, the VSI flows are symmetric with respect to the disk midplane, while planet-induced flows are anti-symmetric. On the contrary, in the meridional direction the VSI flows are anti-symmetric with respect to the midplane, while planet-induced flows are symmetric; that is, at a particular radius gas moves toward the midplane or away from the midplane in both disk hemispheres. We isolate this effect in Fig. A.2, showing the radial profiles of the velocity at Z ~ 3H from the midplane for both disk hemispheres. A clear difference in symmetry relative to the midplane is seen from the (anti-)correlations of the flow directions. Finally, we note that, while a net meridional flow toward the gap carved by the massive planet is seen in the υθ azimuthal averages (Figs. 3 and A.2), they are relatively weak even at Z ~ 3H. Such low magnitudes are consistent with the higher planet masses needed to explain observed meridional flows toward gaps (mp ≥ 2MJup; e.g., Teague et al. 2019a). Moreover, these planet-induced meridional flows do not show an axisymmetric morphology in the r − ϕ plane for VSI-turbulent disks. This characteristic morphology might be important when interpreting resolved 2D maps of the line-of-sight velocity (e.g., Figs. 7 and 8, see Sect. 3.2).
To visualize the planet-induced damping of the VSI, we explored the time evolution of meridional velocity perturbations in our VSI-unstable disk simulations. In Fig. 4 we show the azimuthal average of the midplane meridional velocity (〈υθ〉ϕ at Z = 0) at each orbit, for 300 planetary orbits starting at the time when the planets are included in our planet-disk interaction simulations. The axisymmetry of the VSI-unstable modes in the azimuthal direction allows us to follow the mode evolution in the azimuthal averages. In the first row of Fig. 4 we show the time evolution of a simulation without an embedded planet, where the VSI is operating in its saturated state. Radial migration of the VSI modes toward the central star is observed, in addition to narrow radial regions of low velocities that migrate outward. These results are consistent with previous findings on the time evolution of VSI-unstable modes (e.g., Stoll & Kley 2014; Pfeil & Klahr 2021; Svanberg et al. 2022). We note that the velocities close to the inner grid edge are damped by the effect of the simulation buffer zones. In the second and third rows of Fig. 4 we show the time evolution of the VSI-unstable simulations with an embedded Saturn-mass planet and the simulation with an embedded Jupiter-mass planet, respectively. The planets are in orbit at 100 au from the central star, indicated by the horizontal black dotted line. From the weakened meridional velocity perturbations, we observe that the planets produce a damping of the meridional flows induced by the VSI, particularly strong in the regions inside its radial orbit, along the gap region and gap outer edge. The damping produced by the Saturn-mass planet is less efficient than for the Jupiter case. The VSI motions are still vigorous in most of the outer regions of the disk after 300 orbits (r ≳ 150 au), and show an apparent convergence to a steady state. Due to its stronger influence on the disk structure, the embedded Jupiter produces a more effective damping of the VSI, in which the VSI motions are damped completely up to ~200 au from the star. Contrary to the Saturn-mass simulation, the Jupiter case does not fully converge by the end of our simulation (300 planetary orbits), where the damped region could still grow in radius. A longer simulation run with a larger radial domain is needed to further study the steady state of the gas dynamics of VSI-unstable disk with a Jupiter-mass planet.
In order to confirm that the smaller values of the azimuthally averaged meridional velocity are not exaggerated due to a break of the VSI axisymmetry by the planet–disk interactions, we validated this result by exploring the time evolution of the azimuthally averaged absolute value of υθ, showing the same behavior as presented above.
Our results of planet-induced VSI damping are consistent with previous findings by Stoll et al. (2017b) and independent simulations by Ziampras et al. (2023) and Hammer & Lin (2023), in which we found a stronger damping of VSI motions for a more massive planet. These results can be extrapolated to planets with higher masses, where planets above one thermal mass (equal to one Jupiter mass for our disk model, see Eq. (4)) would strongly damp the VSI and dominate the overall disk gas dynamics. Moreover, our results are consistent with the findings of Lehmann & Lin (2022), where VSI is weakened inside disk pressure bumps.
Regarding the origin of the damping, we did not find a direct correlation of the dampened regions with other quantities. However, the timescale of the damping matches the timescale of the gap opening by the planets. Previously, Stoll et al. (2017b) attributed the damping to the formation of vortices. On the contrary, Manger & Klahr (2018) found that VSI triggers and coexists in large-scale anti-cyclonic vortices (see also Hammer & Lin 2023). While we did not explore this further, the influence of the planet on the vorticity field might play an important role in the VSI damping by creating ring structures in the vorticity field. The origin of damping is hard to isolate since the planets have significant effects on the gas density and pressure structure, from the gap opening and the launching of Lindblad spirals. Therefore, we can only conclude that the VSI is affected by a combination of the effects mentioned above.
Finally, the planet-induced damping of the VSI can substantially impact the settling of dust grains toward the midplane where the damping is strongest. Therefore, a global lower dust scale height is expected for VSI-turbulent disks with embedded planets, relative to a disk with VSI alone, which would vertically mix solid particles (e.g., Flock et al. 2020). However, for particular dust rings at the outer edges of planetary gaps the vertical mixing would depend on the planet’s mass, since planets massive enough to create meridional flows can also lift up dust pebbles (Bi et al. 2021; Binkert et al. 2021). In addition, the VSI damping can strongly modify the turbulent stresses produced by VSI, which define its ability to transport angular momentum (see Ziampras et al. 2023). For kinematic observations of rotational lines, it is expected that the planet-induced damping reduces the chances of detecting VSI signatures near a planetary-gap region, especially relevant for molecules tracing layers near the disk midplane (e.g., C18O(3–2), see Sect. 5).
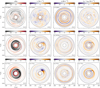 |
Fig. 1 Snapshots of the VSI-unstable hydrodynamical simulations at the disk midplane. Shown (from top to bottom) are a simulation without an embedded planet, with an embedded Saturn-mass planet, and with a Jupiter-mass planet, and (from left to right) the gas density relative to the initial value (ρ/ρ0), radial velocity field (vr), meridional velocity field (vθ), and azimuthal velocity deviations from Keplerian rotation (υϕ − vKep). The included planets are orbiting at 100 au from the central star, marked with dotted lines in the second and third rows. The dashed lines in the first panel indicate the buffer zones applied in the hydro simulations. |
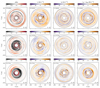 |
Fig. 2 Snapshots of the VSI-unstable hydrodynamical simulations at the disk surface. Same as Fig. 1, but obtained at 3 pressure scale heights from the disk midplane (Z ~ 3H). |
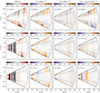 |
Fig. 3 R – Z view of the azimuthally averaged fields of our VSI-unstable disk simulations. Shown (from left to right) are the gas density normalized by its initial value, radial velocity (vr), meridional velocity (vθ), and azimuthal velocity deviations from Keplerian rotation (vϕ − vKep), and (from top to bottom) the simulation without an embedded planet, with a Saturn-mass planet (mp = 0.3mJup), and with a Jupiter-mass planet (mp = mJup). The black dashed lines in the first panel show the simulation buffer zones. The black dotted lines indicate the height at which Z ≈ 3H. The white circles show the radial location of the planets, where each circle’s diameter is set by the planet’s Hill sphere. |
3.2 VSI-unstable disks vs. α-viscous disks
Intending to highlight the structures resulting from the interplay of VSI and massive planets, we compare turbulent VSI-unstable disk simulations and viscous α-disk simulations. As above, we ran the cases of embedded Saturn-mass and Jupiter-mass planets, examining the perturbed density and velocity fields for the midplane layers (Fig. 5), and the surface layers (Z ≈ 3H; Fig. 6). Comparing these sets of simulations is a simplified approach to contrast planet-disk interactions with and without VSI operating in the disk, in which the viscosity included in the α-models prevents the growth of the VSI (see also Stoll et al. 2017b). We present the face-on view of the gas density and velocities; the columns are in the same order as in Figs. 1–3. While the first and third rows display the VSI-unstable disks, overlapping with the results shown in Figs. 1 and 2, the second and fourth rows display the α-disk simulations outputs for α = 5 × 10⁻⁴ (see Sect. 2).
From the direct comparison, it is clear that the VSI induces additional fine structure in all velocity fields, while the structures in the α-disk simulations are smoothed by the viscous diffusion. The simulations including α-viscosity show slightly lower velocity magnitudes of the flows localized around the planet, and the super-Keplerian ring at the outer edge of the gap induced by the planet. From the presence of a less depleted gap in the α-disk models, better seen in the Saturn-mass case, it is certain that these differences are the result of the VSI effective turbulent α being slightly smaller than the value set for the α-disk simulations. Due to the difficulty of entirely suppressing VSI motions in an α-disk with a lower α-value in locally isothermal simulations, we concentrate on the morphological differences of the coherent large-scale motions, with potential distinct observational signatures in kinematic CO line observations (see Sect. 5).
Differences between VSI and α-disk simulations are seen in the meridional velocity structure, in which the additional meridional quasi-axisymmetric rings induced by the VSI are present, evident in the midplane and surface of the disk. Moreover, inside the gap carved by the Jupiter-mass planet the VSI-induced turbulence disrupts the meridional flow structure at the surface layers, contrary to the smoother ringed flows along the gap in the viscous case. In the radial direction, the VSI adds additional spiral-like perturbations at Z ≈ 3H, likely from the interaction between VSI-unstable modes and the Lindblad spirals driven by the planets. Here the VSI also disrupts the Lindblad spiral triggered by the Saturn-mass planet, creating arc-like features. Finally, in the azimuthal velocities, the VSI induces additional sub- and super-Keplerian rings at the outer disk surface layers, evident for the Saturn-mass case. In addition, we observe that in the VSI-unstable case the Jupiter-mass planet triggers a strong anti-cyclonic vortex at the outer edge of the gap, also visible in the perturbed gas density. This difference might be caused by the fact that the effective VSI turbulent α is slightly smaller than the assumed value of 5 × 10⁻⁴ for the viscous disk. Additional simulations assuming lower constant α could solve this discrepancy, for which an alternative method to damp the VSI would be required.
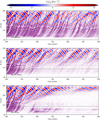 |
Fig. 4 Time evolution of the azimuthally averaged meridional velocity at the disk midplane (Z = 0). Shown (from top to bottom) are the simulations of VSI-turbulent disks without an embedded planet, with an embedded Saturn-mass planet, and with an embedded Jupiter-mass planet. The orbits are measured at the planets’ radial location (100 au), shown by the black dotted lines. The figure x-axis starts at the time at which the planets are inserted in the simulations. |
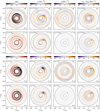 |
Fig. 5 Outputs of VSI-unstable disk and α-viscous disk (α = 5 × 10⁻⁴) simulations with embedded massive planets at the disk midplane (Z = 0). From left to right: gas density normalized by the initial value, radial velocity (υr), meridional velocity (υθ), and azimuthal velocity deviations from Keplerian rotation (υϕ − υKep). From top to bottom: VSI simulation with a Saturn-mass planet (mp = 0.3mJup), α-viscous simulation with a Saturn-mass planet, VSI simulation with a Jupiter-mass planet (mp = mJup), and α-viscous simulation with a Jupiter-mass planet. The black dashed lines in the first panel show the simulation buffer zones. The black dotted lines show the planets’ orbital radius. The white circles show the location of the planets. The diameters of the circles are equal to the planets’ Hill spheres. |
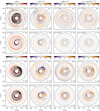 |
Fig. 6 Outputs of VSI-unstable and α-viscous disk (α = 5 × 10⁻⁴) simulations with embedded massive planets at the disk surface (Z ~ 3H). Same as Fig. 5, but for a disk slice 3 pressure scale heights above the disk midplane (Z ~ 3H). |
4 Radiative transfer and simulated observations: methods
4.1 Radiative transfer setup
To produce synthetic images of molecular line emission of our set of hydrodynamical simulations, the outputs were post-processed with the Monte Carlo radiative transfer code radmc-3 d2 (Dullemond et al. 2012) version 2.0. We constructed the RADMC-3D input files from the simulation data following the procedure described in Barraza-Alfaro et al. (2021). The scripts to construct the RADMC-3D input files were partially based on an early version of FARGO2RADMC3D3 (Baruteau et al. 2019), and RADMC3DPY4 (developed by A. Juhasz). The observables explored in this paper are the spatially resolved velocity centroid maps (also denoted as line-of-sight velocity maps), computed from synthetic CO line emission data cubes with good velocity resolution (see Sect. 4.3). We computed the synthetic data cubes for three different CO isotopologues, 12CO, 13CO, and C18O, in order to study the effect of probing different disk layers (see Fig. A.3). In particular, we computed predictions for the J = 3−2 rotational transition observable within ALMA Band 7.
Our selection is motivated by the better spectral resolution available in Band 7 than for the J = 2−1 transition (within Band 6); therefore, this is better suited for characterizing the velocity structure in kinematic observations. Nonetheless, predictions for the J = 2−1 transition result in an equivalent outcome (see Barraza-Alfaro et al. 2021).
As mentioned above, we used a similar model setup to that presented in Barraza-Alfaro et al. (2021) to use the outputs of the simulations as inputs into the radiative transfer code. We re-scaled the simulation output radial grid to R0 = 100 au (i.e., one code unit is re-scaled to 100 au), and assumed a 1 M⊙ central star. We volume-averaged the simulation data onto a coarser grid, halving the grid resolution in each direction to speed up the radiative transfer calculations. We also extended our disk, including an inner disk that follows the equilibrium solution used as the initial condition in the simulation, which goes from 10 au to the simulation grid’s inner edge of 40 au. Therefore, our full disk radiative transfer model extends from 10 to 250 au. Additionally, we removed the cells adjacent to the grid edges in colatitude to prevent tracing the grid cells affected by boundary conditions. However, for the assumed gas density of the model, in which the total gas mass of the disk in molecular hydrogen is 0.05 M⊙, the layers traced by the explored CO isotopologues are unlikely to be affected by the dynamics close to the boundaries in θ, as shown in Fig. A.3.
The disk temperature is computed via dust thermal Monte Carlo radiative transfer. It is assumed that gas and dust have the same temperature. Since our hydrodynamical simulations only treat the gas dynamics, the dust is included manually adopting a gas-to-dust mass ratio of 100 through the disk. The dust is composed of a mixture of astrosilicates, amorphous carbon, and vacuum inclusions. The optical constant of the mixture was calculated using OPTOOL5 (Dominik et al. 2021), applying the Bruggeman mixing formula and Mie theory to compute the dust opacities (Bohren & Huffman 1983; see, e.g., Baruteau et al. 2019 and Barraza-Alfaro et al. 2021). The computed opacities have a resulting dust intrinsic density of 2.0 g cm−3 (see further details in Brown-Sevilla et al. 2021). We adopted a highly simplified dust structure in order to speed up the calculations by assuming only one representative dust size bin for grain sizes between 0.01 µm and 10 µm, following the same distribution as the gas. Our results are not significantly affected by these assumptions since small grains dominate the resulting temperature structure, and we do not include dust in the image ray-tracing.
For the calculations we assume that the central star radiates as a perfect blackbody with an effective temperature of T★ = 7000 K and a radius of R★ = 1 R⊙. We use 109 photon packages to compute the dust temperature via thermal Monte Carlo radiative transfer including absorption and scattering opacities (assuming Henyey-Greenstein anisotropic scattering), while 108 photon packages are used for the image ray-tracing. For all the presented images, we assume a distance to the source of 100 pc.
For the molecular abundances, a constant fraction of 12CO relative to H2 of 1 × 10⁻⁴ is assumed for the entire disk, while for 13CO and C18O the 12CO abundance is scaled by ~ 77−1 and ~ 560−1 (see Sect. 3.1 in Barraza-Alfaro et al. 2021). The line emission is computed assuming local thermodynamic equilibrium (LTE), using molecular data from the LAMDA6 database (Schöier et al. 2005). Variations of CO abundance from photodissociation are not included in our models, while a simplified CO freeze-out is included by reducing the CO abundance by a factor of 10−5 in cold regions (T ≤ 21 K). The synthetic data cubes are computed with a fine velocity resolution of 10 m s−1. Then the channels are averaged to obtain data cubes with a coarser resolution, matching a velocity resolution of 100 m s−1, observable with ALMA. This procedure mimics telescope limitations without the need to include artificial micro-turbulence in the radiative transfer model. Images of an individual raw (without spatial convolution) 12CO channel map for the different models are presented in Fig. A.4, while a view of all channels is included as supplementary material. The synthetic data cubes are used to simulate ALMA observations.
A summary of the parameters used in the radiative transfer predictions is compiled in Table 2.
Summary of the parameters used in the radiative transfer predictions.
4.2 Simulated observations
To predict how the synthetic images of our models would appear in an interferometric ALMA observation, we simulated mock observations with the Common Astronomy Software Applications package (CASA7 version 6.4; McMullin et al. 2007). The simulated observations were computed in three steps: simulation of the observed visibilities, inclusion of noise, and cleaning of the dirty image. First, we used the task simobserve to simulate the observed visibilities using our raw synthetic data cubes as input images. The uv-coverage was computed for a combination of two antenna configurations, one extended (C-7, with longest baselines of 3.6 km) and one compact (C-4, with longest baselines of 784 m). The adopted antenna configuration is similar to the configuration of the large program MAPS (e.g., Öberg et al. 2021); however, for ALMA Band 7, this results in a spatial resolution of 84 × 62 mas (8.4 × 6.2 au). The simulated visibilities consider an integration time on the compact configuration that is 25% of the extended configuration (10h and 2.5h, respectively). The combination of two different antenna configurations covered both short and long baselines in order to recover information from large and small spatial scales, respectively. Relatively long on-source integration times were used in the set of simulated observations because it was necessary to have good uv-coverage, crucial for a final image with the fidelity to extract the kinematic information. Furthermore, such long a integration was also needed due to the difficulty of getting fairly good signal-to-noise ratio in high-resolution (spatial and spectral) CO observations. Second, we used the task SM.CORRUPT() (simulator.corrupt) to corrupt the simulated data, adding errors in the visibilities. We included errors with an rms of 1 mJy beam−1 per channel corresponding to our assumed long integration times, calculated with the ALMA sensitivity calculator.8 These noise calculations assumed particular atmospheric conditions that significantly affect the time required to reach a particular sensitivity. Third, we applied CASA tclean to reconstruct the image from the modeled dirty image visibilities, following the CLEAN algorithm. In this process we used the multi-scale mode and a Briggs weighting scheme. Moreover, the cleaning was performed using noninter-active automasking (auto-multithresh; Kepley et al. 2020), which automatically generated the masks used during the process. This automatic masking was possible due to the known morphology of the emission from the radiative transfer models; however, in real observations masking the image manually is still recommended. As a final product, a cleaned spectral cube with the expected artifacts from a real ALMA observation is obtained. Further details on our method to simulate ALMA observations are presented in Sect. 5.2.
4.3 Kinematic analysis tools
The kinematic signatures of the simulated observations are extracted in two steps. First, the line-of-sight velocity map is computed from the data cube. Second, the best-fit Keplerian model to the line-of-sight velocity map is determined. This is then subtracted from the original velocity map to reveal coherent non-Keplerian gas flows. For the first step, we computed velocity centroid maps (υ0) from the data cubes using a Gaussian function to fit the CO line emission in each pixel of the collapsed image. For this we used the publicly available Python package BETTER-MOMENTS9 (Teague & Foreman-Mackey 2018; Teague 2019b). This package robustly computes the centroid maps of spectral line data for a variety of methods, and their respective statistical uncertainties. A Gaussian function was chosen as it gives the best results for our particular set of synthetic models. We extracted the disk velocity perturbations from the map of velocities projected into the line of sight. For this purpose we use the Extracting Disk DYnamics Python suite EDDY10 (Teague 2019a) to obtain the best-fitting Keplerian disk model for the 12CO(3–2) velocity centroid maps of the simulated ALMA observations.
We used a model that assumes a geometrically thick disk with an elevated emission surface, in which the emitting surface is parameterized as
![Mathematical equation: $z(r) = {z_0} \times {\left( {{R \over {{1^{\prime \prime }}}}} \right)^\psi } \times \exp \left( { - {{\left[ {{R \over {{R_{{\rm{taper }}}}}}} \right]}^{{q_{{\rm{taper }}}}}}} \right)$](/articles/aa/full_html/2024/03/aa47726-23/aa47726-23-eq6.png) (6)
(6)
where R is the disk cylindrical radius in arcseconds, ψ dictates the flaring of the emission surface, and z0 and Rtaper are the reference disk aspect ratio at 1 arcsecond and the exponential taper reference radius in arcseconds. However, for our fitting we assumed the limit Rtaper = ∞, which better fits our disk models, and we also reduced the number of free parameters.
For the fitting of the disk rotation, we assume that the rotation curve follows a Keplerian profile accounting for the altitude of the emission height:
 (7)
(7)
Here Mstar is the mass of the central star. In this case the cylindrical radius R and the emission surface height z are in meters, adapted using the distance to the source in our model of 100 pc. In the following the disk velocity model is projected into the line of sight only considering the contribution of the azimuthal velocity component:
 (8)
(8)
where ϕ is the polar angle of the image pixel (measured east of north relative to the redshifted major axis) and υLSR is the systemic velocity, set to zero in our models.
For the fitting procedure, we fixed the disk inclination to the input model inclination and the distance to the system to 100 pc, and considered as free parameters Mstar, disk PA, z0, ψ, υLSR, x0, and y0. Then a series of MCMC chains were run to find the best-fit parameters of the geometrically thick Keplerian disk model. For this paper we used 128 walkers that take 2000 burn-in steps and 500 additional steps to sample the posterior distributions for the model parameters. A delimited radial region of the disk was considered in the model fitting, set to [0.55,2.0], [0.58,1.85], and [0.6,1.7] arcseconds for inclinations of 5, 15 and, 30 degrees, respectively. Finally, the velocity perturbations were extracted by subtracting the velocity centroid map of the best-fit disk model (vmod) from the original (v0).
An alternative way to look at the disk kinematic structure is to obtain an azimuthally averaged view of the disk velocities (radial profiles); however, in this paper we only studied the two-dimensional view of the deviations from Keplerian rotation. In principle, the axis-symmetry of the VSI flows could be exploited with this approach, while also boosting the signal-to-noise ratio of the simulated observations, reaching higher precision in velocity. Unfortunately, a degeneracy between the flows produced by the VSI and a massive planet might be faced when exploring the radial velocity profiles of the upper 12CO(3−2) emission layer only, as suggested by our simulations (see Fig. A.2). Moreover, the extraction of the radial profiles is extremely sensitive to systematic errors and more computationally expensive. Nevertheless, looking at the velocity radial profiles has enormous potential to unravel VSI motions by allowing further exploration of flow correlations among velocity components for both disk layers (see Sect. 6).
Finally, we highlight that alternative tools to BETTERMOMENTS and EDDY are also available, such as GMoments11 (Casassus & Pérez 2019) and Discminer (Izquierdo et al. 2021, 2022). Differences between methods can be found in terms of the flexibility of the models, specific features, and varying performance for particular targets (see, e.g., Disk Dynamics Collaboration 2020).
5 Radiative transfer and simulated observations: results
5.1 Kinematic signatures: an idealistic view
First, we analyze the kinematic signatures of our disk models in an idealistic case for images without beam convolution and noise, and with a velocity resolution of 5 m s−1. We first study this case in order to have a reference of what would be extracted from our disk model synthetic predictions in an ideal case of unrealistically deep observations and perfect modeling. For this purpose, we extract the deviations from Keplerian rotation in the line-of-sight velocity maps computed from our raw synthetic radiative transfer images. In order to extract these deviations in the perturbed disk maps, we subtract a second line-of-sight velocity map computed for a disk model following the equilibrium solution used as the initial condition of the simulations. To avoid effects from variations in the traced CO emission layer in the residuals, we only change the model velocities to the equilibrium solutions keeping the same CO number densities and disk temperature structure as the perturbed case. Evidently, this approach is not feasible to apply in real observations; however, as we mention above, it is presented as an ideal picture of the non-Keplerian signatures. We present the 12CO(3−2) predictions for our set of simulations in Fig. 7, for three different disk inclinations (5, 15, and 30 degrees). On top of the 2D map residuals from Keplerian rotation a line tracing υ0 = 0 is overlaid, indicating the approximate location of the semi-minor axis and tracing the magnitudes of the distortions created by the non-Keplerian motions in the line-of-sight velocity at the systemic velocity. Again, the disk is oriented in the sky such that its rotation is clockwise and the near side is at the northeast.
In the first column of Fig. 7 we present the kinematic signatures of our VSI-unstable disk model without an embedded planet, showing ring-like residuals tracing the meridional flows produced by the VSI-unstable modes, recovering the results presented in Barraza-Alfaro et al. (2021). In the second and third columns we show the cases with a Saturn-mass planet embedded in a VSI-unstable disk and in an α-viscous disk, respectively. We observe that the signatures from the VSI are not seen along the region affected by the planet-induced damping (as discussed in Sect. 3), while signatures from the VSI are still visible in the outermost parts of the disk. These signatures are mixed with signatures of the spiral driven by the planet via Lindblad resonances, breaking the axisymmetry of the VSI kinematic signatures. The Saturn-mass planet in the α-viscous disk produces smooth signatures of the Lindblad spirals and spiral wakes around the planet, with weak velocity magnitudes overall. In columns four and five we show the cases with an embedded planet with the mass of Jupiter for our VSI-unstable disk and an α-viscous disk, respectively. In these scenarios, the massive planet produces a strong signature at its location. This feature is known as the “Doppler flip” (see, e.g., Disk Dynamics Collaboration 2020) and has a significant contribution from the planet’s spiral wakes. The planetary spiral wakes produce a super-Keplerian feature outside the planet’s radius and a sub-Keplerian feature inside the planet’s radius; consequently, creating a dipole pattern. Additional kinematic signatures are introduced by the planets’ inner and outer Lindblad spirals, and the sub- and super-Keplerian rings of gas along the gap and gap edges. Similar to the case for the Saturn-mass planet, for the VSI-unstable disk additional kinematic features are seen in the outermost regions of the disk, in interplay with the planetary spiral arms, which gives a complex kinematic structure with arcs and spiral-like non-Keplerian flows. From the comparison of the different models varying disk inclination (see Fig. 7), we find that the disk inclination can considerably impact the extracted kinematic signatures. As the disk inclination is increased the planet-driven kinematic signatures are more prominent, while the velocity magnitude of the VSI signatures remains fairly constant. These results are expected since the perturbations in the gas velocity of the disk produced by the planet are strongest in the radial and azimuthal directions, which contribute more to the velocity projected into the line of sight for higher disk inclinations.
We also explored the dependence kinematic signatures on the traced disk height by computing the ideal view of the deviations from Keplerian for our 13CO(3−2) and C180(3−2) predictions, presented in Figs. A.5 and A.6, respectively. Moving from the most abundant tracer (12CO) to the less abundant (C18O), deeper layers of the disk are probed, in which the change in the morphology of the kinematic structure for different CO isotopologues strongly depends on the disk inclination. In the case of the VSI-unstable disk without embedded planets, the morphology of the non-Keplerian signatures remains fairly consistent for different CO isotopologues, as previously shown in Barraza-Alfaro et al. (2021). On the contrary, clear changes could be seen among the residuals for the three different CO isotopologues for the models including a massive planet perturbing the disk. For low disk inclinations, we observe that for less abundant tracers, the planetary-induced non-Keplerian flows are weaker, isolating the VSI operating in the outermost regions of the disk, but with lower velocity magnitudes compared to the 12CO(3−2) predictions. In addition, the contribution of the Lindblad spirals to the Keplerian model residuals weakens for less abundant tracers independent of disk inclination. For a disk inclination of 30° the Doppler flip at the planet location and the super-Keplerian ring at the gap’s outer edge remain prominent independent of CO tracer, particularly in the Jupiter case. These features could be explained by the planetary spiral wakes being the strongest dynamical feature at the disk midplane layers, with vigorous azimuthal and radial flows. Similarly, the planet-induced super-Keplerian ring of gas is fairly independent of disk height (see Fig. 3). In contrast, VSI flows reach higher velocities at the disk’s upper layers, and have a dominant meridional velocity (see Sect. 3).
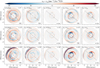 |
Fig. 7 Deviations from Keplerian rotation for the raw 12CO(3−2) synthetic predictions of our post-processed simulations. From left to right: VSI-unstable disk without a planet, VSI-unstable disk with a Saturn-mass planet, α-viscous disk with a Saturn-mass planet, VSI-unstable disk with a Jupiter-mass planet, α-viscous disk with a Jupiter-mass planet. From top to bottom: predictions for different disk inclinations (i = [5°, 15°, 30°]). The approximate locations of the planets are indicated by black circles with a size of the planets’ Hill sphere. |
5.2 Kinematic signatures: ALMA simulated observations
In order to study the more realistic picture of the kinematic signatures that could be observed in VSI-unstable planet-forming disks, we produced simulated ALMA observations for our three VSI-unstable disk models. In Fig. 8, we show the deviations from Keplerian rotation extracted from mock observations of 12CO(3−2) using EDDY (see Sect. 4.3), for three different disk inclinations (i = [5°, 15°, and 30°]). As described in Sect. 4.2, the simulated observations are performed for a combination of ALMA configurations 7 and 4, with a resulting spatial resolution of 84 × 62 mas (8.4 × 6.2 au). In terms of spectral resolution, the simulated observations are produced for a velocity resolution of 100 m s−1, and a noise level with an rms of 1 mJy beam−1 per channel. These predictions are optimistic and follow the ideal design for kinematic detection of embedded planets (Disk Dynamics Collaboration 2020; Pinte et al. 2023). While we assume an integration time that gives excellent uv-coverage, to reach the assumed noise levels longer integration times would be needed; for example, at 345 GHz (approximated frequency of the J = 3−2 transition of 12CO), for a column density of water vapor of ≈ 0.9 mm, this observation would take approximately 40 h on-source. Nevertheless, these ambitious observations are the goal of the community studying the kinematic structure of protoplanetary disks, which are needed to fully resolve the substructures in the disk gas velocities.
The model residuals presented in Fig. 8 show that the deviations from Keplerian rotation induced by the VSI would be observed with clarity only in the case without embedded planets (first column). Arcs of vSl-induced red- and blueshifted gas are also seen in the outermost regions of the Saturn-mass planet case for disk inclinations of 5° and 15°; however, their velocity magnitude is weaker due to the global damping of the VSI induced by the planet, as discussed in Sect. 3.1. For the highest inclination explored, spiral-like signatures would be observed mixed with VSI arc-like residuals in the outer disk, which would be difficult to differentiate, for example, from signatures of spiral arms triggered by buoyancy resonances (Bae et al. 2021). Nevertheless, we discuss a potential approach to disentangling VSI signatures in Sect. 6. In the case of an embedded Jupiter-mass planet, the planet-induced kinematic signatures stand out in the Keplerian model residuals. Important features are a Doppler flip around the planet and large-scale Lindblad spirals. Unlike the ideal case, super- and sub-Keplerian signatures at the gap edges are weaker, possibly due to the missing modeling of the drop in the emission surface height at the gap region. In addition, global patterns in the residuals appear due to errors in the model, demonstrating that even with tightly constrained initial values for the free parameters, the fitting can drive errors due to the limitations of the disk model. In particular, a quadrupole pattern is seen in the residual maps near the central region, due to errors in the model center. This set of simulated ALMA observations suggests that VSI signatures would be easy to identify only in disk regions unperturbed by fairly massive planets, limiting the chances of robust detection of VSI. Our results also indicate that VSI-turbulent gas motions would not prevent the detection of a Jupiter-mass planet in resolved gas kinematic observations. Finally, the signatures from a VSI-unstable disk with an embedded Saturn-mass planet would be difficult to observe with the current ALMA capabilities and challenging to interpret, so further analysis and observations might be required.
Additional substructures could be extracted by exploiting the information of the line profiles, which combined with the line-of-sight velocity maps could potentially disentangle the scenarios. Variations in the line intensity peak and width relative to the disk background could trace deviations of the gas temperature and density for optically thick tracers, possibly tracing spiral arms and gaps produced by embedded planets (e.g., Bae et al. 2021; Izquierdo et al. 2021, 2022). In the case of line peak intensity maps of 12CO, our set of simulations is not suitable to explore variations on the temperature structure self-consistently, where 3D global simulations including radiative effects are required (e.g., Bae et al. 2021). In preliminary tests using the temperature structure provided by the thermal Monte Carlo calculations, we obtain spiral-like features, mostly tracing the planet gap region and Lindblad spirals. However, these variations reach values below 1% relative to the disk background, while in recent observations relative variations up to 5% are found (Teague et al. 2019b, 2021). Therefore, additional simulations of embedded planets in turbulent protoplanetary disks including radiation-hydrodynamics are needed to robustly explore this observable, and connect it to velocity deviations from Keplerian rotation.
In an exploration of line width maps of 12CO(3−2), we find that variations in this quantity relative to the disk background can trace the planet’s gap, and that nonthermal broadening effects are most prominent around the planet’s location, consistent with previous studies (e.g., Izquierdo et al. 2021). Moreover, in the residual maps, asymmetries appear inside the gap region for the Jupiter-mass case, also in agreement with previous findings (e.g., Dong et al. 2019; Izquierdo et al. 2021, 2022). VSI-turbulent motions, however, produce arc-like features in the line width maps residuals. These variations are relatively small, reaching values of a few tens of m s-1, challenging to extract and interpret (e.g., Teague et al. 2022). These small line width residuals are consistent with the negligible nonturbulent broadening found in Barraza-Alfaro et al. (2021) for integrated line profiles. In our line width maps, artifacts from the influence of the back side of the disk when using single-Gaussian fits are seen. Fitting both CO layers (front and back surfaces) is required to overcome these effects (e.g., Izquierdo et al. 2022; Casassus & Pérez 2019, see also Sects. 6 and 6.2). Careful self-consistent analysis of variations in the peak and width of the CO line will be provided in follow-up studies.
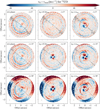 |
Fig. 8 Deviations from Keplerian rotation for 12CO(3−2) ALMA simulated observations. From left to right: VSI-unstable disk without a planet, VSI-unstable disk with a Saturn-mass planet, and VSI-unstable disk with a Jupiter-mass planet. From top to bottom: predictions for different disk inclinations (i = [5°, 15°, 30°]). The approximated location of the planets is indicated by black circles with the size of the planet’s Hill radius. The gray solid lines indicate the zero velocity contour in the line-of-sight velocity maps. The disk is oriented so that its rotation in the sky is clockwise. The synthesized beam of 84 × 62 mas is shown in the bottom left corner of each panel. The data cubes have a velocity resolution of 100 m s−1, with an rms of 1 mJy beam−1 per channel. In all images the regions of low S/N have been clipped. |
6 Discussion
6.1 Possibility of confirming VSI as the origin of kinematic signatures
To distinguish VSI kinematic signatures from signatures of other mechanisms could be extremely challenging, due to the possible resemblance of their imprints (see Sect. 4.2 in Barraza-Alfaro et al. 2021). Moreover, there are physical processes whose simulations suggest that they could induce similar structures to VSI; however, observational predictions of the CO kinematics of these processes are still lacking. That is the case, for example, for magnetically driven winds (e.g., Hu et al. 2022). Therefore, we face the question of whether we can robustly conclude that VSI is operating in the disk if we observe a kinematic structure that matches the expected signature from VSI.
A robust VSI confirmation might be possible by exploiting the information from both disk hemispheres, and invoking the symmetry of VSI flows relative to the midplane layer. As mentioned in Sect. 3.1 (see also Bae et al. 2021), flows induced by the VSI have a unique property. With respect to the midplane the VSI flows are anti-symmetric in the meridional direction, and symmetric in the radial and azimuthal directions. Luckily, it is possible to explore this feature by extracting the kinematic information of both disk hemispheres using observations of CO isotopologues, in which two emitting layers are observed separated by the colder midplane region (see, e.g., channel maps of the HD 163296 disk presented in Pinte et al. 2018).
Currently, great efforts are being made to develop techniques to extract both emission CO layers, the front (or upper) and the back (or bottom) surfaces. By fitting a double-Gaussian profile to the collapsed molecular line data at each pixel, the front and back layers have been successfully extracted in the disks HD 135344B (Casassus et al. 2021) and HD 163296 (Izquierdo et al. 2022). However, deeper and higher resolution observations are needed to precisely disentangle the two surfaces, which is crucial for the kinematic analysis and study of the spatially resolved non-Keplerian flows.
In order to demonstrate the possibility of exploiting the VSI symmetry relative to the disk midplane, we ran two models that only take into account one hemisphere of the disk at a time. That is, a model with only the upper hemisphere and a model with only the bottom hemisphere. By computing the expected deviations from Keplerian rotation for raw 13CO(3-2) synthetic images of each disk hemisphere, we can compare the front and back 13CO layer residuals, shown in Fig. 9 for a disk inclination of 30°. Under the assumption that we could extract a resolved view of the back CO layer and a good fit of the emission surfaces, VSI quasi-axisymmetric rings of positive and negative residuals are recovered in both 13CO emitting layers, front and back. Again, the residuals are dominated by the meridional velocity component, as expected from VSI; therefore, these maps can be interpreted as the column of gas moving in the same vertical direction on both disk hemispheres, a unique feature of VSI. This symmetry is better seen in a deprojected view of the residual maps, displayed in the bottom row of Fig. 9 (deprojected using DISKMAP12; Stolker et al. 2016). Additional modulations are seen at the east and west from the disk semi-minor axis for the front and back sides, respectively, coming from azimuthal velocity perturbations moving in opposite directions (i.e., super-Keplerian on one disk hemisphere and sub-Keplerian in the other hemisphere, shown in Figs. 3 and A.2).
A visualization of the meridional flows moving toward the same direction is shown in a coherence map13 (last panel of Fig. 9). We define the coherence of the deprojected line-of-sight velocities from the upper and bottom layers as
 (9)
(9)
where  and
and  are the deprojected line-of-sight velocities of the upper and bottom layers, respectively. The coherence map shown in Fig. 9 displays the normalized coherence, where rings of positive values reveal coherence of the vertical flow. Particularly clear coherence is seen in the ring of interest enclosed by the black dashed lines, with both sides moving away from the observer. When compared to the cases of VSI-unstable disks with embedded massive planets (shown in Figs. A.7 and A.8), we observe that VSI quasi-axisymmetric rings of positive coherence are only present in the outermost regions of the disks with planets, once again demonstrating the planet-induced damping of the VSI. Moreover, such a coherence map also highlights the perturbations induced by the Jupiter-mass planet around its location (last panel of Fig. A.8), with a potential use to point toward localized massive planet signatures.
Nevertheless, exploiting both CO emission layers of the planet-forming disk is extremely challenging. In addition to the high resolution required, millimeter-sized dust grains at the disk midplane can block parts of the emission from the back side layer, complicating its study even more. Despite our simplifications, it has been demonstrated that exploring both hemispheres of the disk in CO kinematic observations is possible. Thus, future deep high-resolution molecular line observations can confirm the symmetry of the VSI flows with respect to the midplane, robust proof of the VSI operating in planet-forming disks.
Current studies show that meridional flows induced by alternative mechanisms are directly correlated to the formation of a deep gap in the gas. Therefore, the gas would flow from the disk surface toward the gas-depleted region. This correlation is not typical for VSI signatures. As seen in Fig. 3, the direction of the meridional flows is not tightly correlated with the density perturbations. Thus, quasi-axisymmetric meridional flows in a region without deep gaps in the gas would be consistent with VSI-induced kinematic signatures. Finally, in the opposite case, where deep gaps in the gas are correlated with the meridional flows, VSI would unlikely to be the origin; massive planets or nonideal magneto-hydrodynamical effects are favored.
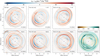 |
Fig. 9 Deviations from Keplerian rotation for 13CO(3−2) synthetic images of the post-processed simulations, for a VSI-unstable disk without embedded planets. In the first row, from left to right, we show models including the full disk, only the disk hemisphere closest to the observer (front side), and the farthest hemisphere of the disk (back side), for a disk inclination of 30 degrees. In the second row, a deprojected view of the residual maps (first row) is shown. The fourth panel, shows a normalized square root of the absolute value of the product of the front and back side deprojected residual maps, multiplied the sign of the initial multiplication of both residuals (see Eq. (9)). A ring of interest is enclosed by black dashed lines, drawn at 1.55 and 1.85 arcsec. The black solid line along the semi-minor axis in the non-Keplerian residuals shows the line of zero gas velocity projected into the line of sight. |
6.2 Caveats
In the following, we discuss the limitations of our approach.
First, the assumption of a locally isothermal equation of state in our hydrodynamical simulations is certainly a simplification. Under the assumption of a fast-cooling disk (cooling timescales substantially shorter than the local orbital timescale), which is needed for the VSI to operate, this is still a valid approximation. However, the locally isothermal approach, which translates to instantaneous cooling (tcool=0), is an extreme limit, which leads to vigorous VSI (e.g., Flores-Rivera et al. 2020; Cui & Bai 2022). Even in rapidly cooling disks (e.g., tcool ~ 0.01torb), the VSI will be slightly damped compared to a locally isothermal disk (Manger et al. 2021). Nevertheless, simulations relaxing the isothermal assumption for fast-cooling disks lead to similar VSI gas dynamics (e.g., Stoll & Kley 2014; Flock et al. 2017) and planet–disk interactions (Ziampras et al. 2023) to those obtained in our simulations. On the other hand, simulations including regions with long cooling timescales, which do not fulfill the requirements for the VSI to operate, will result in a confined VSI-active layer (Pfeil & Klahr 2021; Fukuhara et al. 2023) or almost complete suppression of the VSI, directly affecting the observability of VSI-signatures in gas kinematics. The cooling properties of the disk, and thus the ability of the disk to sustain VSI, is primarily regulated by the amount and properties of small dust grains in the disk (Malygin et al. 2017). Conditions of inefficient cooling in the outer disk can originate from infrequent dust and gas collisions near the disk atmosphere (e.g., Pfeil & Klahr 2021; Bae et al. 2021), and/or an overall reduced dust-to-gas ratio of the small dust grains as a result of dust evolution (Lin & Youdin 2015; Fukuhara et al. 2021; Dullemond et al. 2022; Pfeil et al. 2023). Including regions with longer cooling times would also lead to additional planet-induced signatures from spirals generated via buoyancy resonances (Bae et al. 2021).
Second, the assumed thermal structure of the disk in the hydrodynamical simulations is not consistent with the theoretical predictions nor the observed structure from recent ALMA observations, in which a vertical gradient of the temperature is constrained. This structure can modify the development of the VSI and planet-driven structures. Nevertheless, previous work has shown, in simulations including both the disk thermal structure and radiation-hydrodynamics, that the VSI still operates vigorously in the fast-cooling regions of the disk (Flock et al. 2020). An additional set of simulations including planets in a VSI-unstable disks with a vertical temperature structure still has to be performed.
Third, our radiative transfer models assume constant n(CO)/n(H2) throughout the disk. This assumption is likely not to hold if the influence of VSI and planet-driven large-scale flows on the disk chemistry is taken into account. The mixing of material in the radial and vertical directions would modify the spatial distribution of molecules, and therefore would change the emitting surface and abundance radial profiles of CO isotopologues (e.g., Semenov et al. 2006; Semenov & Wiebe 2011). Moreover, a planet-carved gap can significantly affect the density and thermal structure of the disk, altering the abundance of CO isotopologues around the gap location. It is important to include these thermo-chemical effects in future studies as they would impact the observability of kinematic signatures in the circumstellar disk.
Finally, in our work, a single Gaussian function is used to extract the information from the simulated ALMA observations. This approach could result in a line fitting merging information from the back and front emitting layers of CO, producing a velocity structure that does not fully reflect the disk gas dynamics. These effects are relevant for disks with intermediate inclinations, predominant in regions with lower gas densities (e.g., planet-carved gaps), while minimal along the disk semi-major and semi-minor axes. In our models the obtained morphology of the velocity residuals from Keplerian rotation reflects the expected morphology from the front CO layer, as shown in Fig. 9. The implementation of routines to fit both emission layers at the same time is ideal for extracting the true velocity structures from the disk (e.g., Casassus & Pérez 2019; Casassus et al. 2021; Izquierdo et al. 2021, 2022). Moreover, as discussed in Sect. 6.1, such an approach could help to disentangle VSI signatures from planet-induced signatures. Exploring the effects of applying an improved line fitting procedure in our models is left for follow-up work.
7 Summary and conclusions
In this paper we presented a comprehensive study of the gas dynamics and kinematic signatures of planet-forming disks unstable to the vertical shear instability (VSI). In particular we explored the interplay between the VSI and structures induced by an embedded massive and their resulting signatures observable in CO rotational line observations with ALMA. We performed this study by running global 3D hydrodynamical simulations, post-processed with radiative transfer calculations, to finally simulate mock ALMA observations. Specifically, we studied the effects on the disk dynamical structure of single planets with the mass of Saturn or Jupiter, and their imprints on the observable deviations from Keplerian rotation.
We found that the presence of fairly massive planets embedded in the disk substantially affects the gas velocity structure produced by the VSI, damping the VSI-unstable modes in the regions where the planets significantly modify the structure of the disk. Further, the damping is made stronger by increasing the planet’s mass, and is most effective in a region near the midplane layer of the disk.
The effect of the planets on the VSI motions significantly alters the kinematic signatures. The observable kinematic signatures of the VSI are globally weakened, and are only clearly visible tens of au radially outward from the planets’ location. The VSI adds fine structure to the planet-induced kinematic signatures, with a complex interplay in the Saturn-mass case. For the case of an embedded Jupiter-mass planet, the planet-induced signatures dominate the kinematic structure of the disk, showing a clear Doppler flip at the planet’s location and spiral arms in the residuals from a Keplerian model.
Furthermore, we compared simulations of VSI-unstable disk and simulations following a constant α-viscosity prescription. This direct comparison highlights the predictions of the additional kinematic signatures produced by the VSI compared to the standard α-viscous case. The more complex kinematic structure, found for the Saturn-mass planet case, showing a mixture of VSI modes and planet-induced spirals, might impede the identification of the planet and VSI in ALMA observations. Thus, simultaneous modeling of different CO isotopologues might be needed for robust planet detection, where the best strategy for isolating the planet signatures is to observe closer to the midplane of moderately inclined disks.
Finally, we tested an approach to confirm the presence of VSI motions in future high-resolution ALMA observations by detecting the coherence of the perturbations with respect to the disk midplane. This approach is promising for revealing the VSI operating in disks.
We conclude that the best chance to detect clear VSI signatures is to look for disk regions distant from observed deep continuum or molecular gas gaps, where the VSI-induced perturbations might still be active far from the influence of putative massive planets. In addition, exploring the flows’ symmetries with respect to the disk midplane is a pathway to confirm VSI signatures in future CO rotational line observations.
We highlight the potential of directly comparing deep ALMA CO observations with theoretical predictions of kinematic signatures. Robust interpretations could reveal the presence of embedded massive planets and signatures of disk instabilities, and could constrain disk physical properties. In the near future upgrades planned for the ALMA interferometer infrastructure (ALMA2030; Carpenter et al. 2023) will significantly increase the sensitivity for line emission observations. This technological advance will allow a deeper study of planet-forming disks kinematics, revealing the fine structure of gas flows, probing regions closer to the disk midplane, and possibly resolving the circumplanetary region of embedded massive planets, and thus potentially revealing a comprehensive picture of planet–disk interactions in turbulent protoplanetary disks.
Movies
Movie 1 associated with Fig. A4. Access Supplementary Material
Acknowledgements
We thank the anonymous referee for providing constructive comments on the manuscript. We thank the developers and contributors of the codes and software used throughout this work, including the developers of the Python packages NUMPY (Harris et al. 2020), SCIPY (Virtanen et al. 2020), ASTROPY (Astropy Collaboration 2013) and MATPLOTLIB (Hunter 2007). M.B. thanks R. Teague and L. Flores-Rivera for providing constructive feedback on figures, and S. Andrews and N. Kurtovic for their advice in the use of CASA tclean. M.B. thanks the exoALMA collaboration for fruitful discussions on protoplanetary disk kinematics. M.B. and M.F. acknowledge support from the European Research Council (ERC), under the European Union’s Horizon 2020 research and innovation program (grant agreement No. 757957). T.H. acknowledges support from the European Research Council under the Horizon 2020 Framework Program via the ERC Advanced Grant Origins 83 24 28. The set of numerical simulations presented was conducted on the COBRA supercomputer, hosted by the Max Planck Computing and Data Facility (MPCDF).
Appendix A Additional figures
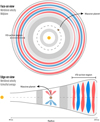 |
Fig. A.1 Schematic of the expected meridional velocity (υθ) from a VSI-unstable disk with an embedded massive planet. Top: Face-on view, red (blue) indicates gas moving toward (away from) the disk midplane. Bottom: Edge-on view (radius vs. height) of the azimuthally averaged prediction, red (blue) indicates gas moving downward (upward); gray indicates the gas density. |
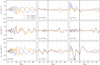 |
Fig. A.2 Velocity radial profiles for the VSI-unstable disk simulations without a planet (first column), with an embedded Saturn-mass planet (second column), and with an embedded Jupiter-mass planet (third column). The values displayed correspond to 3 pressure scale heights from the disk midplane for both disk hemispheres, shown by the blue dashed and orange solid lines. The radial location of the planets is indicated with a vertical black solid line. |
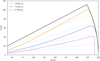 |
Fig. A.3 Radial profiles of the surfaces in which the optical depth (τ) reaches one for the J = 3 − 2 transition of 12CO, 12CO and C18O. The gray dashed lines indicate Z = γR for γ =0.1,0.2,0.3 and 0.4. The black solid lines indicate the simulation’s grid edges (Z = 0.5R and r = 250 au). |
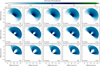 |
Fig. A.4 Velocity channel maps for the synthetic 12CO(3−2) emission line maps. From left to right: VSI-unstable disk without a planet, VSI-unstable disk with a Saturn-mass planet, α-viscous disk with a Saturn-mass planet, VSI-unstable disk with a Jupiter-mass planet, and α-viscous disk with a Jupiter-mass planet. From top to bottom: Predictions for different disk inclinations are presented (i = [5°, 15°, 30°]). The α-viscous models are run for a = 5 × 10⁻⁴. The approximated location of the planets is indicated with black circles, of the size of the planet’s Hill spheres. Displayed are channels that overlap with the location of the planets. A short movie of all the velocity channel maps is available online. |
References
- Andrews, S. M., Huang, J., Pérez, L. M., et al. 2018, ApJ, 869, L41 [NASA ADS] [CrossRef] [Google Scholar]
- Asensio-Torres, R., Henning, T., Cantalloube, F., et al. 2021, A&A, 652, A101 [NASA ADS] [CrossRef] [EDP Sciences] [Google Scholar]
- Astropy Collaboration (Robitaille, T. P., et al.) 2013, A&A, 558, A33 [NASA ADS] [CrossRef] [EDP Sciences] [Google Scholar]
- Bae, J., & Zhu, Z. 2018a, ApJ, 859, 118 [Google Scholar]
- Bae, J., & Zhu, Z. 2018b, ApJ, 859, 119 [Google Scholar]
- Bae, J., Zhu, Z., Baruteau, C., et al. 2019, ApJ, 884, L41 [NASA ADS] [CrossRef] [Google Scholar]
- Bae, J., Teague, R., & Zhu, Z. 2021, ApJ, 912, 56 [NASA ADS] [CrossRef] [Google Scholar]
- Bae, J., Isella, A., Zhu, Z., et al. 2023, ASP Conf. Ser., 534, 426 [Google Scholar]
- Balbus, S. A., & Hawley, J. F. 1991, ApJ, 376, 214 [Google Scholar]
- Balbus, S. A., & Hawley, J. F. 1998, Rev. Mod. Phys., 70, 1 [Google Scholar]
- Barraza-Alfaro, M., Flock, M., Marino, S., & Pérez, S. 2021, A&A, 653, A113 [NASA ADS] [CrossRef] [EDP Sciences] [Google Scholar]
- Baruteau, C., Barraza, M., Pérez, S., et al. 2019, MNRAS, 486, 304 [Google Scholar]
- Benisty, M., Bae, J., Facchini, S., et al. 2021, ApJ, 916, L2 [NASA ADS] [CrossRef] [Google Scholar]
- Benisty, M., Dominik, C., Follette, K., et al. 2023, ASP Conf. Ser., 534, 605 [NASA ADS] [Google Scholar]
- Bergez-Casalou, C., Bitsch, B., Pierens, A., Crida, A., & Raymond, S. N. 2020, A&A, 643, A133 [NASA ADS] [CrossRef] [EDP Sciences] [Google Scholar]
- Bi, J., Lin, M.-K., & Dong, R. 2021, ApJ, 912, 107 [NASA ADS] [CrossRef] [Google Scholar]
- Binkert, F., Szulágyi, J., & Birnstiel, T. 2021, MNRAS, 506, 5969 [NASA ADS] [CrossRef] [Google Scholar]
- Bohren, C. F., & Huffman, D. R. 1983, Absorption and scattering of light by small particles (New York: Wiley-Interscience) [Google Scholar]
- Brown-Sevilla, S. B., Keppler, M., Barraza-Alfaro, M., et al. 2021, A&A, 654, A35 [NASA ADS] [CrossRef] [EDP Sciences] [Google Scholar]
- Carpenter, J., Brogan, C., Iono, D., & Mroczkowski, T. 2023, in Physics and Chemistry of Star Formation: The Dynamical ISM Across Time and Spatial Scales, Proceedings of the 7th Chile-Cologne-Bonn Symposium, 304 [Google Scholar]
- Casassus, S., & Pérez, S. 2019, ApJ, 883, L41 [Google Scholar]
- Casassus, S., Christiaens, V., Carcamo, M., et al. 2021, MNRAS, 507, 3789 [CrossRef] [Google Scholar]
- Crida, A., & Morbidelli, A. 2007, MNRAS, 377, 1324 [Google Scholar]
- Cui, C., & Bai, X.-N. 2022, MNRAS, 516, 4660 [NASA ADS] [CrossRef] [Google Scholar]
- D’Angelo, G., Henning, T., & Kley, W. 2002, A&A, 385, 647 [CrossRef] [EDP Sciences] [Google Scholar]
- D’Angelo, G., Henning, T., & Kley, W. 2003, ApJ, 599, 548 [CrossRef] [Google Scholar]
- de Val-Borro, M., Edgar, R. G., Artymowicz, P., et al. 2006, MNRAS, 370, 529 [Google Scholar]
- de Val-Borro, M., Artymowicz, P., D’Angelo, G., & Peplinski, A. 2007, A&A, 471, 1043 [NASA ADS] [CrossRef] [EDP Sciences] [Google Scholar]
- Disk Dynamics Collaboration (Armitage, P. J., et al.) 2020, ArXiv e-prints [arXiv:2009.04345] [Google Scholar]
- Dominik, C., Min, M., & Tazaki, R. 2021, Astrophysics Source Code Library [record ascl : 2104.010] [Google Scholar]
- Dong, R., Liu, S.-Y., & Fung, J. 2019, ApJ, 870, 72 [NASA ADS] [CrossRef] [Google Scholar]
- Drążkowska, J., Bitsch, B., Lambrechts, M., et al. 2023, ASP Conf. Ser., 534, 717 [NASA ADS] [Google Scholar]
- Dullemond, C. P., Juhasz, A., Pohl, A., et al. 2012, Astrophysics Source Code Library [record ascl : 1202.015] [Google Scholar]
- Dullemond, C. P., Ziampras, A., Ostertag, D., & Dominik, C. 2022, A&A, 668, A105 [NASA ADS] [CrossRef] [EDP Sciences] [Google Scholar]
- Flaherty, K. M., Hughes, A. M., Teague, R., et al. 2018, ApJ, 856, 117 [CrossRef] [Google Scholar]
- Flaherty, K., Hughes, A. M., Simon, J. B., et al. 2020, ApJ, 895, 109 [NASA ADS] [CrossRef] [Google Scholar]
- Flock, M., Nelson, R. P., Turner, N. J., et al. 2017, ApJ, 850, 131 [Google Scholar]
- Flock, M., Turner, N. J., Nelson, R. P., et al. 2020, ApJ, 897, 155 [Google Scholar]
- Flores-Rivera, L., Flock, M., & Nakatani, R. 2020, A&A, 644, A50 [NASA ADS] [CrossRef] [EDP Sciences] [Google Scholar]
- Fukuhara, Y., Okuzumi, S., & Ono, T. 2021, ApJ, 914, 132 [NASA ADS] [CrossRef] [Google Scholar]
- Fukuhara, Y., Okuzumi, S., & Ono, T. 2023, PASJ, 75, 233 [NASA ADS] [CrossRef] [Google Scholar]
- Fung, J., & Chiang, E. 2016, ApJ, 832, 105 [NASA ADS] [CrossRef] [Google Scholar]
- Galloway-Sprietsma, M., Bae, J., Teague, R., et al. 2023, ApJ, 950, 147 [NASA ADS] [CrossRef] [Google Scholar]
- Gammie, C. F. 1996, ApJ, 457, 355 [Google Scholar]
- Garg, H., Pinte, C., Hammond, I., et al. 2022, MNRAS, 517, 5942 [CrossRef] [Google Scholar]
- Garufi, A., Benisty, M., Pinilla, P., et al. 2018, A&A, 620, A94 [NASA ADS] [CrossRef] [EDP Sciences] [Google Scholar]
- Goodman, J., & Rafikov, R. R. 2001, ApJ, 552, 793 [NASA ADS] [CrossRef] [Google Scholar]
- Gressel, O., Nelson, R. P., Turner, N. J., & Ziegler, U. 2013, ApJ, 779, 59 [NASA ADS] [CrossRef] [Google Scholar]
- Hall, C., Dong, R., Teague, R., et al. 2020, ApJ, 904, 148 [NASA ADS] [CrossRef] [Google Scholar]
- Hammer, M., & Lin, M.-K. 2023, MNRAS, 525, 123 [NASA ADS] [CrossRef] [Google Scholar]
- Harris, C. R., Millman, K. J., van der Walt, S. J., et al. 2020, Nature, 585, 357 [NASA ADS] [CrossRef] [Google Scholar]
- Hawley, J. F., & Balbus, S. A. 1991, ApJ, 376, 223 [NASA ADS] [CrossRef] [Google Scholar]
- Hu, X., Li, Z.-Y., Zhu, Z., & Yang, C.-C. 2022, MNRAS, 516, 2006 [NASA ADS] [CrossRef] [Google Scholar]
- Hunter, J. D. 2007, Comput. Sci. Eng., 9, 90 [NASA ADS] [CrossRef] [Google Scholar]
- Izquierdo, A. F., Testi, L., Facchini, S., Rosotti, G. P., & van Dishoeck, E. F. 2021, A&A, 650, A179 [NASA ADS] [CrossRef] [EDP Sciences] [Google Scholar]
- Izquierdo, A. F., Facchini, S., Rosotti, G. P., van Dishoeck, E. F., & Testi, L. 2022, ApJ, 928, 2 [NASA ADS] [CrossRef] [Google Scholar]
- Kepley, A. A., Tsutsumi, T., Brogan, C. L., et al. 2020, PASP, 132, 024505 [Google Scholar]
- Keppler, M., Benisty, M., Müller, A., et al. 2018, A&A, 617, A44 [NASA ADS] [CrossRef] [EDP Sciences] [Google Scholar]
- Keppler, M., Teague, R., Bae, J., et al. 2019, A&A, 625, A118 [NASA ADS] [CrossRef] [EDP Sciences] [Google Scholar]
- Klahr, H., & Hubbard, A. 2014, ApJ, 788, 21 [Google Scholar]
- Kley, W., D’Angelo, G., & Henning, T. 2001, ApJ, 547, 457 [NASA ADS] [CrossRef] [Google Scholar]
- Lehmann, M., & Lin, M. K. 2022, A&A, 658, A156 [NASA ADS] [CrossRef] [EDP Sciences] [Google Scholar]
- Lenz, C. T., Klahr, H., Birnstiel, T., Kretke, K., & Stammler, S. 2020, A&A, 640, A61 [NASA ADS] [CrossRef] [EDP Sciences] [Google Scholar]
- Lesur, G., Flock, M., Ercolano, B., et al. 2023, ASP Conf. Ser., 534, 465 [NASA ADS] [Google Scholar]
- Li, H., Finn, J. M., Lovelace, R. V. E., & Colgate, S. A. 2000, ApJ, 533, 1023 [NASA ADS] [CrossRef] [Google Scholar]
- Lin, D. N. C., & Papaloizou, J. C. B. 1993, in Protostars and Planets III, eds. E. H. Levy, & J. I. Lunine (Tucson: University of Arizona Press), 749 [Google Scholar]
- Lin, M.-K., & Youdin, A. N. 2015, ApJ, 811, 17 [NASA ADS] [CrossRef] [Google Scholar]
- Lovelace, R. V. E., Li, H., Colgate, S. A., & Nelson, A. F. 1999, ApJ, 513, 805 [NASA ADS] [CrossRef] [Google Scholar]
- Lyra, W., & Umurhan, O. M. 2019, PASP, 131, 072001 [Google Scholar]
- Malygin, M. G., Klahr, H., Semenov, D., Henning, T., & Dullemond, C. P. 2017, A&A, 605, A30 [NASA ADS] [CrossRef] [EDP Sciences] [Google Scholar]
- Manger, N., & Klahr, H. 2018, MNRAS, 480, 2125 [NASA ADS] [CrossRef] [Google Scholar]
- Manger, N., Pfeil, T., & Klahr, H. 2021, MNRAS, 508, 5402 [NASA ADS] [CrossRef] [Google Scholar]
- Marcus, P. S., Pei, S., Jiang, C.-H., et al. 2015, ApJ, 808, 87 [NASA ADS] [CrossRef] [Google Scholar]
- McMullin, J. P., Waters, B., Schiebel, D., Young, W., & Golap, K. 2007, ASP Conf. Ser., 376, 127 [Google Scholar]
- Mignone, A., Bodo, G., Massaglia, S., et al. 2007, ApJS, 170, 228 [Google Scholar]
- Nelson, R. P., Gressel, O., & Umurhan, O. M. 2013, MNRAS, 435, 2610 [Google Scholar]
- Öberg, K. I., Guzmán, V. V., Walsh, C., et al. 2021, ApJS, 257, 1 [CrossRef] [Google Scholar]
- Paardekooper, S., Dong, R., Duffell, P., et al. 2023, ASP Conf. Ser., 534, 685 [NASA ADS] [Google Scholar]
- Perez, S., Dunhill, A., Casassus, S., et al. 2015, ApJ, 811, L5 [NASA ADS] [CrossRef] [Google Scholar]
- Pérez, S., Casassus, S., & Benítez-Llambay, P. 2018, MNRAS, 480, L12 [Google Scholar]
- Pfeil, T., & Klahr, H. 2019, ApJ, 871, 150 [NASA ADS] [CrossRef] [Google Scholar]
- Pfeil, T., & Klahr, H. 2021, ApJ, 915, 130 [NASA ADS] [CrossRef] [Google Scholar]
- Pfeil, T., Birnstiel, T., & Klahr, H. 2023, ApJ, 959, 121 [NASA ADS] [CrossRef] [Google Scholar]
- Pinte, C., Price, D. J., Menard, F., et al. 2018, ApJ, 860, L13 [NASA ADS] [CrossRef] [Google Scholar]
- Pinte, C., Teague, R., Flaherty, K., et al. 2023, ASP Conf. Ser., 534, 645 [NASA ADS] [Google Scholar]
- Rabago, I., & Zhu, Z. 2021, MNRAS, 502, 5325 [NASA ADS] [CrossRef] [Google Scholar]
- Schöier, F. L., van der Tak, F. F. S., van Dishoeck, E. F., & Black, J. H. 2005, A&A, 432, 369 [Google Scholar]
- Segura-Cox, D. M., Schmiedeke, A., Pineda, J. E., et al. 2020, Nature, 586, 228 [NASA ADS] [CrossRef] [Google Scholar]
- Semenov, D., & Wiebe, D. 2011, ApJS, 196, 25 [Google Scholar]
- Semenov, D., Wiebe, D., & Henning, T. 2006, ApJ, 647, L57 [NASA ADS] [CrossRef] [Google Scholar]
- Shakura, N. I., & Sunyaev, R. A. 1973, A&A, 500, 33 [NASA ADS] [Google Scholar]
- Stadler, J., Benisty, M., Izquierdo, A., et al. 2023, A&A, 670, L1 [NASA ADS] [CrossRef] [EDP Sciences] [Google Scholar]
- Stolker, T., Dominik, C., Min, M., et al. 2016, A&A, 596, A70 [NASA ADS] [CrossRef] [EDP Sciences] [Google Scholar]
- Stoll, M. H. R., & Kley, W. 2014, A&A, 572, A77 [NASA ADS] [CrossRef] [EDP Sciences] [Google Scholar]
- Stoll, M. H. R., Kley, W., & Picogna, G. 2017a, A&A, 599, L6 [NASA ADS] [CrossRef] [EDP Sciences] [Google Scholar]
- Stoll, M. H. R., Picogna, G., & Kley, W. 2017b, A&A, 604, A28 [NASA ADS] [CrossRef] [EDP Sciences] [Google Scholar]
- Svanberg, E., Cui, C., & Latter, H. N. 2022, MNRAS, 514, 4581 [NASA ADS] [CrossRef] [Google Scholar]
- Szulágyi, J., Morbidelli, A., Crida, A., & Masset, F. 2014, ApJ, 782, 65 [CrossRef] [Google Scholar]
- Teague, R. 2019a, J. Open Source Softw., 4, 1220 [Google Scholar]
- Teague, R. 2019b, RNAAS, 3, 74 [NASA ADS] [Google Scholar]
- Teague, R., & Foreman-Mackey, D. 2018, RNAAS, 2, 173 [NASA ADS] [Google Scholar]
- Teague, R., Guilloteau, S., Semenov, D., et al. 2016, A&A, 592, A49 [CrossRef] [EDP Sciences] [Google Scholar]
- Teague, R., Henning, T., Guilloteau, S., et al. 2018, ApJ, 864, 133 [NASA ADS] [CrossRef] [Google Scholar]
- Teague, R., Bae, J., & Bergin, E. A. 2019a, Nature, 574, 378 [NASA ADS] [CrossRef] [Google Scholar]
- Teague, R., Bae, J., Huang, J., & Bergin, E. A. 2019b, ApJ, 884, L56 [Google Scholar]
- Teague, R., Bae, J., Aikawa, Y., et al. 2021, ApJS, 257, 18 [NASA ADS] [CrossRef] [Google Scholar]
- Teague, R., Bae, J., Andrews, S. M., et al. 2022, ApJ, 936, 163 [NASA ADS] [CrossRef] [Google Scholar]
- van Boekel, R., Henning, T., Menu, J., et al. 2017, ApJ, 837, 132 [Google Scholar]
- Villenave, M., Menard, F., Dent, W. R. F., et al. 2020, A&A, 642, A164 [NASA ADS] [CrossRef] [EDP Sciences] [Google Scholar]
- Villenave, M., Stapelfeldt, K. R., Duchêne, G., et al. 2022, ApJ, 930, 11 [NASA ADS] [CrossRef] [Google Scholar]
- Virtanen, P., Gommers, R., Oliphant, T. E., et al. 2020, Nat. Methods, 17, 261 [Google Scholar]
- Wölfer, L., Facchini, S., van der Marel, N., et al. 2023, A&A, 670, A154 [CrossRef] [EDP Sciences] [Google Scholar]
- Ziampras, A., Kley, W., & Nelson, R. P. 2023, A&A, 670, A135 [NASA ADS] [CrossRef] [EDP Sciences] [Google Scholar]
We apply the term “coherence” to refer to a gas flow moving in the meridional direction as a coherent structure through both disk hemispheres at a particular radius. In the opposite case, the flow would be divided into two distinct structures, both moving toward (or away from) the midplane.
All Tables
All Figures
|
Fig. 1 Snapshots of the VSI-unstable hydrodynamical simulations at the disk midplane. Shown (from top to bottom) are a simulation without an embedded planet, with an embedded Saturn-mass planet, and with a Jupiter-mass planet, and (from left to right) the gas density relative to the initial value (ρ/ρ0), radial velocity field (vr), meridional velocity field (vθ), and azimuthal velocity deviations from Keplerian rotation (υϕ − vKep). The included planets are orbiting at 100 au from the central star, marked with dotted lines in the second and third rows. The dashed lines in the first panel indicate the buffer zones applied in the hydro simulations. |
| In the text | |
|
Fig. 2 Snapshots of the VSI-unstable hydrodynamical simulations at the disk surface. Same as Fig. 1, but obtained at 3 pressure scale heights from the disk midplane (Z ~ 3H). |
| In the text | |
|
Fig. 3 R – Z view of the azimuthally averaged fields of our VSI-unstable disk simulations. Shown (from left to right) are the gas density normalized by its initial value, radial velocity (vr), meridional velocity (vθ), and azimuthal velocity deviations from Keplerian rotation (vϕ − vKep), and (from top to bottom) the simulation without an embedded planet, with a Saturn-mass planet (mp = 0.3mJup), and with a Jupiter-mass planet (mp = mJup). The black dashed lines in the first panel show the simulation buffer zones. The black dotted lines indicate the height at which Z ≈ 3H. The white circles show the radial location of the planets, where each circle’s diameter is set by the planet’s Hill sphere. |
| In the text | |
|
Fig. 4 Time evolution of the azimuthally averaged meridional velocity at the disk midplane (Z = 0). Shown (from top to bottom) are the simulations of VSI-turbulent disks without an embedded planet, with an embedded Saturn-mass planet, and with an embedded Jupiter-mass planet. The orbits are measured at the planets’ radial location (100 au), shown by the black dotted lines. The figure x-axis starts at the time at which the planets are inserted in the simulations. |
| In the text | |
|
Fig. 5 Outputs of VSI-unstable disk and α-viscous disk (α = 5 × 10⁻⁴) simulations with embedded massive planets at the disk midplane (Z = 0). From left to right: gas density normalized by the initial value, radial velocity (υr), meridional velocity (υθ), and azimuthal velocity deviations from Keplerian rotation (υϕ − υKep). From top to bottom: VSI simulation with a Saturn-mass planet (mp = 0.3mJup), α-viscous simulation with a Saturn-mass planet, VSI simulation with a Jupiter-mass planet (mp = mJup), and α-viscous simulation with a Jupiter-mass planet. The black dashed lines in the first panel show the simulation buffer zones. The black dotted lines show the planets’ orbital radius. The white circles show the location of the planets. The diameters of the circles are equal to the planets’ Hill spheres. |
| In the text | |
|
Fig. 6 Outputs of VSI-unstable and α-viscous disk (α = 5 × 10⁻⁴) simulations with embedded massive planets at the disk surface (Z ~ 3H). Same as Fig. 5, but for a disk slice 3 pressure scale heights above the disk midplane (Z ~ 3H). |
| In the text | |
|
Fig. 7 Deviations from Keplerian rotation for the raw 12CO(3−2) synthetic predictions of our post-processed simulations. From left to right: VSI-unstable disk without a planet, VSI-unstable disk with a Saturn-mass planet, α-viscous disk with a Saturn-mass planet, VSI-unstable disk with a Jupiter-mass planet, α-viscous disk with a Jupiter-mass planet. From top to bottom: predictions for different disk inclinations (i = [5°, 15°, 30°]). The approximate locations of the planets are indicated by black circles with a size of the planets’ Hill sphere. |
| In the text | |
|
Fig. 8 Deviations from Keplerian rotation for 12CO(3−2) ALMA simulated observations. From left to right: VSI-unstable disk without a planet, VSI-unstable disk with a Saturn-mass planet, and VSI-unstable disk with a Jupiter-mass planet. From top to bottom: predictions for different disk inclinations (i = [5°, 15°, 30°]). The approximated location of the planets is indicated by black circles with the size of the planet’s Hill radius. The gray solid lines indicate the zero velocity contour in the line-of-sight velocity maps. The disk is oriented so that its rotation in the sky is clockwise. The synthesized beam of 84 × 62 mas is shown in the bottom left corner of each panel. The data cubes have a velocity resolution of 100 m s−1, with an rms of 1 mJy beam−1 per channel. In all images the regions of low S/N have been clipped. |
| In the text | |
|
Fig. 9 Deviations from Keplerian rotation for 13CO(3−2) synthetic images of the post-processed simulations, for a VSI-unstable disk without embedded planets. In the first row, from left to right, we show models including the full disk, only the disk hemisphere closest to the observer (front side), and the farthest hemisphere of the disk (back side), for a disk inclination of 30 degrees. In the second row, a deprojected view of the residual maps (first row) is shown. The fourth panel, shows a normalized square root of the absolute value of the product of the front and back side deprojected residual maps, multiplied the sign of the initial multiplication of both residuals (see Eq. (9)). A ring of interest is enclosed by black dashed lines, drawn at 1.55 and 1.85 arcsec. The black solid line along the semi-minor axis in the non-Keplerian residuals shows the line of zero gas velocity projected into the line of sight. |
| In the text | |
|
Fig. A.1 Schematic of the expected meridional velocity (υθ) from a VSI-unstable disk with an embedded massive planet. Top: Face-on view, red (blue) indicates gas moving toward (away from) the disk midplane. Bottom: Edge-on view (radius vs. height) of the azimuthally averaged prediction, red (blue) indicates gas moving downward (upward); gray indicates the gas density. |
| In the text | |
|
Fig. A.2 Velocity radial profiles for the VSI-unstable disk simulations without a planet (first column), with an embedded Saturn-mass planet (second column), and with an embedded Jupiter-mass planet (third column). The values displayed correspond to 3 pressure scale heights from the disk midplane for both disk hemispheres, shown by the blue dashed and orange solid lines. The radial location of the planets is indicated with a vertical black solid line. |
| In the text | |
|
Fig. A.3 Radial profiles of the surfaces in which the optical depth (τ) reaches one for the J = 3 − 2 transition of 12CO, 12CO and C18O. The gray dashed lines indicate Z = γR for γ =0.1,0.2,0.3 and 0.4. The black solid lines indicate the simulation’s grid edges (Z = 0.5R and r = 250 au). |
| In the text | |
|
Fig. A.4 Velocity channel maps for the synthetic 12CO(3−2) emission line maps. From left to right: VSI-unstable disk without a planet, VSI-unstable disk with a Saturn-mass planet, α-viscous disk with a Saturn-mass planet, VSI-unstable disk with a Jupiter-mass planet, and α-viscous disk with a Jupiter-mass planet. From top to bottom: Predictions for different disk inclinations are presented (i = [5°, 15°, 30°]). The α-viscous models are run for a = 5 × 10⁻⁴. The approximated location of the planets is indicated with black circles, of the size of the planet’s Hill spheres. Displayed are channels that overlap with the location of the planets. A short movie of all the velocity channel maps is available online. |
| In the text | |
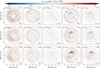 |
Fig. A.5 Same as Figure 7, but for the synthetic 13CO(3−2) predictions. |
| In the text | |
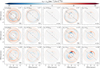 |
Fig. A.6 Same as Figure 7, but for the synthetic C18O(3−2) predictions. |
| In the text | |
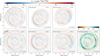 |
Fig. A.7 Same as Figure 9, but for a VSI-unstable disk with an embedded Saturn-mass planet. |
| In the text | |
 |
Fig. A.8 Same as Figure 9, but for a VSI-unstable disk with an embedded Jupiter-mass planet. |
| In the text | |
Current usage metrics show cumulative count of Article Views (full-text article views including HTML views, PDF and ePub downloads, according to the available data) and Abstracts Views on Vision4Press platform.
Data correspond to usage on the plateform after 2015. The current usage metrics is available 48-96 hours after online publication and is updated daily on week days.
Initial download of the metrics may take a while.