Open Access
Fig. A.3
Download original image
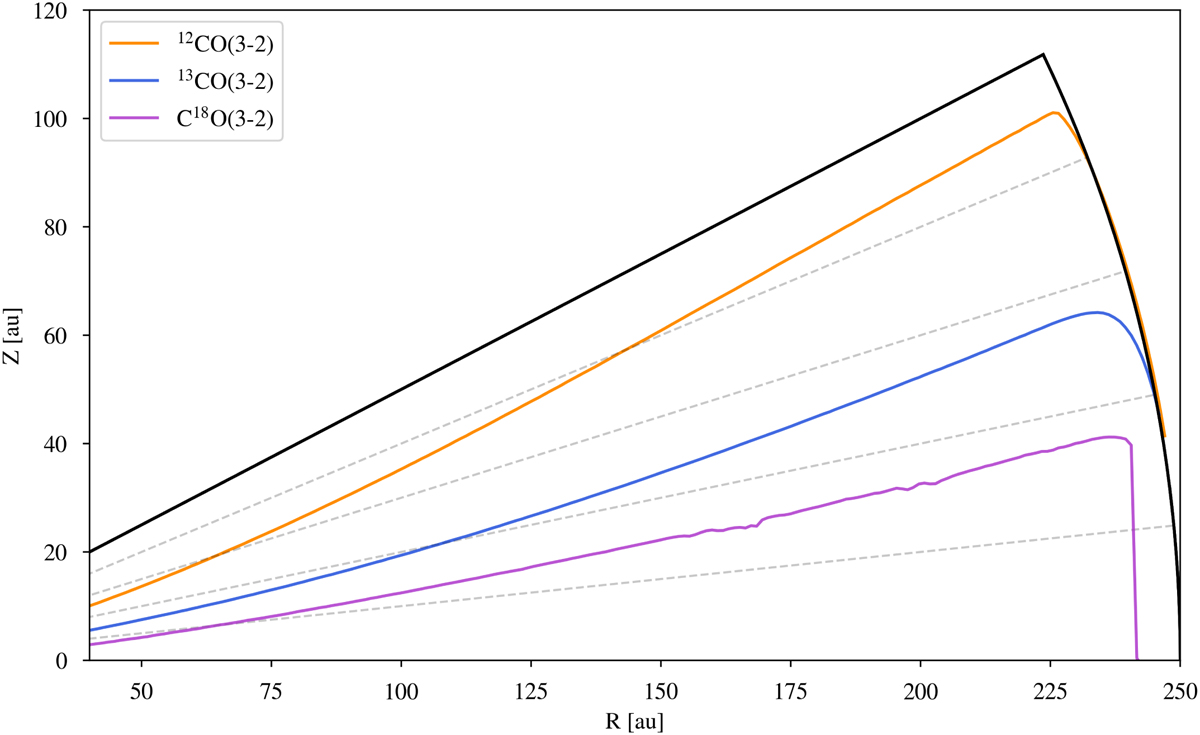
Radial profiles of the surfaces in which the optical depth (τ) reaches one for the J = 3 − 2 transition of 12CO, 12CO and C18O. The gray dashed lines indicate Z = γR for γ =0.1,0.2,0.3 and 0.4. The black solid lines indicate the simulation’s grid edges (Z = 0.5R and r = 250 au).
Current usage metrics show cumulative count of Article Views (full-text article views including HTML views, PDF and ePub downloads, according to the available data) and Abstracts Views on Vision4Press platform.
Data correspond to usage on the plateform after 2015. The current usage metrics is available 48-96 hours after online publication and is updated daily on week days.
Initial download of the metrics may take a while.