| Issue |
A&A
Volume 678, October 2023
|
|
|---|---|---|
| Article Number | A28 | |
| Number of page(s) | 26 | |
| Section | Extragalactic astronomy | |
| DOI | https://doi.org/10.1051/0004-6361/202346803 | |
| Published online | 04 October 2023 | |
z-GAL: A NOEMA spectroscopic redshift survey of bright Herschel galaxies
III. Physical properties
1
Institut de Radioastronomie Millimétrique (IRAM), 300 rue de la Piscine, 38400 Saint-Martin-d’Hères, France
e-mail: This email address is being protected from spambots. You need JavaScript enabled to view it.
2
Aix-Marseille Université, CNRS and CNES, Laboratoire d’Astrophysique de Marseille, 38 rue Frédéric Joliot-Curie, 13388 Marseille, France
3
Sorbonne Université, UPMC Université Paris 6 and CNRS, UMR 7095, Institut d’Astrophysique de Paris, 98b boulevard Arago, 75014 Paris, France
4
Department of Space, Earth and Environment, Chalmers University of Technology, Onsala Space Observatory, 439 92 Onsala, Sweden
5
Department of Physics and Astronomy, Rutgers, The State University of New Jersey, 136 Frelinghuysen Road, Piscataway, NJ 08854-8019, USA
6
Cosmic Dawn Center (DAWN), Radmandsgade 62, 2200 Copenhagen N, Denmark
7
DTU Space, Technical University of Denmark, Elektrovej 327, 2800 Kgs. Lyngby, Denmark
8
Instituto Astrofísica de Canarias (IAC), 38205 La Laguna, Tenerife, Spain
9
Universidad de La Laguna, Dpto. Astrofísica, 38206 La Laguna, Tenerife, Spain
10
Division of Particle and Astrophysical Science, Graduate School of Science, Nagoya University, Aichi 464-8602, Japan
11
National Astronomical Observatory of Japan, 2-21-1, Osawa, Mitaka, Tokyo 181-8588, Japan
12
Max-Planck-Institut für Radioastronomie, Auf dem Hügel 69, 53121 Bonn, Germany
13
National Centre for Nuclear Research, ul. Pasteura 7, 02-093 Warsaw, Poland
14
INAF – Osservatorio Astronomico d’Abruzzo, Via Maggini SNC, 64100 Teramo, Italy
15
Leiden University, Leiden Observatory, PO Box 9513 2300 RA Leiden, The Netherlands
16
Department of Physics and Astronomy, University of the Western Cape, Robert Sobukwe Road, Bellville 7535, South Africa
17
UK ALMA Regional Centre Node, Jodrell Bank Centre for Astrophysics, Department of Physics and Astronomy, The University of Manchester, Oxford Road, Manchester M13 9PL, UK
18
Dipartimento di Fisica e Astronomia “G. Galilei”, Università di Padova, vicolo dell’Osservatorio 3, 35122 Padova, Italy
19
University of California Irvine, Department of Physics & Astronomy, FRH 2174, Irvine, CA 92697, USA
20
School of Physics and Astronomy, University of Nottingham, University Park, Nottingham NG7 2RD, UK
21
School of Physics and Astronomy, Cardiff University, Queens Building, The Parade, Cardiff CF24 3AA, UK
22
Instituto Nacional de Astrofísica, Óptica y Electrónica, Astrophysics Department, Apdo 51 y 216, Tonantzintla, Puebla 72000, Mexico
23
European Southern Observatory, Karl-Schwarzschild-Strasse 2, 85748 Garching, Germany
24
Department of Physics and Astronomy, Macquarie University, North Ryde, New South Wales, Australia
25
School of Cosmic Physics, Dublin Institute for Advanced Studies, 31 Fitzwilliam Place, Dublin D02 XF86, Ireland
26
Institute for Astronomy, University of Edinburgh, Royal Observatory, Blackford Hill, Edinburgh EH9 3HJ, UK
27
I. Physikalisches Institut, Universität zu Köln, Zülpicher Strasse 77, 50937 Köln, Germany
28
Centre de Recherche Astrophysique de Lyon – CRAL, CNRS UMR 5574, UCBL1, ENS Lyon, 9 avenue Charles André, 69230 Saint-Genis-Laval, France
29
University of Cape Town, Department of Astronomy, Private Bag X3 Rondebosch, 7701 Cape Town, South Africa
30
INAF – Instituto di Radioastronomia – Italian ARC, Via Piero Gobetti 101, 40129 Bologna, Italy
31
Joint ALMA Observatory, Alonso de Córdova 3107, Vitacura, 763-0355 Santiago de Chile, Chile
32
European Southern Observatory, Alonso de Córdova 3107, Casilla, 19001 Vitacura, Santiago, Chile
33
Department of Physical Sciences, The Open University, Milton Keynes MK7 6AA, UK
34
National Radio Astronomy Observatory, 520 Edgemont Road, Charlottesville, VA 22903, USA
Received:
3
May
2023
Accepted:
14
July
2023
Abstract
The z-GAL survey observed 137 bright Herschel-selected targets with the IRAM Northern Extended Millimeter Array, with the aim to measure their redshift and study their properties. Several of them have been resolved into multiple sources. Consequently, robust spectroscopic redshifts have been measured for 165 individual galaxies in the range 0.8 < z < 6.5. In this paper we analyse the millimetre spectra of the z-GAL sources, using both their continuum and line emission to derive their physical properties. At least two spectral lines are detected for each source, including transitions of 12CO, [CI], and H2O. The observed 12CO line ratios and spectral line energy distributions of individual sources resemble those of local starbursts. In seven sources the para-H2O (211−202) transition is detected and follows the IR versus H2O luminosity relation of sub-millimetre galaxies. The molecular gas mass of the z-GAL sources is derived from their 12CO, [CI], and sub-millimetre dust continuum emission. The three tracers lead to consistent results, with the dust continuum showing the largest scatter when compared to 12CO. The gas-to-dust mass ratio of these sources was computed by combining the information derived from 12CO and the dust continuum and has a median value of 107, similar to star-forming galaxies of near-solar metallicity. The same combined analysis leads to depletion timescales in the range between 0.1 and 1.0 Gyr, which place the z-GAL sources between the ‘main sequence’ of star formation and the locus of starbursts. Finally, we derived a first estimate of stellar masses – modulo possible gravitational magnification – by inverting known gas scaling relations: the z-GAL sample is confirmed to be mostly composed by starbursts, whereas ∼25% of its members lie on the main sequence of star-forming galaxies (within ±0.5 dex).
Key words: submillimeter: galaxies / galaxies: high-redshift / galaxies: starburst / galaxies: star formation / galaxies: statistics / galaxies: ISM
© The Authors 2023
 Open Access article, published by EDP Sciences, under the terms of the Creative Commons Attribution License (https://creativecommons.org/licenses/by/4.0), which permits unrestricted use, distribution, and reproduction in any medium, provided the original work is properly cited.
This article is published in open access under the Subscribe to Open model. This email address is being protected from spambots. You need JavaScript enabled to view it. to support open access publication.
1. Introduction
Galaxy star formation takes place in dense gas clouds, fuelled by molecular hydrogen and catalysed by dust. Enriched gas is expelled in the form of stellar and galactic winds, to then be partially recycled to form new stars (e.g. McKee & Ostriker 2007; Bouché et al. 2010; Kennicutt & Evans 2012; Lilly et al. 2013; Tacconi et al. 2020).
The discovery and identification by the Infrared Space Observatory (ISO), the Spitzer Space Telescope, and the Herschel satellite of large numbers of distant sources emitting a substantial amount of their energy in the infrared (IR, e.g. Smail et al. 1997; Aussel et al. 1999; Elbaz et al. 1999, 2011; Lonsdale et al. 2003; Papovich et al. 2004; Frayer et al. 2009; Eales et al. 2010; Lutz et al. 2011; Oliver et al. 2012) demonstrated that, although locally rare, powerful IR galaxies are numerous at high redshift. The UV-optical emission of the newly formed young stars is absorbed by dust and re-processed into the far-infrared (far-IR) as thermal emission.
The majority of the star formation at high redshift occurs in dusty star-forming galaxies (DSFGs, e.g. Bourne et al. 2017; Bouwens et al. 2016, 2020; Dunlop et al. 2017; Hatsukade et al. 2018; Dudzevičiūtė et al. 2020; Zavala et al. 2021). The peak of galaxy growth, traced by the cosmic star formation density (SFRD) occurred at redshifts 1 < z < 3 (see the review by Madau & Dickinson 2014). Spitzer and Herschel extragalactic surveys demonstrated that in the local Universe the cosmic SFRD is dominated by galaxies with IR luminosity LIR < 1011 L⊙, while luminous infrared galaxies (LIRGs with LIR > 1011 L⊙) dominate at redshift z > 1 and ultra-luminous infrared galaxies (ULIRGs, LIR > 1012 L⊙) at z > 2 (e.g. Magnelli et al. 2011, 2013).
Star-forming galaxies occupy a preferential locus in the stellar mass versus star formation rate (SFR) space, called the star formation ‘main sequence’ (MS, e.g. Guzmán et al. 1997; Brinchmann & Ellis 2000; Papovich et al. 2006; Noeske et al. 2007; Elbaz et al. 2007; Daddi et al. 2007). The MS exists at all redshifts and its normalisation – that is its SFR for a given stellar mass – increases at earlier cosmic times (e.g. Elbaz et al. 2007). Galaxies lying above the MS experience intense events of star formation: starbursts possibly triggered by galaxy interactions and mergers that are destined to exhaust their gas reservoir over timescales much shorter than the Hubble time. On the other hand, MS galaxies undergo a ‘secular evolution’ characterised by a regular and constant star formation activity (e.g. Saintonge et al. 2013; Tacconi et al. 2018, 2020).
Given the evolution of the MS as a function of redshift, a galaxy with SFR ∼ 100 M⊙ yr−1 is a powerful starburst in the local Universe, but is a secularly evolving MS galaxy at z > 2 (e.g. Elbaz et al. 2010; Nordon et al. 2010). Consequently, galaxy growth and the cosmic SFRD are dominated by MS galaxies through time and at least up to z ∼ 3. Starbursts, on the other hand, contribute only to a fraction 5–10% of the cosmic SFRD (e.g. Rodighiero et al. 2011; Sargent et al. 2014; Schreiber et al. 2015).
The inferred IR luminosity of DSFGs can reach 1013 L⊙ (see reviews by Blain et al. 2002; Casey et al. 2014; Hodge & da Cunha 2020), corresponding to a SFR ∼ 1000 M⊙ yr−1. To sustain such a large SFR, a significant reservoir of molecular gas is required. Quantifying the molecular gas reservoir of DSFGs is imperative in order to understand the star formation processes they are undergoing and their evolution.
As the direct measurement of the H2 mass is hindered by the difficulty to directly detect the H2 molecule in cold molecular clouds (Sect. 4), other tracers associated with H2 have been adopted. The most used tracer is carbon monoxide (12CO), the second most abundant component of the molecular reservoir of galaxies after H2, and bright enough to allow for observations at high-z. With a good sampling of the 12CO spectral line energy distribution (SLED), it is possible to derive the physical properties of the molecular interstellar medium (ISM) such as its density, kinetic temperature, and mass (see reviews by e.g. Carilli & Walter 2013; Combes 2018). In addition to 12CO, the H2O and [CI] transitions have also proved to be valuable tracers of the molecular gas reservoir in high-redshift galaxies (e.g. Omont et al. 2013; Yang et al. 2020, 2016; Valentino et al. 2020; Dunne et al. 2022, and references therein), while other molecules tracing dense gas such as HCN or HCO+ are too faint to be observed in large samples of high-z sources (e.g. Rybak et al. 2022). Spectroscopic observations of 12CO at z > 1 are to date still limited to a few hundreds of galaxies and to a much smaller number for [CI] and H2O. A promising alternative is the dust sub-millimetre continuum of galaxies, which is much less expensive than spectroscopy in terms of observing time (e.g. Scoville et al. 2014, 2016, 2023).
The star formation of a galaxy is related to its fuel by the so-called Kennicutt-Schmidt law (Schmidt 1959; Kennicutt 1998a), which links its SFR to its molecular gas mass (or density). The ratio between these two quantities represents the timescale over which the galaxy would deplete its entire fuel reservoir at the current rate of star formation. Starbursts would consume all their molecular gas over timescales of few 108 years or shorter (Genzel et al. 2010, 2015; Tacconi et al. 2018, 2020).
Despite their modest contribution to the global star formation and galaxy assembly budget, starbursts are still the sites where the most extreme activity and physical processes take place. The most luminous DSFGs – for example, selected with bright flux cuts at far-IR millimetre observed wavelengths – have been and are the subject of extensive multi-wavelength follow-up observations with the aim to constrain their redshift and measure their molecular gas properties (e.g. Weiß et al. 2009, 2013; Walter et al. 2012; Harris et al. 2012; Lupu et al. 2012; Strandet et al. 2016; Fudamoto et al. 2017; Danielson et al. 2017; Reuter et al. 2020; Urquhart et al. 2022).
Herschel sources selected to have 500 μm fluxes above 80–100 mJy are found over a very wide redshift range (1 < z < 6 Nayyeri et al. 2016; Bakx et al. 2018; Neri et al. 2020; Reuter et al. 2020; Urquhart et al. 2022). A large number of them are gravitationally lensed (e.g. Negrello et al. 2010, 2017; Conley et al. 2011; Riechers et al. 2011a; Cox et al. 2011; Wardlow et al. 2013; Bussmann et al. 2013; Nayyeri et al. 2016; Bakx et al. 2020a,b), while others have been resolved into galaxy groups (e.g. Bussmann et al. 2015; Oteo et al. 2018; Gómez-Guijarro et al. 2019; Ivison et al. 2019). In rare cases intrinsically hyper-luminous infrared galaxies (HyLIRGs, with LIR > 1013 L⊙) have been identified (e.g. Ivison et al. 2013, 2019; Fu et al. 2013; Oteo et al. 2016; Riechers et al. 2013, 2017). Targeted CO observations have revealed large molecular gas masses of 1010 − 11 M⊙ (e.g. Tacconi et al. 2008; Ivison et al. 2011; Bothwell et al. 2013; Aravena et al. 2016; Harrington et al. 2021; Stanley et al. 2023), but have a diversity of excitation properties, reflected in their different SLEDs (e.g. Yang et al. 2017; Stanley et al. 2023).
The z-GAL survey, carried out with the IRAM Northern Extended Millimeter Array (NOEMA), is designed to study a large sample of Herschel-selected IR-bright DSFGs to determine their redshift, measure their dust and molecular gas content, and study their detailed nature. Following the success of a pilot project, which reported reliable spectroscopic redshifts of 11 such sources (Neri et al. 2020), further 126 DSFGs with 500 μm fluxes brighter than 80 mJy were targeted. Thanks to the detection of multiple CO lines and occasional other species ([1010 K km s−1 pc2], [CI], and HCN/HCO+), the success rate of z-GAL is 98.5%, with robust spectroscopic redshifts measured for 135 out of the original 137 Herschel-selected targets (Cox et al. 2023).
In Stanley et al. (2023) a detailed analysis of the individual molecular gas properties of the z-GAL pilot sources was presented. By combining the NOEMA CO measurements from Neri et al. (2020) with Very Large Array (VLA) follow-up observations targeting the 12CO(1−0) line, a diversity in properties was revealed. The depletion times measured were consistent with galaxies being both on the main sequence and the starburst phase, demonstrating that even with a selection of the most luminous sources, we are still probing galaxies on the main sequence. Furthermore, even with a relatively small sample, a large variety in SLEDs and line ratios was found, covering the full range of what has been previously observed for DSFGs. With a sample that is more than ten times larger, z-GAL offers the opportunity to explore this diversity in more detail.
In this paper, the third in the z-GAL series, we present the properties of the full z-GAL sample including the pilot project, as inferred combining their spectral lines and continuum emission. Paper I (Cox et al. 2023) presents the survey and an overview of the main results. The dust properties of the z-GAL sources are presented in Paper II (Ismail et al. 2023). The last paper in this series, Paper IV (Bakx et al., in prep.) will discuss the lensed nature of the z-GAL sources.
This paper is organised as follows. Section 2 briefly recalls the basic information about the z-GAL survey and describes the available data. Section 3 presents the main properties of the 12CO spectral lines, their luminosities, their ratios, and their energy distribution. The properties of water lines are studied in Sect. 3.4. The molecular gas mass of the z-GAL sources, as derived from 12CO, [CI] and the sub-millimetre dust continuum, are computed and compared in Sect. 4. Section 4.5 reports on the gas-to-dust ratio of the targets. The integrated Kennicutt-Schmidt relation is studied in Sect. 5, together with molecular gas depletion timescales. Finally in Sect. 6 we perform an inversion of the depletion timescales scaling relation and derive a first estimate of the stellar mass of our sources. Section 7 summarises the main findings of this study.
Throughout this paper we adopt a spatially flat ΛCDM cosmology with H0 = 67.4 km s−1 Mpc−1 and ΩM = 0.315 (Planck Collaboration VI 2020) and we assume a Chabrier (2003) initial mass function (IMF). Several z-GAL sources are potentially amplified by gravitational lensing (e.g. Berta et al. 2021). The unknown magnification factor μ is therefore hereby explicitly written for all affected quantities.
2. Survey and data overview
The z-GAL NOEMA Large Programme (project IDs M18AB and D20AB, PIs P. Cox, H. Dannerbauer, T. Bakx) and Pilot Programme (project IDs W17DM and S18CR, PI A. Omont; Neri et al. 2020) observed a total of 137 far-IR-bright distant targets. These sources were selected from the Herschel Bright Sources (HerBS, Bakx et al. 2018), the HerMES Large Mode Survey (HeLMS) and the Herschel Stripe 82 (HeRS) Survey (Nayyeri et al. 2016).
The HeLMS and HerS surveys include Herschel sources with S(500 μm)≥100 mJy. The HerBS survey is based on a S(500 μm) > 80 mJy flux cut and a photometric redshift zphot > 2 selection. All sources with spectroscopic redshifts already available and known blazars were excluded from the list of potential targets, thus resulting in the above mentioned 137 objects observed with NOEMA. We defer to Paper I for further details about the z-GAL source selection and observations, as well as for a description of the data calibration and reduction. The measurements of lines and continuum fluxes are described in Paper I and Paper II, respectively.
The NOEMA data revealed that several of these Herschel-selected targets consist of multiple components, that are detected in the dust continuum and emission lines. Taking into account all the multiple sources identified in the targeted fields, spectroscopic redshifts were measured for 165 individual objects in the range 0.8 < z < 6.5 (Paper I).
2.1. Spectral lines
The spectral emission lines detected in the z-GAL NOEMA spectra were fitted with a Gaussian profile with a simple least squares method. Up to four spectral lines were fitted simultaneously for a given source, thus leading to very precise redshift measurements (with typical errors of few 10−4 in redshift). For each source, all detected lines were assumed to have the same velocity width. When single Gaussian profiles were not sufficient to reproduce the observed line profile, double Gaussians were adopted. In this case, the algorithm also assumed that the velocity spacing between the fitted Gaussian profiles was the same for all detected lines. The determination of the redshifts, line intensities, line widths, velocity separations, and their respective errors, was based solely on the rest frequencies of the lines and on the S/N with which they were detected.
Paper I presents the line properties measured for all 137 z-GAL targets, including their sky coordinates, spectroscopic redshift, widths and integrated fluxes. For the majority of sources (85%) at least two 12CO lines are detected; 21% of the sources benefit from the detection of three spectral lines, including 12CO and other species, such as H2O and [CI]; finally 8% of the sources benefit from the detection of three 12CO transitions (Sect. 3.1 of Paper I). The spectra and maps of each z-GAL target are presented in the Appendix of Paper I.
2.2. Continuum
Paper II presents the NOEMA continuum catalogue of the z-GAL survey. Continuum fluxes were measured through polygonal apertures from cleaned continuum maps. Flux statistical uncertainties were computed rescaling the map noise to the effective extraction aperture size.
The spectral energy distributions (SEDs) of the z-GAL sources were modelled in Paper II. A modified black body (MBB) in its general form and in the optically thin approximation was adopted. The products of this analysis are the dust mass Mdust, temperature Tdust and emissivity index βdust of the sources, as well as their IR luminosity integrated between 50 and 1000 μm. To ensure an easy comparison to the previous works found in the literature, Paper II adopts the optically thin solution as reference and discusses the consequences of this approximation by comparing the results to those obtained with MBB in its general form. Therefore the same choice is made here.
The IR luminosities computed by integrating the MBB model are here used to estimate the SFR of the sources and to normalise the line fluxes when computing their median SLED. To this aim, the 50–1000 μm luminosities derived in Paper II need to be transformed into the total IR luminosity LIR(8 − 1000 μm). By integrating the SED templates by Berta et al. (2013, star-forming galaxies only), we derive a median ratio of L(50 − 1000 μm) to LIR of 0.7 with a median absolute deviation of 0.1. We adopt this value throughout this study. The choice of this library is driven mainly by the fact that it was built on a multicolour study of Herschel galaxies. It is certainly not exclusive and other template libraries could be used. We note however that we specifically avoid luminosity-dependent template libraries because a significant fraction of our sources is likely lensed (Paper IV) and their intrinsic luminosity is not known yet.
3. Properties of molecular gas
The rich z-GAL lines catalogue (Paper I) covers the 12CO transitions from Jup = 2 to Jup = 8, with at least two 12CO transitions available for most sources and, for a few, also the H2O or [CI] lines (Sects. 2.1, 3.4, and 4.3). In this Section we present the main properties of the detected 12CO and water emission lines. We compare them to those of different samples found in the literature, with the goal to understand the process that dominates the line emission of our sources and their nature. The 12CO line ratios of individual sources are studied in Sect. 3.1; the average 12CO SLED is presented in Sect. 3.2; the SLEDs of sources with at least three 12CO transitions available are modelled in Sect. 3.3; and finally the properties of water lines are discussed in Sect. 3.4.
The observed intensity of a spectral emission line can be translated into its luminosity (in units of K km s−1 pc2) using the standard relation (e.g. Solomon & Vanden Bout 2005):
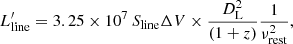 (1)
(1)
where SlineΔV is the velocity-integrated line intensity in units of Jy km s−1, νrest is the line rest frequency in GHz, and DL is the luminosity distance in Mpc.
3.1. CO lines ratios
Table B.1 lists the values of  obtained for all the detected 12CO transitions of the z-GAL sources, as derived from the catalogue presented in Paper I. Table 1 lists the median
  line luminosity ratios, rij/lm, and the median ICO line intensity ratios, Rij/lm, representing the ratios between the transitions 12CO(i − j)/12CO(l − m). For comparison, we derive the corresponding
  ratios from the Tables by Carilli & Walter (2013, CW13), Boogaard et al. (2020, B20, eight galaxies in the redshift range z = 2.0 − 2.7), and Harrington et al. (2021, H21). We apply standard error propagation to derive the uncertainties associated with the B20 and H21 ratios. Except the cases with less than ten sources available, the z-GAL ratios are comparable to those of sub-millimetre galaxies (SMGs) by CW13 and H21. We attribute the discrepancy of the remaining line ratios to small number statistics. The B20 sample finally consists of less luminous galaxies, with a median IR luminosity of LIR ∼ 8 × 10¹¹ L⊙, and is therefore complementary to z-GAL.
Median L′(12CO) line luminosity ratios and I(12CO) line intensity ratios, measured for the full z-GAL + pilot sample.
Figure 1 shows the distribution of the computed L′ and I ratios for those transitions with at least ten sources available. Possible trends of the 12CO line ratios as a function of redshift or FWHM are investigated but none are found.
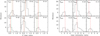 |
Fig. 1. 12CO line ratios. Left panels: L′ line luminosity ratios, rij/lm between the transitions 12CO(i − j)/12CO(l − m). The red long-dashed vertical lines mark the median z-GAL ratios (Table 1). The dotted light-blue vertical lines represent the ratios reported for SMGs by CW13; the short dash orange lines the H21 SMG ratios; and the dot-dash green lines the B20 line ratios of less luminous galaxies, complementary to the z-GAL sample. Right panels: Observed intensity I ratios, Rij/lm; the red long-dashed vertical lines mark the median values. |
For completeness sake, we recall that Stanley et al. (2023) observed the 11 z-GAL pilot targets (Neri et al. 2020) with the VLA, detecting the 12CO(1−0) transition in all of them. These authors combine their 12CO(1−0) measurements to the (3 − 2), (4 − 3), and (5 − 4) by Neri et al. (2020) and report median ratios: r32/10 = 0.69, r43/10 = 0.64 and r54/10 = 0.74. These ratios are to be compared to those measured by H21 for Planck lensed galaxies, r32/10 = 0.69 ± 0.12, r43/10 = 0.52 ± 0.14, r54/10 = 0.37 ± 0.15, and those collected by CW13 for SMGs, r32/10 = 0.66, r43/10 = 0.46, and r54/10 = 0.39. The results by Stanley et al. (2023) indicate a higher 12CO excitation of the z-GAL pilot sources with respect to CW13 and H21.
3.2. Average 12CO SLED
The average 12CO SLED of the z-GAL sample has been computed as the Gaussian average and deviation of the ratio  of each detected transition multiplied by
  (see Yang et al. 2017). In Fig. 2, the result is shown as a function of Jup and compared to other LIR-normalised 12CO SLEDs found in the literature.
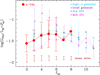 |
Fig. 2. LIR-normalised average SLED of the z-GAL sources, compared to high-z SMGs (Carilli & Walter 2013; Yang et al. 2017), local star-forming galaxies (Liu et al. 2015), Arp 220 (Rangwala et al. 2011) and Mrk 231 (van der Werf et al. 2010). In the case of z-GAL data points, if the volume of the |


The z-GAL average SLED is consistent with high-redshift SMGs (Carilli & Walter 2013; Yang et al. 2017) within the error bars and similar to the local star-formation-dominated ULIRG Arp220 (Rangwala et al. 2011). The flatness of these SLEDs demonstrates that in such objects the low-excitation CO component (peaking at Jup = 3 − 4) is marginal, at odds with local star-forming galaxies (Liu et al. 2015). The SLED of the AGN-powered ULIRG Mrk 231 (van der Werf et al. 2010) is also flat, but its CO/IR luminosity ratio is overall significantly lower than in SF-dominated galaxies.
3.3. LVG analysis of individual 12CO SLEDs
We modelled the 12CO excitation and the physical conditions of the molecular gas using the large velocity gradient (LVG) statistical equilibrium method (e.g. Sobolev 1960) for seven z-GAL sources with at least three 12CO transitions detected. Two further sources (HerBS-43b and HerBS-58) are described by Stanley et al. (2023). We adopted a one-dimensional (1D) non-LTE radiative transfer code RADEX (van der Tak et al. 2007), with an escape probability of β = (1 − e−τ)/τ derived from an expanding sphere geometry. The 12CO collisional data are from the LAMDA database (Schöier et al. 2005). With the same MCMC (Monte Carlo Markov chain) approach used by Yang et al. (2017), we derive the posterior distributions of the kinetic temperature of the molecular gas (Tkin), the volume density (nH2), the column density of 12CO per unit velocity gradient (NCO/dV), and the solid angle (Ωapp) of the source. Assuming a similar filling factor and magnification across the J transitions of the 12CO, the overall shape of the 12CO SLEDs only depends on Tkin, nH2, and NCO/dV, and scales with Ωapp (also including the magnification factors). Therefore we focus only on the parameters Tkin, nH2 and NCO/dV.
As the transitions of the 12CO lines observed are Jup ≤ 7, there are insufficient data to constrain the highly excited molecular gas component, which usually peaks around Jup = 8 (Yang et al. 2017). Therefore we assume that our galaxies are similar to other high-redshift SMGs, in which the 12CO excitation is dominated by two components peaking around J = 6 and 8, respectively (Yang et al. 2017; Cañameras et al. 2018). Accordingly, to better constrain the posteriors, we used slightly tighter boundaries for the flat priors of nH2 and NCO/dV compared to Yang et al. (2017), while other priors are unchanged. Taking the values of the parameters from statistically studied SMG samples (Yang et al. 2017; Cañameras et al. 2018), we have chosen flat priors of log(nH2/cm−2) between 2.0 and 5.5 and log(NCO/dV/cm−2(km s−1)−1) between 15.5 and 18.5. Similarly, we also limited the range of the thermal pressure Pth (defined by Pth ≡ nH2 × Tkin) to be within 104 and 107 K cm−3.
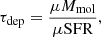
A total of 100 000 points of the solutions have been explored in the parameters space, with two hundred walkers and five hundred iterations after the one hundred burn-in runs. Figure 3 shows the observed SLED and the models. The results are reported in Table 2, indicating the ±1σ values and the median of the posteriors. Most of the values of the molecular gas temperature are in the range from 100 to 250 K, while the density varies from 103.3 to 104.0 cm−3. These values are consistent with the ones found in high-redshift SMGs (Yang et al. 2017; Cañameras et al. 2018; Harrington et al. 2021, log(nH2/cm−3)≃2.5 − 4.1, Tkin ≃ 20 − 750 K) and with those of the Pilot Programme (Stanley et al. 2023, log(nH2/cm−3) = 2.5 − 3.9, Tkin = 100 − 200 K).
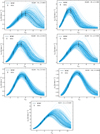 |
Fig. 3. Results of LVG fit of the 12CO SLEDs. The best fit model is plotted in black. The blue thin lines represent all models within the ±1σ range of the posterior distribution around the best fit. |
Results of LVG modelling of the 12CO SLEDs of z-GAL individual sources with at least three 12CO transition available.
3.4. Water lines
Water is one of the most abundant molecules after H2 and CO in the gaseous ISM (e.g. van Dishoeck et al. 2013). The emission and absorption of the H2O lines trace a variety of physical processes such as shocks, collisions and radiative pumping. Therefore it probes the physical conditions of the inter-stellar medium (ISM) in both local (e.g. González-Alfonso et al. 2014) and high-redshift galaxies (e.g. Omont et al. 2013; Yang et al. 2016, 2020; Jarugula et al. 2019). Being Eupper ⪆ 130 K, H2O is primarily excited through absorption of far-IR photons emitted by warm dust in dense regions. Only a small contribution from collisional excitation is expected, therefore it is a useful diagnostic of the far-IR radiation field (e.g. González-Alfonso et al. 2022). Observationally, these sub-millimetre H2O lines are the second strongest molecular emission lines after CO (e.g. Yang et al. 2013).
In the z-GAL sample, we have detected seven sources in the para-H2O (211−202) line (νrest = 752 GHz) with Eupper = 137 K: HeLMS-17 W, HerBS-38 NE, 83, 177, 179, 185 (see Tables in the Appendix of Paper I), and finally HerBS-154 from the Pilot Programme (Neri et al. 2020). We note that the z = 6.5678 HerBS-38 NE source lies in a field with two other sources at z = 2.4775 and 2.4158, labelled HerBS-38 SE and W (Paper I). Because of blending in the Herschel bands, it is not possible to estimate its IR luminosity, therefore this source is not included in this piece of analysis.
The line widths of these water lines are similar to those of the CO lines, similarly to the findings of other studies (e.g. Omont et al. 2013; Yang et al. 2016), suggesting that they are emitted by the same star-forming regions across the sources. The observed line luminosities of the para-H2O (211−202) lines are in the range μLH2O = 1.1 to 4.7 × 10⁸ L⊙, placing them amongst the brightest H2O emitters identified to date (modulo gravitational lensing magnification).
In Fig. 4 the correlation between the H2O (211−202) luminosity and LIR of the z-GAL sources is presented together with results from previous studies. Including the z-GAL sources, the slope of this correlation is found to be 0.97 ± 0.08, slightly shallower than the relation 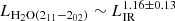 reported by Yang et al. (2016), but still in good agreement within the uncertainties. The average LH2O(211 − 202)/LIR ratio of the z-GAL sources is ∼10−5, close to the value found by Yang et al. (2016). This is consistent with the expectation that far-IR pumping is likely the dominant mechanism of the excitation of the sub-millimetre H2O lines in very dense, heavily obscured star-formation-dominated regions (e.g. González-Alfonso et al. 2014, 2022; Yang et al. 2016).
 |
Fig. 4. Correlation between LIR and LH2O(211 − 202) for local (black symbols), high-redshift star-forming SMGs (blue symbols), and QSO/AGN (red). z-GAL sources are marked in green. The fitting of the correlation is represented by the solid orange line. The posterior distribution of the slope is shown in the inset. The plot is adapted from Yang et al. (2016, see references therein). The new fit is performed by including the z-GAL sources (green symbols) as well as the sources from the literature. |
The source HeLMS-49 has been detected in the ortho-H2O (423−330) line (νrest = 448 GHz), that has an upper energy level of Eupper = 433 K. This line was first detected in ESO 320-G030 (Pereira-Santaella et al. 2017) and later in the z = 3.6 dusty star-forming galaxy G09v1.97 (Yang et al. 2020). Both works argue that the origin of the line is mostly far-IR pumping rather than maser emission. Therefore, being optically thin, this highly excited water transition is probing deeply into the dense nuclear regions of these galaxies (González-Alfonso et al. 2021). The luminosity of the H2O (423−330) line in HeLMS-49 is (1.7 ± 0.5)×108 L⊙, yielding a LH2O(423 − 330)/LIR ratio of 6 × 10⁻⁶ (assuming no differential lensing effect). This is about six times larger than what has been found in G09v1.97 (∼0.9 × 10⁻⁶Yang et al. 2020), which might indicate the presence of a strong far-IR source deeply buried in the nuclear region of HeLMS-49, possibly powered by a highly obscured active galactic nucleus (AGN) or a nuclear starburst. Further observations are needed to confirm either of these scenarios.
4. Molecular gas mass
Using the millimetre CO and [CI] lines detected by NOEMA, as well as the sub-millimetre continuum emitted by dust, in this Section we study the molecular gas reservoir of the z-GAL sources, deriving their molecular gas masses and dust to gas mass ratios. Star formation takes place in dense molecular clouds and there is little or no correlation between neutral atomic hydrogen and star formation at the low densities (e.g. Kennicutt 1989; Bigiel et al. 2008, 2011, see Tacconi et al. 2020 for a review). Therefore it is assumed that the fuel of star formation consists predominantly of molecular gas, Mmol.
Total and molecular gas masses are defined as:
 (2)
(2)
 (3)
(3)
where MHe is the mass of helium, MH2 is the mass of molecular hydrogen and MHI the mass of atomic hydrogen. The contribution of helium is factorised as a multiplicative factor ×1.36.
The direct detection of H2 is non trivial (see, e.g. the reviews by Combes 2000; Habart et al. 2005): the molecule has no dipole moment and all ro-vibrational and rotational transitions are of quadrupolar origin and faint. Most H2 is in cool, shielded regions with too low excitation to produce bright emission lines and too high extinction to allow a direct detection of UV transitions. Warm H2 mid-IR are virtually invisible at the temperatures of giant molecular clouds (10–20 K) where the bulk of star formation takes place. Finally, near- and mid-IR H2 emission driven by shocks and turbulence traces only a small fraction of the H2 mass of galaxies.
For these reasons, the molecular gas content of galaxies is usually determined using other tracers, in particular carbon monoxide (the most abundant molecule), atomic carbon [CI], or more rarely water and HCN, accessible with millimetre spectroscopy. In this way, the molecular gas mass is computed from the luminosity of the molecular tracer by:
 (4)
(4)
where the conversion factor αtracer is expressed in units of M⊙ (K km s−1 pc2)−1.
4.1. The choice of αCO
For nearby star-forming galaxies with near-solar metallicity, the commonly adopted αCO conversion factor is the empirical Milky Way value αCO, MW = 4.36 ± 0.9 M⊙ (K km s−1 pc2)−1, including the helium contribution (e.g. Magnelli et al. 2012; Bolatto et al. 2013; Carilli & Walter 2013; Tacconi et al. 2020). For extreme local starbursts (ULIRGs), a long and debated discussion pointing to a ∼4 times lower conversion factor has been going on since two decades, initially sustained by evidence from dynamical arguments, and advocating a value of 0.8–1.5 M⊙ (K km s−1 pc2)−1 for these extreme sources (e.g. Downes & Solomon 1998; Scoville et al. 1997). A similar value has also been suggested to hold for SMGs, outliers of the main sequence of star formation and powerful DSFGs in general, creating a bimodality between ‘normal’ star-forming galaxies and ‘starbursts’ (e.g. Daddi et al. 2010; Genzel et al. 2010; Carilli & Walter 2013). Applying the 1.36× helium correction, this becomes αCO, SB = 1.09 M⊙ (K km s−1 pc2)−1.
In recent years, this dichotomy has lost its initial popularity and an increasing number of studies, based on (sub-) millimetre spectroscopy and dust continuum observations, highlighted that such a bimodality of the CO conversion factor might in fact be an artificial interpretation of more subtle trends of physical parameters. Tacconi et al. (2020) studied scaling relations of gas content, gas fraction, and depletion timescales as a function of other measurable physical parameters (e.g. stellar mass, M*, and specific star formation rate, sSFR) of DSFGs of near-solar metallicity on the MS and above (see also Genzel et al. 2015; Tacconi et al. 2018). The depletion timescale of galaxies is considered the primary parameter of gas evolution and these authors point out that the low gas masses inferred from the gas dynamics in local ULIRGs, and more generally for galaxies above the MS, are in this scheme encapsulated in the dependence of depletion time on the distance from the MS, rather than in a change of αCO (see also Scoville et al. 2016, 2017). Tacconi et al. (2020) adopt a metallicity-dependent 12CO conversion factor based on the prescriptions by Bolatto et al. (2013) and Genzel et al. (2012), with a reference value αCO, MW = 4.36 ± 0.9 M⊙ (K km s−1 pc2)−1 at solar metallicity. Gas metallicities are estimated mainly using the stellar mass versus metallicity (M* − Z) relation (Genzel et al. 2015, in the Pettini & Pagel 2004 scale). Computing gas masses from 12CO detections, dust mass estimates and the sub-millimetre continuum measurements, they show that the three tracers are in good agreement, once the conversion zeropoints are correctly cross-calibrated.
Currently the z-GAL sample does not include any information about gas metallicity, neither from optical spectroscopy or indirect estimates such as the M* − Z relation. In Sect. 6 and Appendix A we develop a method to derive M* from the Tacconi et al. (2020) scaling relations, but the resulting M* is defined only modulo a factor that depends on the lens magnification μ. Since the actual value of μ is currently unknown for the z-GAL galaxies, the derived M* are not be adopted in the computation of a metallicity-dependent αCO.
Dunne et al. (2022) pointed out that for dusty star-forming galaxies (e.g. selected in the far-IR or sub-millimetre), it is safe to assume that the metallicity is high, such that the gas-to-dust mass ratio, δGDR is broadly similar to that of the MW (see also Appendix A and Magdis et al. 2012; Rowlands et al. 2014; Berta et al. 2016; Yang et al. 2017). Dunne et al. (2022, 2021) studied a large, heterogeneous sample of galaxies with observations in three different molecular gas tracers: 12CO, [CI] and sub-millimetre continuum, including main sequence star-forming galaxies up to z ∼ 1, local ULIRGs, and high-redshift outliers of the MS (thereby labelled SMGs). With an initial choice of the gas mass absorption coefficient κH = δGDR/κ850 = 1884 kg m−2, similar to that of the MW and other local disks, these authors retrieve an average αCO = 4.0 ± 0.1 M⊙ (K km s−1 pc2)−1, including the contribution of helium (see Table 14 of Dunne et al. 2022 for a further review of αCO values found in the literature).
As a counter-test, Dunne et al. (2022) changed their initial assumption into a bimodal normalisation for MS and SMG galaxies and indeed retrieve a final optimised αCO similarly bimodal. Nevertheless, when this assumption is made, the [CI] and 850 μm continuum conversion factors also become bimodal, a fact that is not supported by any observational evidence so far and that would also be a challenge for astro-chemistry models (Dunne et al. 2022). In light of these findings and given the limitations of the available data, in what follows for the z-GAL galaxies we adopt a conversion factor αCO = 4.0 M⊙ (K km s−1 pc2)−1, including the contribution of helium.
4.2. Molecular gas mass from 12CO
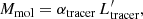
The luminosity of the 12CO lines detected by NOEMA (Sect. 3.1) are transformed into 12CO(1−0) luminosity adopting the average ratios given by Carilli & Walter (2013) for SMGs: r21/10 = 0.85, r32/10 = 0.66, r43/10 = 0.46, and r54/10 = 0.39. For each source, we adopt the  derived from the lowest-Jup detected transition, between Jup = 2 and 5. Figure 5 compares the values of
  derived from the different CO transitions. In the bottom panel,
  computed from the lowest available Jup is compared to the average of those computed from all available transitions for the given object up to (5 − 4), showing a very good agreement.
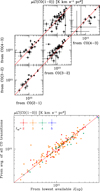 |
Fig. 5. Derivation of 12CO(1−0) luminosity. Upper panels: Comparison between the values of |


The 12CO(1−0) luminosity derived in this way is finally converted into molecular gas mass, adopting the αCO value as in Sect. 4.1. Table B.2 lists the results and Fig. 6 presents the distribution of μMmol of the z-GAL sources. The derived values of the molecular gas mass, μMmol, not corrected for gravitational magnification, are in the range from 1011 to few 1012 M⊙. These lie at the upper end of the Mmol of star-forming galaxies at any redshift, regardless of magnification, comparable to other samples of gravitationally amplified galaxies (e.g. Riechers et al. 2011b; Harris et al. 2012; Ivison et al. 2013; Yang et al. 2017). See Sect. 5 for a thorough comparison.
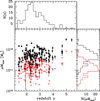 |
Fig. 6. Distribution of molecular gas masses of the z-GAL sources as a function of redshift, obtained using αCO = 4.0 M⊙ (K km s−1 pc2)−1 (solid black symbols, our choice of preference) and 1.09 (starbursts value, red open symbols), including the contribution of helium. |
In Fig. 6 we also compare the values of μMmol obtained with our choice of αCO (black filled symbols) with the one that would have been obtained adopting the starburst normalisation αCO, SB = 1.09 M⊙ (K km s−1 pc2)−1 (red open symbols). As discussed by Dunne et al. (2022) a different choice in the normalisation of the conversion factor between the molecular gas tracers and Mmol causes only a simple rescaling of the results.
4.3. Atomic carbon
Out of the 137 sources in the z-GAL (including pilot) sample, 27 sources were detected in the [CI](3P1−3P0) emission line, and, for three of them, the [CI](3P2−3P1) emission line was also measured. The availability of a substantial number of sources where [CI] is detected allows us to explore the properties of the atomic carbon emission lines and, importantly, to check the consistency of the H2 masses derived independently from the 12CO and [CI](3P1−3P0) emission lines. Table 3 lists the sources where [CI](3P1−3P0) and [CI](3P2−3P1) are detected together with the line fluxes, the [CI](3P1−3P0) and (3P2−3P1) luminosities, the [CI] masses, the abundance of [CI] relative to molecular hydrogen, X[C I]/X[H2], and, in the last column, the molecular gas masses derived from the atomic carbon masses.
[C I] Properties of the z-GAL sources.
We estimated the neutral carbon masses by using Eq. (1) in Weiß et al. (2005), assuming a [CI] excitation temperature equal to Texc = 30 K, which is close to the value in Walter et al. (2011), ⟨Texc⟩ = 29.1 ± 6.3 K, and the mean temperature of ⟨Texc⟩ = 25.6 ± 1.0 K found by Valentino et al. (2020):
![Mathematical equation: $$ \begin{aligned} M_{\rm [C{\small I}]} = 5.706 \times 10^{-4} \, Q(T_{\rm exc}) \frac{1}{3} e^{23.6/T_{\rm exc}} \, L^{\prime }_{\rm [C{\small I}](1-0)} {,} \end{aligned} $$](/articles/aa/full_html/2023/10/aa46803-23/aa46803-23-eq50.gif) (5)
(5)
where Q(Texc) = 1 + 3e−23.6 K/Texc + 5e−62.5 K/Texc is the partition function of [CI] and the result is expressed in units of M⊙.
A more precise measure of the excitation temperature, Texc, can be derived for the three sources where the two [CI] emission lines were detected, namely HeLMS-19, HerBS-185 and HerBS-201. Assuming local thermal equilibrium and, under the condition that the lines are optically thin, the excitation temperature equals the kinetic temperature:
![Mathematical equation: $$ \begin{aligned} {T_{\rm exc}}/\mathrm{K} = 38.8/{\ln }(2.11/R_{\rm [C{\small I}]}){,} \end{aligned} $$](/articles/aa/full_html/2023/10/aa46803-23/aa46803-23-eq51.gif) (6)
(6)
where
![Mathematical equation: $$ \begin{aligned} R_{\rm [C{\small I}]} = L\prime _{\rm [C{\small I}](2-1)}/L\prime _{\rm [C{\small I}](1-0)}\mathrm{.} \end{aligned} $$](/articles/aa/full_html/2023/10/aa46803-23/aa46803-23-eq52.gif) (7)
(7)
Using the measured fluxes of the [CI](2 − 1) emission line, we derive excitation temperatures of 45, 54, and 18 K for HeLMS-19, HerBS-185, and HerBS-201, respectively. A similar scatter in the excitation temperatures has also been found in previous studies (e.g. Valentino et al. 2020; Walter et al. 2011; Nesvadba et al. 2019), although it has only a minor impact on the estimate of the [CI] masses.
Combined with the estimate of Mmol based on 12CO, the mass of neutral atomic carbon M[C I] yields an estimate of the [CI] abundance relative to molecular hydrogen: X[C I]/X[H2], where MH2 = Mmol/1.36. The values of the [CI] abundance thus obtained are listed in Table 3; their median value is 1.4 × 10⁻⁵ with a median absolute deviation of 0.5 × 10⁻⁵, consistent with the value of 1.6 × 10⁻⁵ derived by Dunne et al. (2022). Therefore the molecular gas masses listed in the last column of Table 3 are derived adopting the average ![Mathematical equation: $ L\prime_\mathrm{[C{\small I}]}/M_{\mathrm{mol}} $](/articles/aa/full_html/2023/10/aa46803-23/aa46803-23-eq53.gif) conversion factor by Dunne et al. (2022), α[C I] = 17.0 M⊙(K km s−1 pc−2)−1, that includes the correction for helium.
conversion factor by Dunne et al. (2022), α[C I] = 17.0 M⊙(K km s−1 pc−2)−1, that includes the correction for helium.
The comparison between the molecular gas mass derived from the lower-J CO emission lines (Sect. 4.2) and the [CI](1–0) emission line using the α[C I] by Dunne et al. (2022) is displayed in Fig. 7. The evidence shown by this diagram is twofold. The consistency between the median [CI] abundance of the z-GAL sample and the value derived by Dunne et al. (2022) is reflected by the distribution of the data around the 1:1 locus within a factor of ∼1.5. Moreover, the scatter of the data points in Fig. 7 (left panel) is the direct consequence of the variety of abundance values that we derived (Table 3).
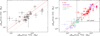 |
Fig. 7. Comparison between the molecular gas masses derived from the [CI](3P1-3P0) and 12CO emission lines for the z-GAL sources where both lines are detected. No correction for amplification was applied to the CO or the [CI] luminosities. Left panel: z-GAL sources only. The solid red line shows the 1:1 locus and the dotted lines the ± 50% region around it. Right panel: Comparison to sources found in the literature with available [CI](3P1-3P0), (Valentino et al. 2018, 2020; Bothwell et al. 2017; Dunne et al. 2021; Alaghband-Zadeh et al. 2013). The axes range covered by the left panel is highlighted. |
The right-hand panel of Fig. 7 compares the z-GAL results to a selection of sources with available [CI](3P1−3P0) from the literature. This comparison shows not only the consistency of the adopted αCO and α[C I], but also how the z-GAL data provide a sizeable addition to previously existing results by populating the locus of lensed sources.
4.4. The 850 μm continuum
A common alternative method to derive the molecular gas mass of galaxies is to use their FIR-mm continuum emission to estimate dust mass and then convert it assuming their metallicity properties (e.g. Leroy et al. 2011; Magdis et al. 2012; Santini et al. 2014; Béthermin et al. 2015, see Berta et al. 2016 for a discussion). Scoville (2013), Scoville et al. (2014, 2016), and Eales et al. (2012) proposed that a single frequency, broadband measurement in the Rayleigh-Jeans tail of the dust SED is sufficient to estimate the gas masses. They used nearby objects and distant star-forming galaxies observed with ALMA and Herschel to calibrate the 850 μm luminosity of a galaxy as a tracer of its gas mass content. The basis of the method relies on the fact that the long wavelength Rayleigh–Jeans (RJ) tail of dust emission is predominantly optically thin and can therefore be used to probe the total dust mass of the galaxy, if the dust emissivity per unit mass is known. The gas mass can then be derived assuming a gas-to-dust mass ratio.
Under these conditions and starting from the expression of a MBB (Paper II and Berta et al. 2013), in the RJ regime the dust emission of a galaxy can be approximated as:
 (8)
(8)
where κdust(ν) = κ0(ν/ν0)β is the dust mass absorption coefficient in units of m2 kg−1, β is the emissivity index of the dust emission, Mdust the dust mass in kg, Tdust the dust temperature in K, and therefore LRJ(ν) is in erg s−1 Hz−1.
Given the gas-to-dust mass ratio δGDR (Eq. (10)), we define κH = δGDR/κdust in units of kg m−2 (e.g. Dunne et al. 2022). Adopting ν0 = ν850 = 353 GHz as reference frequency (corresponding to a wavelength of 850 μm) to evaluate κH = κ850, the conversion factor can be written as:
 (9)
(9)
that enables the computation of Mmol, once the 850 μm rest-frame luminosity of the galaxy is known.
Scoville et al. (2014, 2016) adopted a fixed dust temperature of 25 K to apply the k-correction to the observed flux densities and derive the 850 μm rest-frame luminosity of their galaxies. They also stressed that the temperature involved in these equations ought to be a mass-weighted temperature, rather than the commonly used luminosity-weighted temperature for example derived with a single-temperature MBB. On the other hand, Harrington et al. (2021) found that for SMGs a single temperature MBB fit properly reproduces the SED and the dust temperatures thus derived for these objects are consistent with the mass-weighted estimate derived from multi-temperature fits (see also Dunne et al. 2022). The consequences of adopting a fixed dust temperature rather than the actual temperature obtained with a dedicated SED fitting for each galaxy are discussed by Dunne et al. (2022). Scoville et al. (2016) also point out the necessity of applying a further correction ΓRJ to this conversion, to take into account possible deviations from the proper RJ emission law at the wavelength where Eq. (8) is evaluated. Similar caveats were also highlighted by Genzel et al. (2015). We defer the reader to all these works for more details on the method and on its application. More recently, Tacconi et al. (2020) and Dunne et al. (2022) validated the method and showed how the results are consistent with those of more time consuming spectroscopy, once the relative conversion factors are properly cross-calibrated.
Here we apply the 850 μm continuum approach to the z-GAL galaxies, making full use of the SED fitting presented in Paper II to evaluate the 850 μm rest-frame luminosity from the best fit models. It is important to note that the z-GAL sources benefit from continuum detections that cover wavelengths around and beyond 850 μm in the rest frame for the majority of the sources and therefore allow for an interpolation between the Herschel/SPIRE, SCUBA-2, and NOEMA data, rather than relying on extrapolations. Following the success demonstrated for 12CO and [CI], we adopt the continuum conversion factor by Dunne et al. (2022): α850 = 6.9 ± 0.1 × 10¹² W Hz−1  . In their cross-calibration of gas tracers, these authors did not adopt a fixed dust temperature template to apply the k-correction, but instead used the results of SED fitting for each galaxy in their sample, similarly to what was done for the z-GAL data (Paper II). Table B.2 includes the derived values of μMmol, 850 μm in Col. 5.
Figure 8 compares the Mmol thus obtained to the one derived from the detected 12CO transitions. The 850 μm method produces results consistent to 12CO within ±50% for only roughly half of the z-GAL sources (i.e. those within the dotted lines in Fig. 8). The median ratio of Mmol from the 850 μm continuum and from 12CO is 1.23 with a median absolute deviation of 0.51, significantly larger than what is expected from the uncertainty on α850 given by Dunne et al. (2022). We investigated possible reasons for this relatively poor overlap, but we did not find any evident dependencies of the ratio Mmol(850 μm)/Mmol(12CO) on redshift, L(IR), line’s FWHM or  /FWHM.
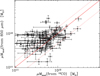 |
Fig. 8. Comparison between the molecular gas masses derived from the 850 μm continuum and from the 12CO emission lines for the z-GAL sources where both tracers are available. No correction for amplification was applied. The solid red line shows the 1:1 locus and the dotted lines the ±50% region around it. |
The consistency between the gas mass estimates based on 12CO and [CI] raises the suspicion that the cause of this large scatter lies in the dust-based method. We highlight that we adopted a specific value of α850 for our entire sample, but the values of α850 found in the literature range from 3.6 to 12 (for a review, see Table 11 of Dunne et al. 2022). Figure 8 might be an indication that the chosen α850 conversion factor might not be commensurate to the physical properties of all z-GAL galaxies. This would somehow not be unexpected, as the sample includes a heterogeneous mix of single lensed sources and interacting pairs, possible main sequence galaxies and starbursts, candidate groups and AGN (Paper IV). Further investigations and higher resolution, deeper observations will be needed to shed more light on each individual object detected by NOEMA.
4.5. Gas to dust ratio
Combining the Mmol derived from the detected 12CO transitions in Sect. 4.2 and Mdust estimated in Paper II through SED fitting, we compute the gas-to-dust ratio of the z-GAL sources:
 (10)
(10)
Dust masses are based on SED fitting including Herschel/SPIRE, SCUBA-2 850 μm (when available) and NOEMA multi-band photometry. In case multiple components with the same redshift were detected by NOEMA for a given Herschel source, Paper II combined the corresponding millimetre continuum fluxes of the different components. A similar approach is followed here for those sources with multiple detections both in the continuum and lines (at the same redshift). Therefore the number of sources retained amounts to 131.
None of the quantities involved has been corrected for the effects of gravitational lensing magnification. In other words, it is assumed that the continuum dust emission – on which the derivation of Mdust is based – and the detected lines defining Mmol are affected by the same magnification and that possible differential effects play a negligible role.
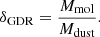
The values of the gas-to-dust ratio of the z-GAL sources are listed in Table B.2, and Fig. 9 shows the distribution of δGDR as a function of redshift. The δGDR ratio of the z-GAL galaxies covers the range from ∼20 to a few 100s, similar to that found by Magdis et al. (2012) and Leroy et al. (2011). The median value of the sample is δGDR = 107, with a median absolute deviation (m.a.d.) of 50. For comparison, using αCO, SB = 1.09 M⊙ (K km s−1 pc2)−1, the median value and m.a.d. would become 29.1 and 13.5, respectively.
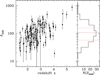 |
Fig. 9. Gas-to-dust mass ratio the z-GAL sources. The dashed red line marks the median δGDR of the sample and the two dotted lines indicate its ± median absolute deviation. |
The actual value of δGDR depends strongly on the underlying assumptions made here, namely the choice of the 12CO conversion factor, which is consistent with MW-like dust and gas properties (Dunne et al. 2022), and the values of the dust absorption coefficient κ(ν) adopted by the MBB SED fitting (Draine et al. 2014, see Paper II). The derivations of these two quantities having been carried out independently of each other, it is worth to note that the median δGDR of our sample (obtained with our choice of αCO = 4.0 M⊙ (K km s−1 pc2)−1) is consistent with that of main sequence star-forming galaxies of near-solar metallicity (e.g. Tacconi et al. 2020; Magdis et al. 2012; Leroy et al. 2011).
5. Integrated Kennicutt-Schmidt relation
Combining the 12CO line measurements obtained here and the continuum dust results of Paper II, the relation between the 12CO(1−0) line luminosity and the integrated IR emission is shown in Fig. 10, assuming that – in case of gravitational lensing – the 12CO and the FIR-mm continuum emission are co-spatial and similarly magnified. Based on this assumption, accounting for a magnification μ would shift the affected data points along the diagonal of Fig. 10.
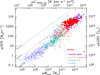 |
Fig. 10. Integrated Kennicutt-Schmidt relation, in terms of the measured luminosities (top and right axes) and of the molecular gas mass and star formation rate (bottom and left axes). The red filled circles represent the z-GAL sources, including the Pilot Programme. The open red symbol and error bar in the bottom-right corner represent the typical (median) z-GAL uncertainties. The dotted lines represent the loci of constant depletion timescales (τdep = 10 Myr, 100 Myr and 1 Gyr). The literature data to which the z-GAL sources are compared include: at z < 0.5 the sources studied by Combes et al. (2011, 2013), Chung et al. (2009), Geach et al. (2011), Solomon et al. (1997), and Villanueva et al. (2017), including local ULIRGs; at z > 0.5, the sources by Alaghband-Zadeh et al. (2013), Aravena et al. (2016, 2014, 2013), Bakx et al. (2020b), Bothwell et al. (2017), Bothwell et al. (2013), Carilli et al. (2010), Dannerbauer et al. (2019), Decarli et al. (2016, 2019), Dunne et al. (2021, 2020), Fujimoto et al. (2017), Freundlich et al. (2019), Genzel et al. (2015, 2003), George et al. (2013), Hagimoto et al. (2023), Harris et al. (2012, 2010), Ivison et al. (2013, 2011, 2010), Penney et al. (2020), Riechers et al. (2020, 2011b), Rudnick et al. (2017), Sharon et al. (2016), Tacconi et al. (2018, 2013), Thomson et al. (2012), Valentino et al. (2018), Wang et al. (2018), and Yang et al. (2017). Lensed objects at z > 1.5 are marked with empty star symbols. |
This representation of the data is equivalent to the Schmidt-Kennicutt (KS; Schmidt 1959; Kennicutt 1998a) relation, integrated over the whole extent of our sources. Although it is possible to evaluate the angular extent of the 12CO and of the sub-millimetre emission of some of these objects (Paper II and Paper IV), it is virtually impossible to retrieve such information for the low resolution Herschel/SPIRE continuum measurements. Therefore only the integrated KS space is considered here.
We also compare the z-GAL results to a collection of sources found in the literature, split by redshift (see caption of Fig. 10 for a list of references). Lensed sources at z > 1.5 are marked with empty star symbols. When needed, the molecular gas mass, SFR and other quantities of the sources found in the literature have been recomputed using the same assumptions adopted for the z-GAL sample, including the αCO normalisation, the LIR-to-SFR conversion modified for a Chabrier IMF, and the cosmological parameters.
The z-GAL sources sample well the brightest luminosity (μLIR > 1013 L⊙) and most massive (Mmol > 1011 M⊙) end of the KS plane, bridging the loci of high-z lensed galaxies and unlensed ULIRGs. Their depletion timescales tend to be on average shorter than those of unlensed samples of more modest luminosity and lower redshift.
Schematically, if a galaxy would consume the entirety of its molecular gas fuel to form stars in one single event at the rate derived from Herschel and NOEMA data, it would deplete its reservoir in a time given by:
 (11)
(11)
called depletion timescale, independent from the magnification μ. The rate of star formation is computed as SFR = 1.09 × 10⁻¹⁰LIR (Kennicutt 1998b, after modification for a Chabrier 2003 IMF), with the IR luminosity integrated over the wavelength range 8 − 1000 μm, and expressed in units of L⊙. If Mmol is expressed in units of M⊙ and the SFR in M⊙ yr−1, then τdep has naturally units of yr.
The derived values of τdep are reported in Table B.2 and shown in Fig. 11. The evolutionary trends of τdep as a function of redshift are also shown, as determined by Saintonge et al. (2013) and Tacconi et al. (2020) for MS galaxies (black lines and grey shaded area), outliers of the MS (often associated with starburst galaxies, dashed blue and dotted purple lines), and below-MS galaxies (passive objects, long-dash red line). The majority of the z-GAL sources have a depletion timescale in the range between 0.1 and 1.0 Gyr: they occupy part of the main sequence of star formation and the locus of starburst outliers. The tail of the most powerful z-GAL sources extends down to τdep < 108 yr, where the most intense bursts of star formation are recorded.
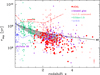 |
Fig. 11. Depletion timescale as a function of redshift. The red filled circles represent the z-GAL sources, including the Pilot Programme. The small red symbol and error bar in the bottom-right corner represent the typical uncertainty on τdep. The grey shaded area is the trend found by Saintonge et al. (2013). The different lines represent the trends found by Tacconi et al. (2020) for MS galaxies (δMS = ±0.6 dex, black solid line), starburst galaxies (δMS > 0.6 dex, blue dashed line), extreme starbursts (δMS > 1.2 dex, purple dotted line), and below-MS galaxies (δMS < 0.4 dex, red long-dashed line). The collection of data from the literature includes the same data as in Fig. 10 (see references in the caption). |
6. Stellar masses: Inversion of scaling relations
The end product of star formation in a galaxy is the mass locked into stars, and is measured by its stellar mass M*. The relation between SFR and M* of a galaxy is an indicator of its currently undergoing activity: the position of the source with respect to the so called main sequence of star formation in the M* − SFR plane indicates whether the object is sustained by secular star formation, is undergoing a powerful starburst event, or is a red and dead passive galaxy.
The data currently available for the z-GAL sources do not allow us to determine their stellar mass directly. Shorter wavelength observations in the rest-frame near-IR and optical domains would be the ideal tool to this aim (e.g. Berta et al. 2004). However, estimating M* is also possible by using the values of τdep, as derived in Sect. 5.
Scaling relations between the depletion timescale, τdep, of a galaxy and its stellar mass content, M*, star formation rate, SFR, and position in the M*-SFR plane with respect to the main sequence, as a function of redshift, were first derived by Genzel et al. (2015), Scoville et al. (2016, 2017), and Tacconi et al. (2018) combining observations of the GOODS, COSMOS and other fields that benefit from extensive multi-wavelength coverage. Combining 12CO data, Herschel extragalactic surveys and optical-NIR follow-ups, Tacconi et al. (2020) used 2052 star-forming galaxies in the redshift range 0 < z < 5.3 to refine these scaling relations, as described by the following equation:
 (12)
(12)
Appendix A describes the best fit parameters A, B, C, D (Tacconi et al. 2020). The term sSFR/sSFR(MS,z,M*) represents the distance of a galaxy from the main sequence of star-forming galaxies at the given redshift z, in terms of the specific star formation rate sSFR = SFR/M*. The adopted MS description is the one derived by Speagle et al. (2014), which has the simple form of a log-linear function of cosmic time t (Appendix A). We defer to Tacconi et al. (2020) for an exhaustive list of the adopted surveys and references.
For the z-GAL sources, the quantities z, τdep, and SFR have been computed from the NOEMA spectral lines and continuum measurements and from the Herschel + SCUBA-2 photometry. We can therefore invert this scaling relation (Eq. (12)) to estimate M* for the z-GAL galaxies. Appendix A describes this inversion and discusses the possible effect of a metallicity-dependent 12CO conversion factor (see also Sect. 4.1). Since some of the sources of our sample are gravitationally lensed, this method can provide an estimate of their stellar mass only modulo a factor μE, with μ being the lens magnification and E = C/(C(0.84+0.026 t)−D) a coefficient related to the inversion of Eq. (12), (t is the age of the Universe at the redshift of the source, expressed in Gyr). For the z-GAL sample, E is in the range 1.15 (at the high-z end) and 1.28 (at low z).
A by-product of this analysis is the distance of each z-GAL galaxy from the MS: Δlog(MS) = log(μSFR/sSFR(MS,z,M*)), also estimated modulo μ. The last three columns of Table B.2 list the results for the three quantities μEM*, E, and Δlog(MS) and Fig. 12 displays the position of the sources in the M*-SFR-z space (left) and in the Δlog(MS) versus μEM* plane (right).
 |
Fig. 12. Analysis of stellar masses, computed by inverting the τdep scaling relation by Tacconi et al. (2020) as explained in Appendix A. Left panel: Position of the z-GAL (and pilot) sources in the SFR vs. M* space. The red solid lines depict the MS of star-forming galaxies (Speagle et al. 2014) and the dotted lines mark the ±0.5 dex region around the MS. Both SFR and M* are determined modulo the unknown magnification factor μ. The arrow in the lower-right panel indicates the effect of applying a magnification correction with μ = 5 and E = 1.2. Right panel: Distance from the MS, Δlog(MS) = log(μSFR/sSFR(MS,z,M*)), as a function of stellar mass, M*. The dotted horizontal lines represent the range ±0.5 dex from the MS (dashed line). The position of z-GAL galaxies is marked with filled circles and literature data are as in Fig. 10. The median uncertainty of the quantities derived for z-GAL galaxies is shown in the bottom left. See Sect. 6 and Appendix A for more details. |
The uncertainty on M* is computed via standard error propagation, taking into account the uncertainties in SFR and τdep, as well as those on the coefficients of the scaling relation. The resulting large error bars are dominated by the τdep term. The arrow in the 4th panel of the M*-SFR diagram shows the consequence of applying a magnification correction with μ = 5 and E = 1.2. This correction is basically parallel to the main sequence because the value of E depends on the MS definition (Appendix A).
According to this analysis, the majority of the selected z-GAL sources lies above the main sequence of star formation, with only 15% and 25% of them having Δlog(MS)≤ ± 0.3 or 0.5 dex, respectively, in line with the analysis of the depletion times scales as a function of redshift shown in Fig. 11. The stellar masses μM* derived with this method are distributed in the range from few 1010 to over 1012 M⊙. These extreme values strongly depend on the possible gravitational lensing amplification μ and on the adopted parametrisation of the MS (Eqs. (12) and (A.2)).
The distribution of sources as a function of distance from the MS and of M* (right-hand diagram in Fig. 12) reveals a strong selection effect for the z-GAL galaxies. Because of the very bright Herschel 500 μm flux cut and the peaked redshift distribution, our sources occupy a tight locus that consists of powerful starbursts at low masses and intersects the MS only at the high mass end. Arguably, the largest lensing magnification corrections occur for galaxies with the largest apparent stellar masses.
High resolution, deeper observations are required to estimate the value of μ for each source, by means of lens modelling. Future optical-NIR data, also at high angular resolution (in particular with JWST), will sample the stellar emission of these sources and will deblend them from the possible foreground lens. At the same time, optical-NIR spectroscopy will help to constrain also the metallicity of these sources. The combination of these three pieces of information will shed light on the actual stellar mass of the z-GAL sources and will be the final test for the scaling inversion method pioneered here.
7. Summary and concluding remarks
In this paper we presented a detailed analysis of the z-GAL sample, based on NOEMA millimetre observations of both dust continuum and lines emission, and comprising 165 individual sources with robust spectroscopic redshift (Paper I and Neri et al. 2020). The detected spectral emission lines include 12CO, H2O, and [CI] transitions; 81% of the sources have two 12CO lines detected, while 8% have three. By combining the spectral information with the continuum results presented in Paper II, we derived the properties of the molecular gas of the sample and constrained the physical nature of these sources. The main findings of this study are as follows:
-
The 12CO line luminosity ratios of the z-GAL sample and their average SLED normalised by LIR have shown that the 12CO ladder on average resembles that of high-redshift SMGs and of the local ULIRG Arp 220, that are powered by bursty star formation (Carilli & Walter 2013; Yang et al. 2017; Rangwala et al. 2011). The analysis of the SLEDs of seven individual z-GAL sources with three 12CO transitions detected by NOEMA shows that the molecular gas temperature is in the range 100–250 K and that its density is between 103.3 and 104.0 cm−3, consistent with the values found in other high-redshift SMGs (Yang et al. 2017; Cañameras et al. 2018; Harrington et al. 2021; Stanley et al. 2023).
-
In seven z-GAL sources the para-H2O (211−202) transition has been detected. Including these sources in the water versus LIR correlation, we derive
 , slightly shallower than previous findings (e.g. Yang et al. 2016), but in agreement within the uncertainties of the slope.
 -
The molecular gas mass of the z-GAL sources has been computed from their estimated 12CO(1−0) luminosities, using a conversion factor αCO = 4.0 M⊙ (K km s−1 pc2)−1 (following Dunne et al. 2022). The available 12CO transitions have been translated to the (1 − 0) transition by adopting typical line luminosity ratios of SMGs (Carilli & Walter 2013). The different 12CO transitions available in z-GAL produce similar results. The derived masses cover the range μMmol = 1011 to few 1012 M⊙.
-
In parallel, molecular gas masses have also been computed from the available [CI] transitions and from the 850 μm rest-frame continuum. The former produces an estimate of Mmol consistent with 12CO within a factor ∼1.5. The latter gives results consistent with 12CO within ±50% for only half of the z-GAL sample. This result is not unexpected: the z-GAL selection is a simple 500 μm flux cut combined with a photometric redshift restriction (Paper I) and produces a rather heterogeneous sample in terms of physical properties. Therefore the assumptions of a single value of α850 might not be appropriate for all z-GAL galaxies, considering that the range of values found in the literature is as large as a factor of three (Dunne et al. 2022).
-
Combining the information derived from the 12CO spectra and the NOEMA continuum (Paper II), we derived the gas-to-dust mass ratio, δGDR, of the z-GAL sources. The median value is 107, with a median absolute deviation of 50, consistent with the values of star-forming galaxies of nearly solar metallicity.
-
The same combined analysis of millimetre spectral lines and dust continuum allowed us to build the integrated Kennicutt-Schmidt relation (Schmidt 1959; Kennicutt 1998a) linking the ongoing rate of star formation of the galaxies to their molecular gas reservoir. The ratio of these two quantities is the depletion timescale of the available Mmol at the current SFR and is independent of possible lensing magnification (assuming no differential effects between the dust continuum and the CO emitting regions). The z-GAL sources were found to have τdep in the range between 0.1 and 1.0 Gyr, located between the main sequence, where secular star formation takes place, and the above-MS outliers, where starburst events dominate.
-
Finally, inverting the scaling relations defined by Genzel et al. (2015) and Tacconi et al. (2020) that link depletion timescales to other physical properties of star-forming galaxies, we estimated the stellar mass content of the z-GAL sources, modulo the possible magnification due to gravitational lensing. The results of this new method confirm that the z-GAL sample is mostly composed of sources above the main sequence, powered by strong star formation activity.
Despite the heterogeneity of the z-GAL sample, coming from a simple Herschel/SPIRE flux cut and resulting in a variety of sources including possible proto-cluster members, confirmed AGNs, lensed galaxies, multiple systems, interacting pairs, and isolated HyLIRGs (Papers I, II, IV, and Stanley et al. 2023; Berta et al. 2021; Neri et al. 2020), the common denominator of the z-GAL survey is that the majority of our objects seem to host powerful starbursts destined to exhaust their molecular gas reservoir over timescales of the order of few 108 years.
In addition to the starbursts population, a fraction of the observed objects belong to the main sequence of star formation, where galaxies undergo a more secular evolution rather than being in a short lived starbursting phase. Roughly 25% of the z-GAL sources lie within Δlog(MS) < ± 0.5 dex and ∼15% within 0.3 dex.
The broad band capability of NOEMA and its high spectral sensitivity, enabled by the Polyfix correlator, have uncovered the z-GAL treasure trove and have made possible – along with Herschel and SCUBA-2 data and VLA follow-up observations – to unveil the star formation properties of these galaxies. Deeper and higher-resolution multi-wavelength observations are now required to study these sources in greater detail. Optical and near-IR data will directly constrain the stellar component, thus corroborating, refining or disproving the estimates of M* presented here. Higher resolution sub-millimetre data will enable to verify the lensed nature of many of these galaxies and reconstruct their structure in the source plane via gravitational lens modelling (e.g. Berta et al. 2021; Borsato et al. 2023). Mid-IR spectroscopy (e.g. with the James Webb Space Telescope) will shed light on feedback and gas accretion mechanisms, probe the dissipation of kinetic energy by turbulence, and unveil the properties of the hot molecular gas and warm dust components of the ISM in these galaxies. Finally, X-ray and high-energy data (e.g. coming from the all-sky e-Rosita survey), combined with JVLA follow-up, will ultimately characterise the active galactic nuclei identified in some of the z-GAL galaxies. The many secrets of the z-GAL treasure trove are still to be unveiled.
Acknowledgments
We are thankful to the anonymous referee for their useful suggestions that helped to improve the content of this paper, and to L. Tacconi and R. Genzel for insightful discussions about scaling relations. We recognise the essential work of the z-GAL Cat Team and Tiger Team, who performed the calibration, reduction and delivery of the z-GAL data. The authors would like to thank I. Cortzen and C. Herrera for their contribution in the early stages of the project and wish them success in the new career. SB thanks GN’R for accompanying him during the intense z-GAL analysis times. We also highlight the inspiring role of Jacques de Chabannes, seigneur de La Palisse, and of Jonathan Livingston Seagull. This work is based on observations carried out under project numbers M18AB and subsequently D20AB, with the IRAM NOEMA Interferometer. IRAM is supported by INSU/CNRS (France), MPG (Germany) and IGN (Spain). The authors are grateful to IRAM for making this work possible and for the continuous support that they received over the past four years to make this large programme a success. The authors are also grateful to the IRAM director for approving the DDT proposal that enabled to complete the survey. This work benefited from the support of the project z-GAL ANR-AAPG2019 of the French National Research Agency (ANR). AJB and AJY acknowledge support from the National Science Foundation grant AST-1716585. AN acknowledges support from the Narodowe Centrum Nauki (UMO-2020/38/E/ST9/00077). CY acknowledges support from ERC Advanced Grant 789410. DAR acknowledges support from the National Science Foundation under grant numbers AST-1614213 and AST-1910107 and from the Alexander von Humboldt Foundation through a Humboldt Research Fellowship for Experienced Researchers as well as from the Deutsche Forschungsgemeinschaft (DFG) through SFB 956. HD acknowledges financial support from the Agencia Estatal de Investigación del Ministerio de Ciencia e Innovación (AEI-MCINN) under grant (La evolución de los cíumulos de galaxias desde el amanecer hasta el mediodía cósmico) with reference (PID2019-105776GB-I00/DOI:10.13039/501100011033) and acknowledges support from the ACIISI, Consejería de Economía, Conocimiento y Empleo del Gobierno de Canarias and the European Regional Development Fund (ERDF) under grant with reference PROID2020010107. RJI acknowledges funding by the Deutsche Forschungsgemeinschaft (DFG, German Research Foundation) under Germany’s Excellence Strategy – EXC-2094 – 390783311. SJ is supported by the European Union’s Horizon Europe research and innovation programme under the Marie Skłodowska-Curie grant agreement No. 101060888. SS was partly supported by the ESCAPE project. ESCAPE – The European Science Cluster of Astronomy & Particle Physics ESFRI Research Infrastructures has received funding from the European Union’s Horizon 2020 research and innovation programme under Grant Agreement no. 824064. TJLCB acknowledges support from NAOJ ALMA Scientific Research Grant Nos. 2018-09B and JSPS KAKENHI No. 17H06130, 22H04939, and 22J21948.
References
- Alaghband-Zadeh, S., Chapman, S. C., Swinbank, A. M., et al. 2013, MNRAS, 435, 1493 [Google Scholar]
- Aravena, M., Murphy, E. J., Aguirre, J. E., et al. 2013, MNRAS, 433, 498 [NASA ADS] [CrossRef] [Google Scholar]
- Aravena, M., Hodge, J. A., Wagg, J., et al. 2014, MNRAS, 442, 558 [Google Scholar]
- Aravena, M., Spilker, J. S., Bethermin, M., et al. 2016, MNRAS, 457, 4406 [Google Scholar]
- Aussel, H., Cesarsky, C. J., Elbaz, D., & Starck, J. L. 1999, A&A, 342, 313 [Google Scholar]
- Bakx, T. J. L. C., Eales, S. A., Negrello, M., et al. 2018, MNRAS, 473, 1751 [NASA ADS] [CrossRef] [Google Scholar]
- Bakx, T. J. L. C., Eales, S., & Amvrosiadis, A. 2020a, MNRAS, 493, 4276 [NASA ADS] [CrossRef] [Google Scholar]
- Bakx, T. J. L. C., Dannerbauer, H., Frayer, D., et al. 2020b, MNRAS, 496, 2372 [NASA ADS] [CrossRef] [Google Scholar]
- Berta, S., Fritz, J., Franceschini, A., Bressan, A., & Lonsdale, C. 2004, A&A, 418, 913 [NASA ADS] [CrossRef] [EDP Sciences] [Google Scholar]
- Berta, S., Lutz, D., Santini, P., et al. 2013, A&A, 551, A100 [NASA ADS] [CrossRef] [EDP Sciences] [Google Scholar]
- Berta, S., Lutz, D., Genzel, R., Förster-Schreiber, N. M., & Tacconi, L. J. 2016, A&A, 587, A73 [NASA ADS] [CrossRef] [EDP Sciences] [Google Scholar]
- Berta, S., Young, A. J., Cox, P., et al. 2021, A&A, 646, A122 [CrossRef] [EDP Sciences] [Google Scholar]
- Béthermin, M., Daddi, E., Magdis, G., et al. 2015, A&A, 573, A113 [Google Scholar]
- Bigiel, F., Leroy, A., Walter, F., et al. 2008, AJ, 136, 2846 [NASA ADS] [CrossRef] [Google Scholar]
- Bigiel, F., Leroy, A. K., Walter, F., et al. 2011, ApJ, 730, L13 [NASA ADS] [CrossRef] [Google Scholar]
- Blain, A. W., Smail, I., Ivison, R. J., Kneib, J. P., & Frayer, D. T. 2002, Phys. Rep., 369, 111 [Google Scholar]
- Bolatto, A. D., Wolfire, M., & Leroy, A. K. 2013, ARA&A, 51, 207 [CrossRef] [Google Scholar]
- Boogaard, L. A., van der Werf, P., Weiss, A., et al. 2020, ApJ, 902, 109 [NASA ADS] [CrossRef] [Google Scholar]
- Borsato, E., Marchetti, L., Negrello, M., et al. 2023, MNRAS, submitted [Google Scholar]
- Bothwell, M. S., Smail, I., Chapman, S. C., et al. 2013, MNRAS, 429, 3047 [Google Scholar]
- Bothwell, M. S., Aguirre, J. E., Aravena, M., et al. 2017, MNRAS, 466, 2825 [Google Scholar]
- Bouché, N., Dekel, A., Genzel, R., et al. 2010, ApJ, 718, 1001 [Google Scholar]
- Bourne, N., Dunlop, J. S., Merlin, E., et al. 2017, MNRAS, 467, 1360 [NASA ADS] [Google Scholar]
- Bouwens, R. J., Aravena, M., Decarli, R., et al. 2016, ApJ, 833, 72 [NASA ADS] [CrossRef] [Google Scholar]
- Bouwens, R., González-López, J., Aravena, M., et al. 2020, ApJ, 902, 112 [NASA ADS] [CrossRef] [Google Scholar]
- Brinchmann, J., & Ellis, R. S. 2000, ApJ, 536, L77 [NASA ADS] [CrossRef] [Google Scholar]
- Bussmann, R. S., Pérez-Fournon, I., Amber, S., et al. 2013, ApJ, 779, 25 [NASA ADS] [CrossRef] [Google Scholar]
- Bussmann, R. S., Riechers, D., Fialkov, A., et al. 2015, ApJ, 812, 43 [Google Scholar]
- Cañameras, R., Yang, C., Nesvadba, N. P. H., et al. 2018, A&A, 620, A61 [Google Scholar]
- Carilli, C. L., & Walter, F. 2013, ARA&A, 51, 105 [NASA ADS] [CrossRef] [Google Scholar]
- Carilli, C. L., Daddi, E., Riechers, D., et al. 2010, ApJ, 714, 1407 [NASA ADS] [CrossRef] [Google Scholar]
- Casey, C. M., Narayanan, D., & Cooray, A. 2014, Phys. Rep., 541, 45 [Google Scholar]
- Chabrier, G. 2003, ApJ, 586, L133 [NASA ADS] [CrossRef] [Google Scholar]
- Chung, E. J., Rhee, M.-H., Kim, H., et al. 2009, ApJS, 184, 199 [NASA ADS] [CrossRef] [Google Scholar]
- Combes, F. 2000, in Molecular Hydrogen in Space, ed. G. Pineau Des Forets, 275 [CrossRef] [Google Scholar]
- Combes, F. 2018, A&ARv, 26, 5 [NASA ADS] [CrossRef] [Google Scholar]
- Combes, F., García-Burillo, S., Braine, J., et al. 2011, A&A, 528, A124 [NASA ADS] [CrossRef] [EDP Sciences] [Google Scholar]
- Combes, F., García-Burillo, S., Braine, J., et al. 2013, A&A, 550, A41 [NASA ADS] [CrossRef] [EDP Sciences] [Google Scholar]
- Conley, A., Cooray, A., Vieira, J. D., et al. 2011, ApJ, 732, L35 [NASA ADS] [CrossRef] [Google Scholar]
- Cox, P., Krips, M., Neri, R., et al. 2011, ApJ, 740, 63 [NASA ADS] [CrossRef] [Google Scholar]
- Cox, P., Neri, R., Berta, S., et al. 2023, A&A, 678, A26 (Paper I) [Google Scholar]
- Daddi, E., Dickinson, M., Morrison, G., et al. 2007, ApJ, 670, 156 [NASA ADS] [CrossRef] [Google Scholar]
- Daddi, E., Elbaz, D., Walter, F., et al. 2010, ApJ, 714, L118 [NASA ADS] [CrossRef] [Google Scholar]
- Danielson, A. L. R., Swinbank, A. M., Smail, I., et al. 2017, ApJ, 840, 78 [NASA ADS] [CrossRef] [Google Scholar]
- Dannerbauer, H., Harrington, K., Díaz-Sánchez, A., et al. 2019, AJ, 158, 34 [Google Scholar]
- Decarli, R., Walter, F., Aravena, M., et al. 2016, ApJ, 833, 70 [NASA ADS] [CrossRef] [Google Scholar]
- Decarli, R., Walter, F., Gónzalez-López, J., et al. 2019, ApJ, 882, 138 [Google Scholar]
- Downes, D., & Solomon, P. M. 1998, ApJ, 507, 615 [NASA ADS] [CrossRef] [Google Scholar]
- Draine, B. T., Aniano, G., Krause, O., et al. 2014, ApJ, 780, 172 [Google Scholar]
- Dudzevičiūtė, U., Smail, I., Swinbank, A. M., et al. 2020, MNRAS, 494, 3828 [Google Scholar]
- Dunlop, J. S., McLure, R. J., Biggs, A. D., et al. 2017, MNRAS, 466, 861 [Google Scholar]
- Dunne, L., Bonavera, L., Gonzalez-Nuevo, J., Maddox, S. J., & Vlahakis, C. 2020, MNRAS, 498, 4635 [NASA ADS] [CrossRef] [Google Scholar]
- Dunne, L., Maddox, S. J., Vlahakis, C., & Gomez, H. L. 2021, MNRAS, 501, 2573 [NASA ADS] [CrossRef] [Google Scholar]
- Dunne, L., Maddox, S. J., Papadopoulos, P. P., Ivison, R. J., & Gomez, H. L. 2022, MNRAS, 517, 962 [NASA ADS] [CrossRef] [Google Scholar]
- Eales, S., Dunne, L., Clements, D., et al. 2010, PASP, 122, 499 [NASA ADS] [CrossRef] [Google Scholar]
- Eales, S., Smith, M. W. L., Auld, R., et al. 2012, ApJ, 761, 168 [NASA ADS] [CrossRef] [Google Scholar]
- Elbaz, D., Cesarsky, C. J., Fadda, D., et al. 1999, A&A, 351, L37 [NASA ADS] [Google Scholar]
- Elbaz, D., Daddi, E., Le Borgne, D., et al. 2007, A&A, 468, 33 [NASA ADS] [CrossRef] [EDP Sciences] [Google Scholar]
- Elbaz, D., Hwang, H. S., Magnelli, B., et al. 2010, A&A, 518, L29 [NASA ADS] [CrossRef] [EDP Sciences] [Google Scholar]
- Elbaz, D., Dickinson, M., Hwang, H. S., et al. 2011, A&A, 533, A119 [NASA ADS] [CrossRef] [EDP Sciences] [Google Scholar]
- Frayer, D. T., Sanders, D. B., Surace, J. A., et al. 2009, AJ, 138, 1261 [NASA ADS] [CrossRef] [Google Scholar]
- Freundlich, J., Combes, F., Tacconi, L. J., et al. 2019, A&A, 622, A105 [NASA ADS] [CrossRef] [EDP Sciences] [Google Scholar]
- Fu, H., Cooray, A., Feruglio, C., et al. 2013, Nature, 498, 338 [CrossRef] [Google Scholar]
- Fudamoto, Y., Ivison, R. J., Oteo, I., et al. 2017, MNRAS, 472, 2028 [NASA ADS] [CrossRef] [Google Scholar]
- Fujimoto, S., Ouchi, M., Shibuya, T., & Nagai, H. 2017, ApJ, 850, 83 [Google Scholar]
- Geach, J. E., Smail, I., Moran, S. M., et al. 2011, ApJ, 730, L19 [NASA ADS] [CrossRef] [Google Scholar]
- Genzel, R., Baker, A. J., Tacconi, L. J., et al. 2003, ApJ, 584, 633 [NASA ADS] [CrossRef] [Google Scholar]
- Genzel, R., Tacconi, L. J., Gracia-Carpio, J., et al. 2010, MNRAS, 407, 2091 [NASA ADS] [CrossRef] [Google Scholar]
- Genzel, R., Tacconi, L. J., Combes, F., et al. 2012, ApJ, 746, 69 [Google Scholar]
- Genzel, R., Tacconi, L. J., Lutz, D., et al. 2015, ApJ, 800, 20 [Google Scholar]
- George, R. D., Ivison, R. J., Hopwood, R., et al. 2013, MNRAS, 436, L99 [NASA ADS] [CrossRef] [Google Scholar]
- Gómez-Guijarro, C., Riechers, D. A., Pavesi, R., et al. 2019, ApJ, 872, 117 [CrossRef] [Google Scholar]
- González-Alfonso, E., Fischer, J., Aalto, S., & Falstad, N. 2014, A&A, 567, A91 [NASA ADS] [CrossRef] [EDP Sciences] [Google Scholar]
- González-Alfonso, E., Pereira-Santaella, M., Fischer, J., et al. 2021, A&A, 645, A49 [EDP Sciences] [Google Scholar]
- González-Alfonso, E., Fischer, J., Goicoechea, J. R., et al. 2022, A&A, 666, L3 [NASA ADS] [CrossRef] [EDP Sciences] [Google Scholar]
- Guzmán, R., Gallego, J., Koo, D. C., et al. 1997, ApJ, 489, 559 [CrossRef] [Google Scholar]
- Habart, E., Walmsley, M., Verstraete, L., et al. 2005, Space Sci. Rev., 119, 71 [Google Scholar]
- Hagimoto, M., Bakx, T. J. L. C., Serjeant, S., et al. 2023, MNRAS, 521, 5508 [NASA ADS] [CrossRef] [Google Scholar]
- Harrington, K. C., Weiss, A., Yun, M. S., et al. 2021, ApJ, 908, 95 [NASA ADS] [CrossRef] [Google Scholar]
- Harris, A. I., Baker, A. J., Zonak, S. G., et al. 2010, ApJ, 723, 1139 [NASA ADS] [CrossRef] [Google Scholar]
- Harris, A. I., Baker, A. J., Frayer, D. T., et al. 2012, ApJ, 752, 152 [NASA ADS] [CrossRef] [Google Scholar]
- Hatsukade, B., Kohno, K., Yamaguchi, Y., et al. 2018, PASJ, 70, 105 [Google Scholar]
- Hodge, J. A., & da Cunha, E. 2020, R. Soc. Open Sci., 7, 200556 [NASA ADS] [CrossRef] [Google Scholar]
- Ismail, D., Beelen, A., Buat, V., et al. 2023, A&A, 678, A27 (Paper II) [Google Scholar]
- Ivison, R. J., Swinbank, A. M., Swinyard, B., et al. 2010, A&A, 518, L35 [NASA ADS] [CrossRef] [EDP Sciences] [Google Scholar]
- Ivison, R. J., Papadopoulos, P. P., Smail, I., et al. 2011, MNRAS, 412, 1913 [Google Scholar]
- Ivison, R. J., Swinbank, A. M., Smail, I., et al. 2013, ApJ, 772, 137 [NASA ADS] [CrossRef] [Google Scholar]
- Ivison, R. J., Page, M. J., Cirasuolo, M., et al. 2019, MNRAS, 489, 427 [NASA ADS] [CrossRef] [Google Scholar]
- Jarugula, S., Vieira, J. D., Spilker, J. S., et al. 2019, ApJ, 880, 92 [Google Scholar]
- Kennicutt, R. C., Jr. 1989, ApJ, 344, 685 [Google Scholar]
- Kennicutt, R. C., Jr. 1998a, ApJ, 498, 541 [Google Scholar]
- Kennicutt, R. C., Jr 1998b, ARA&A, 36, 189 [NASA ADS] [CrossRef] [Google Scholar]
- Kennicutt, R. C., & Evans, N. J. 2012, ARA&A, 50, 531 [NASA ADS] [CrossRef] [Google Scholar]
- Leroy, A. K., Bolatto, A., Gordon, K., et al. 2011, ApJ, 737, 12 [Google Scholar]
- Lilly, S. J., Carollo, C. M., Pipino, A., Renzini, A., & Peng, Y. 2013, ApJ, 772, 119 [NASA ADS] [CrossRef] [Google Scholar]
- Liu, D., Gao, Y., Isaak, K., et al. 2015, ApJ, 810, L14 [NASA ADS] [CrossRef] [Google Scholar]
- Lonsdale, C. J., Smith, H. E., Rowan-Robinson, M., et al. 2003, PASP, 115, 897 [Google Scholar]
- Lupu, R. E., Scott, K. S., Aguirre, J. E., et al. 2012, ApJ, 757, 135 [Google Scholar]
- Lutz, D., Poglitsch, A., Altieri, B., et al. 2011, A&A, 532, A90 [NASA ADS] [CrossRef] [EDP Sciences] [Google Scholar]
- Madau, P., & Dickinson, M. 2014, ARA&A, 52, 415 [Google Scholar]
- Magdis, G. E., Daddi, E., Béthermin, M., et al. 2012, ApJ, 760, 6 [NASA ADS] [CrossRef] [Google Scholar]
- Magnelli, B., Elbaz, D., Chary, R. R., et al. 2011, A&A, 528, A35 [NASA ADS] [CrossRef] [EDP Sciences] [Google Scholar]
- Magnelli, B., Saintonge, A., Lutz, D., et al. 2012, A&A, 548, A22 [NASA ADS] [CrossRef] [EDP Sciences] [Google Scholar]
- Magnelli, B., Popesso, P., Berta, S., et al. 2013, A&A, 553, A132 [NASA ADS] [CrossRef] [EDP Sciences] [Google Scholar]
- McKee, C. F., & Ostriker, E. C. 2007, ARA&A, 45, 565 [Google Scholar]
- Nagao, T., Maiolino, R., De Breuck, C., et al. 2012, A&A, 542, L34 [NASA ADS] [CrossRef] [EDP Sciences] [Google Scholar]
- Nayyeri, H., Keele, M., Cooray, A., et al. 2016, ApJ, 823, 17 [NASA ADS] [CrossRef] [Google Scholar]
- Negrello, M., Hopwood, R., De Zotti, G., et al. 2010, Science, 330, 800 [NASA ADS] [CrossRef] [Google Scholar]
- Negrello, M., Amber, S., Amvrosiadis, A., et al. 2017, MNRAS, 465, 3558 [NASA ADS] [CrossRef] [Google Scholar]
- Neri, R., Cox, P., Omont, A., et al. 2020, A&A, 635, A7 [NASA ADS] [CrossRef] [EDP Sciences] [Google Scholar]
- Nesvadba, N. P. H., Cañameras, R., Kneissl, R., et al. 2019, A&A, 624, A23 [NASA ADS] [CrossRef] [EDP Sciences] [Google Scholar]
- Noeske, K. G., Weiner, B. J., Faber, S. M., et al. 2007, ApJ, 660, L43 [CrossRef] [Google Scholar]
- Nordon, R., Lutz, D., Shao, L., et al. 2010, A&A, 518, L24 [NASA ADS] [CrossRef] [EDP Sciences] [Google Scholar]
- Oliver, S. J., Bock, J., Altieri, B., et al. 2012, MNRAS, 424, 1614 [NASA ADS] [CrossRef] [Google Scholar]
- Omont, A., Yang, C., Cox, P., et al. 2013, A&A, 551, A115 [NASA ADS] [CrossRef] [EDP Sciences] [Google Scholar]
- Oteo, I., Ivison, R. J., Dunne, L., et al. 2016, ApJ, 827, 34 [Google Scholar]
- Oteo, I., Ivison, R. J., Dunne, L., et al. 2018, ApJ, 856, 72 [Google Scholar]
- Papovich, C., Dole, H., Egami, E., et al. 2004, ApJS, 154, 70 [NASA ADS] [CrossRef] [Google Scholar]
- Papovich, C., Moustakas, L. A., Dickinson, M., et al. 2006, ApJ, 640, 92 [NASA ADS] [CrossRef] [Google Scholar]
- Penney, J. I., Blain, A. W., Assef, R. J., et al. 2020, MNRAS, 496, 1565 [Google Scholar]
- Pereira-Santaella, M., González-Alfonso, E., Usero, A., et al. 2017, A&A, 601, L3 [NASA ADS] [CrossRef] [EDP Sciences] [Google Scholar]
- Pettini, M., & Pagel, B. E. J. 2004, MNRAS, 348, L59 [NASA ADS] [CrossRef] [Google Scholar]
- Planck Collaboration VI. 2020, A&A, 641, A6 [NASA ADS] [CrossRef] [EDP Sciences] [Google Scholar]
- Rangwala, N., Maloney, P. R., Glenn, J., et al. 2011, ApJ, 743, 94 [NASA ADS] [CrossRef] [Google Scholar]
- Reuter, C., Vieira, J. D., Spilker, J. S., et al. 2020, ApJ, 902, 78 [NASA ADS] [CrossRef] [Google Scholar]
- Riechers, D. A., Cooray, A., Omont, A., et al. 2011a, ApJ, 733, L12 [NASA ADS] [CrossRef] [Google Scholar]
- Riechers, D. A., Hodge, J., Walter, F., Carilli, C. L., & Bertoldi, F. 2011b, ApJ, 739, L31 [Google Scholar]
- Riechers, D. A., Bradford, C. M., Clements, D. L., et al. 2013, Nature, 496, 329 [Google Scholar]
- Riechers, D. A., Leung, T. K. D., Ivison, R. J., et al. 2017, ApJ, 850, 1 [Google Scholar]
- Riechers, D. A., Boogaard, L. A., Decarli, R., et al. 2020, ApJ, 896, L21 [NASA ADS] [CrossRef] [Google Scholar]
- Rodighiero, G., Daddi, E., Baronchelli, I., et al. 2011, ApJ, 739, L40 [Google Scholar]
- Rowlands, K., Gomez, H. L., Dunne, L., et al. 2014, MNRAS, 441, 1040 [Google Scholar]
- Rudnick, G., Hodge, J., Walter, F., et al. 2017, ApJ, 849, 27 [NASA ADS] [CrossRef] [Google Scholar]
- Rybak, M., Hodge, J. A., Greve, T. R., et al. 2022, A&A, 667, A70 [NASA ADS] [CrossRef] [EDP Sciences] [Google Scholar]
- Saintonge, A., Lutz, D., Genzel, R., et al. 2013, ApJ, 778, 2 [Google Scholar]
- Santini, P., Maiolino, R., Magnelli, B., et al. 2014, A&A, 562, A30 [NASA ADS] [CrossRef] [EDP Sciences] [Google Scholar]
- Sargent, M. T., Daddi, E., Béthermin, M., et al. 2014, ApJ, 793, 19 [NASA ADS] [CrossRef] [Google Scholar]
- Schmidt, M. 1959, ApJ, 129, 243 [NASA ADS] [CrossRef] [Google Scholar]
- Schöier, F. L., van der Tak, F. F. S., van Dishoeck, E. F., & Black, J. H. 2005, A&A, 432, 369 [Google Scholar]
- Schreiber, C., Pannella, M., Elbaz, D., et al. 2015, A&A, 575, A74 [NASA ADS] [CrossRef] [EDP Sciences] [Google Scholar]
- Scoville, N. 2013, Am. Astron. Soc. Meeting Abstracts, 221, 22103 [NASA ADS] [Google Scholar]
- Scoville, N. Z., Yun, M. S., & Bryant, P. M. 1997, ApJ, 484, 702 [NASA ADS] [CrossRef] [Google Scholar]
- Scoville, N., Aussel, H., Sheth, K., et al. 2014, ApJ, 783, 84 [CrossRef] [Google Scholar]
- Scoville, N., Sheth, K., Aussel, H., et al. 2016, ApJ, 820, 83 [Google Scholar]
- Scoville, N., Lee, N., Vanden Bout, P., et al. 2017, ApJ, 837, 150 [Google Scholar]
- Scoville, N., Faisst, A., Weaver, J., et al. 2023, ApJ, 943, 82 [NASA ADS] [CrossRef] [Google Scholar]
- Sharon, C. E., Riechers, D. A., Hodge, J., et al. 2016, ApJ, 827, 18 [Google Scholar]
- Smail, I., Ivison, R. J., & Blain, A. W. 1997, ApJ, 490, L5 [NASA ADS] [CrossRef] [Google Scholar]
- Sobolev, V. V. 1960, Moving Envelopes of Stars (Cambridge: Harvard University Press) [Google Scholar]
- Solomon, P. M., & Vanden Bout, P. A. 2005, ARA&A, 43, 677 [NASA ADS] [CrossRef] [Google Scholar]
- Solomon, P. M., Downes, D., Radford, S. J. E., & Barrett, J. W. 1997, ApJ, 478, 144 [NASA ADS] [CrossRef] [Google Scholar]
- Speagle, J. S., Steinhardt, C. L., Capak, P. L., & Silverman, J. D. 2014, ApJS, 214, 15 [Google Scholar]
- Stanley, F., Jones, B. M., Riechers, D. A., et al. 2023, ApJ, 945, 24 [NASA ADS] [CrossRef] [Google Scholar]
- Strandet, M. L., Weiss, A., Vieira, J. D., et al. 2016, ApJ, 822, 80 [NASA ADS] [CrossRef] [Google Scholar]
- Swinbank, A. M., Smail, I., Chapman, S. C., et al. 2004, ApJ, 617, 64 [NASA ADS] [CrossRef] [Google Scholar]
- Tacconi, L. J., Genzel, R., Smail, I., et al. 2008, ApJ, 680, 246 [Google Scholar]
- Tacconi, L. J., Neri, R., Genzel, R., et al. 2013, ApJ, 768, 74 [NASA ADS] [CrossRef] [Google Scholar]
- Tacconi, L. J., Genzel, R., Saintonge, A., et al. 2018, ApJ, 853, 179 [Google Scholar]
- Tacconi, L. J., Genzel, R., & Sternberg, A. 2020, ARA&A, 58, 157 [NASA ADS] [CrossRef] [Google Scholar]
- Thomson, A. P., Ivison, R. J., Smail, I., et al. 2012, MNRAS, 425, 2203 [NASA ADS] [CrossRef] [Google Scholar]
- Urquhart, S. A., Bendo, G. J., Serjeant, S., et al. 2022, MNRAS, 511, 3017 [CrossRef] [Google Scholar]
- Valentino, F., Magdis, G. E., Daddi, E., et al. 2018, ApJ, 869, 27 [Google Scholar]
- Valentino, F., Magdis, G. E., Daddi, E., et al. 2020, ApJ, 890, 24 [Google Scholar]
- van der Tak, F. F. S., Black, J. H., Schöier, F. L., Jansen, D. J., & van Dishoeck, E. F. 2007, A&A, 468, 627 [NASA ADS] [CrossRef] [EDP Sciences] [Google Scholar]
- van der Werf, P. P., Isaak, K. G., Meijerink, R., et al. 2010, A&A, 518, L42 [NASA ADS] [CrossRef] [EDP Sciences] [Google Scholar]
- van Dishoeck, E. F., Herbst, E., & Neufeld, D. A. 2013, Chem. Rev., 113, 9043 [Google Scholar]
- Villanueva, V., Ibar, E., Hughes, T. M., et al. 2017, MNRAS, 470, 3775 [NASA ADS] [CrossRef] [Google Scholar]
- Walter, F., Weiß, A., Downes, D., Decarli, R., & Henkel, C. 2011, ApJ, 730, 18 [Google Scholar]
- Walter, F., Decarli, R., Carilli, C., et al. 2012, Nature, 486, 233 [Google Scholar]
- Wang, T., Elbaz, D., Daddi, E., et al. 2018, ApJ, 867, L29 [NASA ADS] [CrossRef] [Google Scholar]
- Wardlow, J. L., Cooray, A., De Bernardis, F., et al. 2013, ApJ, 762, 59 [NASA ADS] [CrossRef] [Google Scholar]
- Weiß, A., Downes, D., Henkel, C., & Walter, F. 2005, A&A, 429, L25 [NASA ADS] [CrossRef] [EDP Sciences] [Google Scholar]
- Weiß, A., Ivison, R. J., Downes, D., et al. 2009, ApJ, 705, L45 [CrossRef] [Google Scholar]
- Weiß, A., De Breuck, C., Marrone, D. P., et al. 2013, ApJ, 767, 88 [Google Scholar]
- Yang, C., Gao, Y., Omont, A., et al. 2013, ApJ, 771, L24 [NASA ADS] [CrossRef] [Google Scholar]
- Yang, C., Omont, A., Beelen, A., et al. 2016, A&A, 595, A80 [NASA ADS] [CrossRef] [EDP Sciences] [Google Scholar]
- Yang, C., Omont, A., Beelen, A., et al. 2017, A&A, 608, A144 [NASA ADS] [CrossRef] [EDP Sciences] [Google Scholar]
- Yang, C., González-Alfonso, E., Omont, A., et al. 2020, A&A, 634, L3 [NASA ADS] [CrossRef] [EDP Sciences] [Google Scholar]
- Zavala, J. A., Casey, C. M., Manning, S. M., et al. 2021, ApJ, 909, 165 [CrossRef] [Google Scholar]
Appendix A: Inversion of the τdep scaling relation in the case of lensed galaxies
Genzel et al. (2015) defined scaling relations linking the depletion timescale and the molecular gas fraction of galaxies to their other fundamental physical properties, redshift z, stellar mass M*, and distance from the main sequence in terms of specific star formation rate sSFR/sSFR(MS, z, M*), (see also Scoville et al. 2016, 2017; Tacconi et al. 2018). Tacconi et al. (2020) refined these scaling relations using 2052 unlensed star-forming galaxies z = 0 and z = 5.3, with stellar masses in the range log M* = 9.0 − 12.2, and distances from the MS between -2.6 and +2.2 dex. The latter parameter indicates that the study has included not only MS galaxies, but also objects below the MS (also considered as ‘passive galaxies’) as well as outliers above the MS (i.e. starbursts).
By means of variables separation, Tacconi et al. (2020) parametrise the depletion timescale of a galaxy as:
 (A.1)
(A.1)
with A = +0.21 ± 0.1, B = −0.98 ± 0.1, C = −0.49 ± 0.03 and D = +0.03 ± 0.04. In this computation, τdep is expressed in units of Gyr and the other quantities in solar units. The parametrisation of the MS adopted in this study is the one defined by Speagle et al. (2014):
 (A.2)
(A.2)
where we have omitted the uncertainties on the parameters for simplicity’s sake. In this expression, t is the age of the Universe in Gyr at the redshift z. Speagle et al. (2014) also provide a parametrisation of the MS as a function of redshift instead of t, but they claim that it is less accurate, in addition of being a more complex mathematical expression. The age of the Universe at a given redshift is the difference between its current age t0 and the look back time from today to that redshift:
 (A.3)
(A.3)
for the cosmology adopted here, and tH being the Hubble time.
The question is if, given the data in hand, it is possible to invert the Tacconi et al. (2020) scaling relation to derive a first, rough estimate of M*. Expliciting Eq. A.1, we obtain:
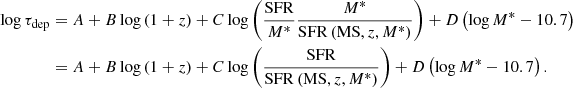
Inserting Eq. A.2 we finally get:

Knowing the values of τdep, z, t(z) and SFR, we obtain an estimate of M* by inverting the last equation:
 (A.4)
(A.4)
Some z-GAL sources are gravitationally lensed (Paper IV and Berta et al. 2021) and SFR is only known modulo their magnification μ. In such a case, Eq. A.4 needs to be adapted: the multiplicative factor μ enters in the logSFR term and consequently an equivalent term must be added in the M* side of the equation:
 (A.5)
(A.5)
We define the extra term E = C/(C(0.84+0.026 t)−D), which for the z-GAL sources has values in the range 1.15 (at the high-z end of the sample) and 1.28 (at low z). Thus this method allows us to estimate the quantity μEM* only, until a measurement of magnification will be available.
A.1. The effect of metallicity
As mentioned in Sect. 4.1, Tacconi et al. (2020) adopted a metallicity-dependent 12CO conversion factor, but the z-GAL data do not include any information about the sample’s metallicity. In the case of dusty star-forming galaxies, such as the z-GAL sources, selected with a bright far-IR flux cut, metallicity is expected to be high and not too dissimilar from the MW value. Berta et al. (2016) and Magdis et al. (2012) studied the metallicity and δGDR of high-z star-forming galaxies detected by Herschel, including MS and BzK galaxies, SMGs and lensed sources. The metallicities of these sources were shown to be nearly solar or slightly sub-solar (down to 0.5 Z⊙; see also Swinbank et al. 2004; Nagao et al. 2012; Rowlands et al. 2014; Yang et al. 2017).
We can evaluate the systematic offset that a sub-solar metallicty (e.g. 0.5 Z⊙) would induce on stellar mass. The metallicity dependence of αCO adopted by Tacconi et al. (2020, 2018) is the geometrical average between the Genzel et al. (2012) and Bolatto et al. (2013) functions. At half-solar metallicity (corresponding to 12 + log(O/H)≃8.4 in the Pettini & Pagel 2004 scale), the conversion factor is 1.73 times larger than at Z⊙, and so is the depletion timescale. Plugging this correction in Eq. A.4, it turns out that the effect on stellar mass would be an increase by ∼0.6 dex at z = 1 − 3, with the exact value of this shift slightly depending on redshift.
Appendix B: Tables including results
Values of  of all detected transitions of the z-GAL sources.
Derived physical properties of the z-GAL sources. Dust modelling has been performed only for single sources or secure lensed multiples, therefore for all other cases several columns are not filled.
All Tables
Median L′(12CO) line luminosity ratios and I(12CO) line intensity ratios, measured for the full z-GAL + pilot sample.
Results of LVG modelling of the 12CO SLEDs of z-GAL individual sources with at least three 12CO transition available.
Derived physical properties of the z-GAL sources. Dust modelling has been performed only for single sources or secure lensed multiples, therefore for all other cases several columns are not filled.
All Figures
|
Fig. 1. 12CO line ratios. Left panels: L′ line luminosity ratios, rij/lm between the transitions 12CO(i − j)/12CO(l − m). The red long-dashed vertical lines mark the median z-GAL ratios (Table 1). The dotted light-blue vertical lines represent the ratios reported for SMGs by CW13; the short dash orange lines the H21 SMG ratios; and the dot-dash green lines the B20 line ratios of less luminous galaxies, complementary to the z-GAL sample. Right panels: Observed intensity I ratios, Rij/lm; the red long-dashed vertical lines mark the median values. |
| In the text | |
|
Fig. 2. LIR-normalised average SLED of the z-GAL sources, compared to high-z SMGs (Carilli & Walter 2013; Yang et al. 2017), local star-forming galaxies (Liu et al. 2015), Arp 220 (Rangwala et al. 2011) and Mrk 231 (van der Werf et al. 2010). In the case of z-GAL data points, if the volume of the |
| In the text | |
|
Fig. 3. Results of LVG fit of the 12CO SLEDs. The best fit model is plotted in black. The blue thin lines represent all models within the ±1σ range of the posterior distribution around the best fit. |
| In the text | |
|
Fig. 4. Correlation between LIR and LH2O(211 − 202) for local (black symbols), high-redshift star-forming SMGs (blue symbols), and QSO/AGN (red). z-GAL sources are marked in green. The fitting of the correlation is represented by the solid orange line. The posterior distribution of the slope is shown in the inset. The plot is adapted from Yang et al. (2016, see references therein). The new fit is performed by including the z-GAL sources (green symbols) as well as the sources from the literature. |
| In the text | |
|
Fig. 5. Derivation of 12CO(1−0) luminosity. Upper panels: Comparison between the values of |
| In the text | |
|
Fig. 6. Distribution of molecular gas masses of the z-GAL sources as a function of redshift, obtained using αCO = 4.0 M⊙ (K km s−1 pc2)−1 (solid black symbols, our choice of preference) and 1.09 (starbursts value, red open symbols), including the contribution of helium. |
| In the text | |
|
Fig. 7. Comparison between the molecular gas masses derived from the [CI](3P1-3P0) and 12CO emission lines for the z-GAL sources where both lines are detected. No correction for amplification was applied to the CO or the [CI] luminosities. Left panel: z-GAL sources only. The solid red line shows the 1:1 locus and the dotted lines the ± 50% region around it. Right panel: Comparison to sources found in the literature with available [CI](3P1-3P0), (Valentino et al. 2018, 2020; Bothwell et al. 2017; Dunne et al. 2021; Alaghband-Zadeh et al. 2013). The axes range covered by the left panel is highlighted. |
| In the text | |
|
Fig. 8. Comparison between the molecular gas masses derived from the 850 μm continuum and from the 12CO emission lines for the z-GAL sources where both tracers are available. No correction for amplification was applied. The solid red line shows the 1:1 locus and the dotted lines the ±50% region around it. |
| In the text | |
|
Fig. 9. Gas-to-dust mass ratio the z-GAL sources. The dashed red line marks the median δGDR of the sample and the two dotted lines indicate its ± median absolute deviation. |
| In the text | |
|
Fig. 10. Integrated Kennicutt-Schmidt relation, in terms of the measured luminosities (top and right axes) and of the molecular gas mass and star formation rate (bottom and left axes). The red filled circles represent the z-GAL sources, including the Pilot Programme. The open red symbol and error bar in the bottom-right corner represent the typical (median) z-GAL uncertainties. The dotted lines represent the loci of constant depletion timescales (τdep = 10 Myr, 100 Myr and 1 Gyr). The literature data to which the z-GAL sources are compared include: at z < 0.5 the sources studied by Combes et al. (2011, 2013), Chung et al. (2009), Geach et al. (2011), Solomon et al. (1997), and Villanueva et al. (2017), including local ULIRGs; at z > 0.5, the sources by Alaghband-Zadeh et al. (2013), Aravena et al. (2016, 2014, 2013), Bakx et al. (2020b), Bothwell et al. (2017), Bothwell et al. (2013), Carilli et al. (2010), Dannerbauer et al. (2019), Decarli et al. (2016, 2019), Dunne et al. (2021, 2020), Fujimoto et al. (2017), Freundlich et al. (2019), Genzel et al. (2015, 2003), George et al. (2013), Hagimoto et al. (2023), Harris et al. (2012, 2010), Ivison et al. (2013, 2011, 2010), Penney et al. (2020), Riechers et al. (2020, 2011b), Rudnick et al. (2017), Sharon et al. (2016), Tacconi et al. (2018, 2013), Thomson et al. (2012), Valentino et al. (2018), Wang et al. (2018), and Yang et al. (2017). Lensed objects at z > 1.5 are marked with empty star symbols. |
| In the text | |
|
Fig. 11. Depletion timescale as a function of redshift. The red filled circles represent the z-GAL sources, including the Pilot Programme. The small red symbol and error bar in the bottom-right corner represent the typical uncertainty on τdep. The grey shaded area is the trend found by Saintonge et al. (2013). The different lines represent the trends found by Tacconi et al. (2020) for MS galaxies (δMS = ±0.6 dex, black solid line), starburst galaxies (δMS > 0.6 dex, blue dashed line), extreme starbursts (δMS > 1.2 dex, purple dotted line), and below-MS galaxies (δMS < 0.4 dex, red long-dashed line). The collection of data from the literature includes the same data as in Fig. 10 (see references in the caption). |
| In the text | |
|
Fig. 12. Analysis of stellar masses, computed by inverting the τdep scaling relation by Tacconi et al. (2020) as explained in Appendix A. Left panel: Position of the z-GAL (and pilot) sources in the SFR vs. M* space. The red solid lines depict the MS of star-forming galaxies (Speagle et al. 2014) and the dotted lines mark the ±0.5 dex region around the MS. Both SFR and M* are determined modulo the unknown magnification factor μ. The arrow in the lower-right panel indicates the effect of applying a magnification correction with μ = 5 and E = 1.2. Right panel: Distance from the MS, Δlog(MS) = log(μSFR/sSFR(MS,z,M*)), as a function of stellar mass, M*. The dotted horizontal lines represent the range ±0.5 dex from the MS (dashed line). The position of z-GAL galaxies is marked with filled circles and literature data are as in Fig. 10. The median uncertainty of the quantities derived for z-GAL galaxies is shown in the bottom left. See Sect. 6 and Appendix A for more details. |
| In the text | |
Current usage metrics show cumulative count of Article Views (full-text article views including HTML views, PDF and ePub downloads, according to the available data) and Abstracts Views on Vision4Press platform.
Data correspond to usage on the plateform after 2015. The current usage metrics is available 48-96 hours after online publication and is updated daily on week days.
Initial download of the metrics may take a while.