Fig. 2.
Download original image
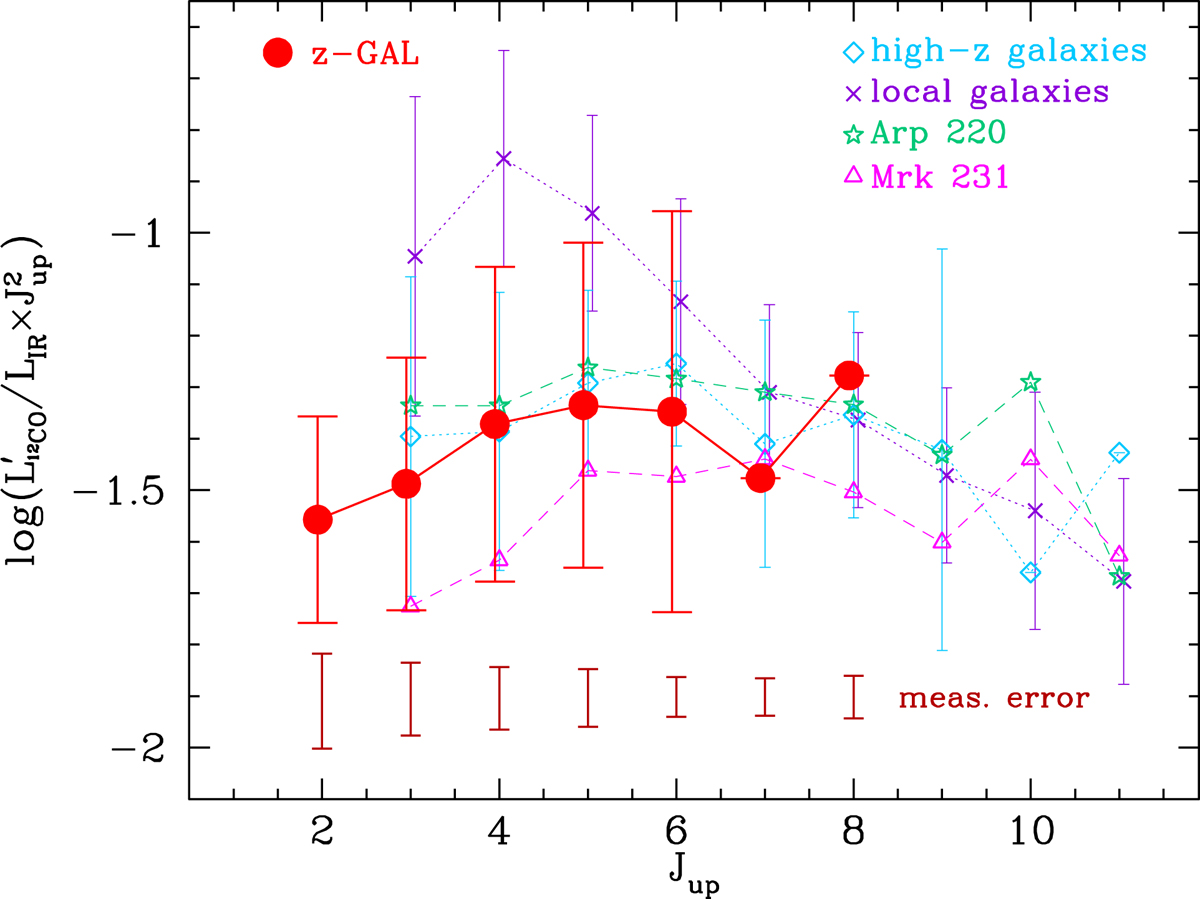
LIR-normalised average SLED of the z-GAL sources, compared to high-z SMGs (Carilli & Walter 2013; Yang et al. 2017), local star-forming galaxies (Liu et al. 2015), Arp 220 (Rangwala et al. 2011) and Mrk 231 (van der Werf et al. 2010). In the case of z-GAL data points, if the volume of the ![]() values is insufficient for a normal distribution fitting, no uncertainty is shown. Error bars are computed as the Gaussian dispersion of the
values is insufficient for a normal distribution fitting, no uncertainty is shown. Error bars are computed as the Gaussian dispersion of the ![]() distribution of each transition (not available for Jup = 7 and 8 because of the small statistics). For comparison, the dark-red error bars on the bottom represent the median uncertainty on
distribution of each transition (not available for Jup = 7 and 8 because of the small statistics). For comparison, the dark-red error bars on the bottom represent the median uncertainty on ![]() based on measurements errors only, as obtained via standard error propagation.
based on measurements errors only, as obtained via standard error propagation.
Current usage metrics show cumulative count of Article Views (full-text article views including HTML views, PDF and ePub downloads, according to the available data) and Abstracts Views on Vision4Press platform.
Data correspond to usage on the plateform after 2015. The current usage metrics is available 48-96 hours after online publication and is updated daily on week days.
Initial download of the metrics may take a while.