| Issue |
A&A
Volume 635, March 2020
|
|
|---|---|---|
| Article Number | A7 | |
| Number of page(s) | 17 | |
| Section | Extragalactic astronomy | |
| DOI | https://doi.org/10.1051/0004-6361/201936988 | |
| Published online | 28 February 2020 | |
NOEMA redshift measurements of bright Herschel galaxies⋆
1
Institut de Radioastronomie Millimétrique (IRAM), 300 Rue de la Piscine, 38400 Saint-Martin-d’Hères, France
e-mail: This email address is being protected from spambots. You need JavaScript enabled to view it.
2
Sorbonne Université, UPMC Université Paris 6 and CNRS, UMR 7095, Institut d’Astrophysique de Paris, 98bis Boulevard Arago, 75014 Paris, France
3
Aix-Marseille Université, CNRS and CNES, Laboratoire d’Astrophysique de Marseille, 38 Rue Frédéric Joliot-Curie, 13388 Marseille, France
4
School of Physics and Astronomy, Cardiff University, The Parade, Cardiff CF24 3AA, UK
5
Division of Particle and Astrophysical Science, Graduate School of Science, Nagoya University, Aichi 464-8602, Japan
6
National Astronomical Observatory of Japan, 2-21-1, Osawa, Mitaka, Tokyo 181-8588, Japan
7
Department of Physics and Astronomy, Rutgers, The State University of New Jersey, 136 Frelinghuysen Road, Piscataway, NJ 08854-8019, USA
8
University of California Irvine, Physics & Astronomy, FRH 2174, Irvine, CA 92697, USA
9
Instituto Astrofísica de Canarias (IAC), 38205 La Laguna, Tenerife, Spain
10
Universidad de La Laguna, Dpto. Astrofísica, 38206 La Laguna, Tenerife, Spain
11
School of Physics and Astronomy, University of Nottingham, University Park, Notthingham NG7 2RD, UK
12
Department of Astronomy, University of Maryland, College Park, MD 20742, USA
13
Instituto Nacional de Astrofísica, Óptica y Electrónica, Astrophysics Department, Apdo 51 y 216, Tonantzintla, Puebla 72000, Mexico
14
European Southern Observatory, Karl-Schwarzschild-Strasse 2, 85748 Garching, Germany
15
Institut for Astronomy, University of Edinburgh, Blackford Hill, Edinburgh EH9 3HJ, UK
16
University of Cape Town, Department of Astronomy, Private Bag X3 Rondebosch, 7701 Cape Town, South Africa
17
Department of Physics and Astronomy, University of the Western Cape, Private Bag X17, Bellville 7535 Cape Town, South Africa
18
Istituto Nazionale di Astrofisica, Istituto di Radioastronomia, Via Gobetti 101, 40129 Bologna, Italy
19
Instituto de Astrofísica e Ciências do Espaço, Tapada da Ajuda, Edifício Leste 1349-018, Lisboa, Portugal
20
Department of Astronomy, Cornell University, Space Sciences Building, Ithaca, NY 14853, USA
21
Max-Planck-Institut für Astronomie, Königstuhl 17, 69117 Heidelberg, Germany
22
Department of Physical Sciences, The Open University, Milton Keynes MK7 6AA, UK
23
National Radio Astronomy Observatory, 520 Edgemont Road, Charlottesville, VA 22903, USA
24
Max-Planck-Institut für Radioastronomie, Auf dem Hügel 69, 53121 Bonn, Germany
25
Leiden University, Leiden Observatory, PO Box 9513, 2300 RA Leiden, The Netherlands
26
European Southern Observatory, Alonso de Córdova 3107, Casilla, 19001 Vitacura, Santiago, Chile
Received:
25
October
2019
Accepted:
5
December
2019
Abstract
Using the IRAM NOrthern Extended Millimeter Array (NOEMA), we conducted a program to measure redshifts for 13 bright galaxies detected in the Herschel Astrophysical Large Area Survey with S500 μm ≥ 80 mJy. We report reliable spectroscopic redshifts for 12 individual sources, which are derived from scans of the 3 and 2 mm bands, covering up to 31 GHz in each band, and are based on the detection of at least two emission lines. The spectroscopic redshifts are in the range 2.08 < z < 4.05 with a median value of z = 2.9 ± 0.6. The sources are unresolved or barely resolved on scales of 10 kpc. In one field, two galaxies with different redshifts were detected. In two cases the sources are found to be binary galaxies with projected distances of ∼140 kpc. The linewidths of the sources are large, with a mean value for the full width at half maximum of 700 ± 300 km s−1 and a median of 800 km s−1. We analyze the nature of the sources with currently available ancillary data to determine if they are lensed or hyper-luminous (LFIR > 1013 L⊙) galaxies. We also present a reanalysis of the spectral energy distributions including the continuum flux densities measured at 3 and 2 mm to derive the overall properties of the sources. Future prospects based on these efficient measurements of redshifts of high-z galaxies using NOEMA are outlined, including a comprehensive survey of all the brightest Herschel galaxies.
Key words: galaxies: high-redshift / galaxies: ISM / gravitational lensing: strong / submillimeter: galaxies / radio lines: ISM
The reduced datacubes and the extracted spectra are only available at the CDS via anonymous ftp to cdsarc.u-strasbg.fr (130.79.128.5) or via http://cdsarc.u-strasbg.fr/viz-bin/cat/J/A+A/635/A7
© R. Neri et al. 2020
 Open Access article, published by EDP Sciences, under the terms of the Creative Commons Attribution License (https://creativecommons.org/licenses/by/4.0), which permits unrestricted use, distribution, and reproduction in any medium, provided the original work is properly cited.
1. Introduction
Some of the most vigorous star formation activity occurred in submillimeter galaxies (SMGs) and other populations of dusty star-forming galaxies (DSFGs) in the early universe (see, e.g., reviews in Blain et al. 2002; Casey et al. 2014), whose rest-frame 8−1000 μm luminosities (LIR) exceed a few 1012 L⊙. Their exact nature is still debated (e.g., Narayanan et al. 2015), although many of them are probably mergers (e.g., Tacconi et al. 2008). Compared to local ultra-luminous infrared galaxies, SMGs are more luminous and several orders of magnitude more numerous. With a median redshift of z ∼ 2.5 (e.g., Danielson et al. 2017), SMGs are most commonly found around the z ∼ 2 − 3 peak of the cosmic star formation rate density (Madau & Dickinson 2014), and therefore play a critical role in the history of cosmic star formation as the locus of the physical processes driving the most extreme phases of galaxy formation and evolution.
The SPIRE instrument (Griffin et al. 2010) on the Herschel Space Observatory (Pilbratt et al. 2010) has increased the number of known SMGs from hundreds to hundreds of thousands through the Herschel Astrophysical Terahertz Large Area Survey (H-ATLAS; Eales et al. 2010), covering an area of 616 deg2; the Herschel Multi-tiered Extragalactic Survey (HerMES; Oliver et al. 2012), covering an area of 430 deg2; and the Herschel Stripe 82 Survey (HerS; Viero et al. 2014) covering an area of 81 deg2. As shown by Negrello et al. (2010), the surface density of unlensed sources tends to zero around flux densities S500 μm ∼ 100 mJy, and most objects that are detectable above this threshold are gravitationally magnified by foreground galaxies. The South Pole Telescope (SPT) cosmological survey, covering an area of 2500 deg2, also revealed a significant population of strongly gravitationally lensed, high-redshift DSFGs (Vieira et al. 2010; Spilker et al. 2016). These and other large-area surveys, like the all-sky Planck-HFI, have therefore enabled the detection of numerous DSFGs that are among the brightest in the sky, including large fractions of the rare high-redshift strongly lensed systems (Negrello et al. 2010, 2017; Wardlow et al. 2013; Bussmann et al. 2013, 2015; Planck Collaboration Int. XXVII 2015; Spilker et al. 2016; Nayyeri et al. 2016; Bakx et al. 2018) and hyper-luminous infrared galaxies (HyLIRGs) with LFIR > 1013 L⊙ (see, e.g., Ivison et al. 2013; Fu et al. 2013; Oteo et al. 2016; Riechers et al. 2017).
Exploiting this richness of data presents us with a tremendous task. In particular, precise spectroscopic measurements of the redshifts of individual sources are essential to derive their nature and physical properties, and to reveal their clustering characteristics, while photometric redshifts are only indicative of a redshift range (Casey et al. 2012; Ivison et al. 2016). Conventional optical and near-infrared spectroscopy using large ground-based telescopes is possible for sources with precise positions available through their faint radio emission, but misses the dustiest bright objects and most of the highest redshift (z > 3) sources, which lack radio counterparts (Chapman et al. 2005). Moreover, in the case of sources that are gravitationally amplified, the optical spectra detect, in most cases, the foreground lensing galaxies rather than the lensed objects. (Sub)millimeter spectroscopy typically searches for CO emission lines, which are unhindered by dust extinction and can be related unambiguously to the (sub)millimeter source. It therefore offers a far better alternative to the imprecise photometric method for deriving secure values for the redshifts.
The spectroscopic method has only recently become competitive with the increased bandwidths of the receivers operating at millimeter and submillimeter facilities. Its power to reliably measure redshifts was first demonstrated in the case of a few SMGs detected by the Submillimetre Common-User Bolometer Array (SCUBA) in the continuum (Smail et al. 1997; Hughes et al. 1998). Their redshifts could only be determined more than a decade later, after various unsuccessful attempts, using the new broadband receivers that became available at the IRAM 30 m telescope (e.g., SMMJ14009+0252: Weiß et al. 2009) at the Plateau de Bure interferometer (e.g., HDF.850.1: Walter et al. 2012) and at the Green Bank Telescope (GBT) for various SMGs (e.g., Swinbank et al. 2010; Harris et al. 2010). Subsequent broadband observations with the Zpectrometer on the GBT (Harris et al. 2012), with Z-Spec on the Caltech Submillimeter Observatory (Lupu et al. 2012), with the Combined Array for Research in Millimeter-wave Astronomy (CARMA; Riechers 2011), and recently with EMIR at the IRAM 30 m telescope and VEGAS at the Green Bank Telescope (GBT; Bakx et al., in prep.) enabled the measurement of tens of redshifts for very bright sources selected from the Herschel wide surveys.
Using the Atacama Large Millimeter Array (ALMA), Weiß et al. (2013) presented the first redshift survey for 23 strongly lensed DSFGs selected from the SPT survey. This work was followed by further ALMA observations yielding reliable measurements for redshifts of an additional 15 DSFGs from the SPT sample (Strandet et al. 2016). We note that the SPT-selected galaxies are at significantly higher redshifts (a median of z ∼ 3.9) than the Herschel-selected galaxies (mostly 2 < z < 3 for the sources peaking in the 350 μm band), due to the difference in the frequency bands used in these surveys (see Sect. 4.1). In parallel, a number of bright Herschel sources were observed by our team, with IRAM and other facilities including ALMA, yielding secure redshifts for about 50 sources (see references in Bakx et al. 2018; Nayyeri et al. 2016; Bussmann et al. 2013).
The new NOEMA correlator, with its ability to process a total instantaneous bandwidth of 31 GHz in two frequency settings, alleviates one of the main problems related to the measurement of redshifts of dust-obscured galaxies, namely the large overheads that are currently required in spectral-scan mode. We present here the results of a Pilot Program, whose aim was measuring redshifts for 13 bright SMGs (with S500 μm ≥ 80 mJy) selected from the H-ATLAS survey by performing 3 and 2 mm spectral scans. For 85% of these H-ATLAS sources we obtain reliable redshifts based on the detection of CO emission lines at both 3 and 2 mm, demonstrating that NOEMA is able to efficiently measure redshifts of bright SMGs by scanning the 3 and 2 mm bands. This Pilot Program lays the ground work for a larger ongoing NOEMA program (z-GAL) that will derive spectroscopic redshifts for all the northern and equatorial bright z ≳ 2 galaxies selected from the Herschel surveys (H-ATLAS, HerMES, and HerS) for which no reliable redshifts measurements are available.
The structure of the paper is as follows. In Sect. 2 we describe the sample selection, the observations, and the data reduction. In Sect. 3 we present the main results including the redshift determination, the spectral properties of the sources and their nature, and the properties of the continuum emission. In Sect. 4 we compare the spectroscopic and photometric redshifts, reassess the spectral energy distributions of the targets taking into account the continuum flux densities at 3 and 2 mm, derive dust temperatures and infrared luminosities, discuss the widths of the CO emission lines, present the general properties of the sources (including CO luminosities and gas masses), and discuss the nature of each source, categorizing the lensed and hyper-luminous galaxies. Finally, in Sect. 5 we summarize the main conclusions and outline future prospects.
Throughout this paper we adopt a spatially flat ΛCDM cosmology with H0 = 67.4 km s−1 Mpc−1 and ΩM = 0.315 (Planck Collaboration VI 2018).
2. Sample selection and observations
2.1. Sample selection
The 13 sources of the Pilot Program were selected from the Herschel Bright Sources (HerBS) sample, which contains the 209 galaxies detected in the H-ATLAS survey with S500 μm > 80 mJy and photometric redshifts zphot > 2 (Bakx et al. 2018). Most of these galaxies have been observed at 850 μm using SCUBA-2, and only 22 sources have spectroscopic redshifts (see references in Bakx et al. 2018). We note that the SCUBA-2 flux densities originally reported in Bakx et al. (2018) have recently been revised using the method described in Ivison et al. (2016) and Duivenvoorden et al. (2018), together with the estimated photometric redshifts, as explained in an Erratum to that paper (Bakx et al., in prep.). The SCUBA-2 flux densities and the photometric redshifts zphot listed in Table 1 are the revised values.
Sample.
The selected galaxies are located in the largest wide field observed by Herschel in the northern sky, in the vicinity of the North Galactic Pole (NGP). Measuring 15 × 10 deg2 and centered on [RA = 13h, Dec = 29 deg], the declination of the NGP field is optimal for NOEMA observations, and its size allowed us to group sources during the observations, minimizing per-source overheads (see Sect. 2.2). The NGP field contains 49 high-z sources with S500 μm > 80 mJy; from this list, we extracted 13 sources for which no spectroscopic redshift measurements were available. Six have S500 μm > 100 mJy, completing the redshift determination for sources with S500 μm > 100 mJy (in the NGP field) at zphot > 2. The selected galaxies are therefore in the range 2 ≲ zphot ≲ 3, with flux densities in the range 80 mJy ≲ S500 μm ≲ 130 mJy (Table 1) and apparent far-infrared luminosities in excess of 1013 L⊙ (see Sect. 3 and Table 6).
2.2. Observations
We used NOEMA to observe the 13 selected bright SMGs (see Table 1) in the NGP field and derive their redshifts by scanning the 3 and 2 mm bands to search for at least two emission lines. The observations were carried out under projects W17DM and S18CR (PI: A.Omont) in the 3 mm band with nine antennas, between April 18 and 24, 2018, and on August 6 and 7, 2019, and in the 2 mm band with eight and nine antennas, between May 24 and October 23, 2018. Observing conditions were on average excellent with an atmospheric phase stability of typically 10−40 deg rms and 2−5 mm of precipitable water vapor. The correlator was operated in the low-resolution mode to provide spectral channels with a nominal resolution of 2 MHz. The observation log is presented in Table 2.
Observation log.
The NOEMA antennas are equipped with 2SB receivers that cover a spectral window of 7.744 GHz in each sideband and polarization. Since the two sidebands are separated by 7.744 GHz, two frequency settings are necessary to span a contiguous spectral window of 31 GHz. At 3 mm, we adjusted the spectral survey to cover a frequency range from 84.385 to 115.361 GHz (Table 1). At 2 mm, we then selected two frequency windows that covered as well as possible the candidate redshifts allowed by the emission lines detected at 3 mm (see Table 2). The wide spectral coverage of the NOEMA correlator ensures that a scan of both the 3 and 2 mm spectral windows can detect for every z ≲ 4 source at least one CO emission line, between 12CO (3–2) and 12CO (6–5), in each band, with the exception of a few redshift gaps. The gaps most relevant to the present observations are at 3 mm for 1.733 < z < 1.997, and at 2 mm for 1.668 < z < 1.835. (Fig. 1). The redshift range 1.733 < z < 1.835 was not covered by any of the 3 and 2 mm settings. The spectral coverage of these observations also includes the [CI] (3P1–3P0) fine-structure line (492 GHz rest-frame) and, for sources at z > 3.65, the water para-H2O (211–202) transition (752 GHz rest-frame), both of which were detected in the sources selected for this study (see Sect. 3.1 and Table 4). Based on the redshift range of the sources, other lines of abundant molecules are expected within the frequency range that was surveyed, such as HCO+, HCN, or CN (see, e.g., Spilker et al. 2014); however, no further emission line, in addition to the atomic carbon and water lines, was detected at the current sensitivity of the observations. Exploring both the 3 and 2 mm spectral bands is therefore a prerequisite for detecting at least two CO emission lines in 2 < z < 4 Herschel-selected bright galaxies, such as those selected for the Pilot Program, and deriving reliable spectroscopic redshifts.
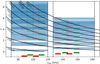 |
Fig. 1. Spectral coverage of the 12CO (solid black) and [CI] (dashed gray) emission lines as a function of redshift in the 3 and 2 mm atmospheric windows in the frequency ranges 84−115 GHz and 130−163 GHz. The bottom colored boxes show the LSB and USB frequency settings (red and green, respectively) (see Table 2). The 2 mm frequency windows were selected to optimally cover the range of spectroscopic redshifts predicted by the 3 mm observations. The dark blue zones identify the redshift ranges where at least two emission lines are detected at 3 or 2 mm with the current settings, while the light blue zones indicate the redshift ranges where only one line is present. This wide frequency range enables the detection of at least one emission line in each band, except for a few small redshifts gaps (see Sect. 2 for details). |
All observations were carried out in track-sharing mode by cyclically switching between galaxies within a track, as was possible due to the proximity of the sources. Two different configurations (C and D) of the array were used, yielding angular resolutions between  and
and  at 2 mm, and
  and ∼6″ at 3 mm. Observations were started by observing all 13 sources in one track in the lower 3 mm frequency setting. Galaxies that did not show a robust line detection were then observed again in the upper 3 mm frequency setting. For every line detection, the most probable redshift was estimated taking into account the photometric redshift. The galaxies were subsequently observed in one of the two 2 mm frequency settings, and when the line was not detected, observed again in the second setting. One example of the frequency settings in the 3 and 2 mm bands is shown in Fig. 2 for the source HerBS-89a.
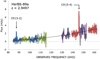 |
Fig. 2. Spectral setup and frequency coverage of the frequency settings in the NOEMA 3 and 2 mm bands for HerBS-89a (see Table 2). The four settings are shown in different colors. The 12CO emission lines detected in HerBS-89a are identified and the solid line is a fit to the underlying dust continuum (see Sect. 3.1 for details on the source). |
For all the sources, the phase and amplitude calibrator was 1328+307 and the flux calibrators MWC349 and LkHα101. The data were calibrated, averaged in polarization, mapped, and analyzed in the GILDAS software package. The absolute flux calibration was estimated to be accurate to within 10%. Source positions are provided with an accuracy of  (Table 3).
Observed continuum positions and flux densities.
3. Results
In the 13 fields observed in the Pilot Program, we detected 12 individual sources both in the continuum and in at least two lines at 3 and 2 mm. We searched for sources in each field up to a distance of 1.5× the half width at half maximum of the 3 and 2 mm primary beams. Sensitivity was the main limitation to searching beyond this area. A source is claimed to be detected if it is detected with at least 5σ in two emission lines, and if the positions of the peaks of the corresponding velocity integrated line maps are coincident within the relative astrometric uncertainties of the data. Figures 3–6 present a representative 2 mm continuum image and the spectra of the two strongest emission lines for each of the sources that were detected in two or more lines, and for which reliable redshifts were derived.
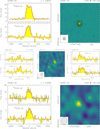 |
Fig. 3. Continuum images at 2 mm and spectra from the 2 mm (top) and 3 mm (bottom) bands for the Herschel bright galaxies HerBS-34, HerBS-43, and HerBS-44. The source name, the continuum frequency, and the derived spectroscopic redshift are indicated along the top of each panel. The emission lines are identified in the upper left corner of each spectrum. The spectra are displayed with the continuum and each emission line is centered at the zero velocity corresponding to its rest frequency. Fits to the continuum and the emission line profiles are shown as dotted and solid red lines, respectively. Continuum contours are plotted starting at 3σ in steps of 5σ and 1σ for HerBS-34 [42] and HerBS-43 [284], respectively, and 2σ in steps of 1σ for HerBS-44 [283], where the numbers in brackets are the 1σ noise levels for each source in μJy beam−1. In the case of HerBS-43, the panels showing the emission lines on the left correspond to the source HerBS-43b, whereas the panels to the right show the spectra of HerBS-43a. The synthesized beam is shown in the lower left corner of each continuum image. |
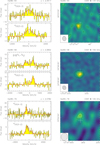 |
Fig. 4. Continuum images at 2 mm (right) and spectra from the 2 mm (top) and 3 mm (bottom) bands of the Herschel bright galaxies HerBS-54, HerBS-58, and HerBS-79. Continuum contours are plotted starting at 2σ in steps of 1σ for HerBS-54 [232], 3σ in steps of 2σ for HerBS-58 [52], and 2σ in steps of 1σ for HerBS-79 [297], where the numbers in brackets are the local noise levels σ for each source in μJy beam−1. See caption of Fig. 3 for further details. |
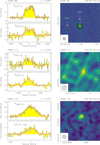 |
Fig. 5. Continuum images at 2 mm (right) and spectra from the 2 mm (top) and 3 mm (bottom) bands of the Herschel bright galaxies HerBS-89, HerBS-113, and HerBS-154. In the case of HerBS-154, one of the emission lines shown is H2O (211–202). Continuum contours are plotted starting at 3σ in steps of 5σ for HerBS-89 [49], and 2σ in steps of 1σ and 2σ for HerBS-113 [308] and HerBS-154 [82], respectively, where the numbers in brackets are the local noise levels σ for each source in μJy beam−1. See caption of Fig. 3 for further details. |
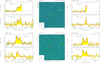 |
Fig. 6. Continuum images at 2 mm (center) and spectra (left and right panels) from the 3 and 2 mm bands for the Herschel bright galaxies with a second source in the field at the same redshift: HerBS-70 at z = 2.31 (top panel) and HerBS-95 at z = 2.97 (bottom panel) (see text for details). The primary beam at 50% is shown with a dashed circle. The panels showing the emission lines on the left correspond to the (a) sources near the phase centers, whereas the panels to the right show the spectra of the (b) companion sources to the west. Continuum contours are plotted starting at 3σ in steps of 5σ for both HerBS-70 [40] and HerBS-95 [43], where the numbers in brackets are the local noise levels σ for each source in μJy beam−1. The spectra are primary beam corrected (see caption of Fig. 3 for further details). |
The fields in Figs. 3–5 all show sources that lack companions. In two of the fields a second source is detected within the primary beam. In the case of HerBS-43 the second galaxy, which is seen in both the continuum and CO emission lines, is at a different redshift; in the case of HerBS-89 a nearby galaxy is only detected in the 2 mm continuum, and is probably unrelated (see Sect. 3.1). Figure 6 displays the sources HerBS-70 and HerBS-95, which are two binary galaxies with separations of ∼16−17″. Additional emission lines detected in some of these sources are displayed in Fig. 7. Finally, two sources, HerBS-173 and HerBS-204, were detected in the 3 mm continuum with low signal-to-noise ratio, and in the case of HerBS-204 in a strong emission line (see Fig. 9); neither of these sources was observed at 2 mm.
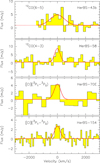 |
Fig. 7. Other emission lines detected in the sources displayed in Figs. 3–6. From top to bottom: HerBS-43b in 12CO (6–5); HerBS-58 in 12CO (4–3); HerBS-70E and HerBS-154 in [CI] (3P1–3P0). The fitted profiles are centered in velocity on the spectroscopic redshifts listed in Table 4. |
The coordinates of the 2 mm continuum emission peaks are given in Table 3 together with information on the continuum flux densities of the sources. Table 4 lists all the emission lines that were detected with their line fluxes and widths and the derived spectroscopic redshifts (zspec). In total, taking into account the companions, we provide continuum fluxes for 18 sources (Table 3) and derive spectroscopic redshifts for 14 of them (Table 4).
Summary of emission line properties and spectroscopic redshifts.
3.1. Individual sources
In this section we provide a detailed description for each source that was observed in the Pilot Program.
– HerBS-34 is a strong continuum source with a flux density of S159 GHz = 3.75 ± 0.04 mJy that is resolved by the  beam with an estimated size of
  (Fig. 3 upper panel). The 12CO (3–2) and double-peaked (5–4) emission lines are strong, with widths of ∼360 km s−1, showing an extended structure with an estimated size that is comparable to that of the continuum emission. The derived redshift is zspec = 2.6637.
– The field of view of HerBS-43 reveals two sources located symmetrically with respect to the phase tracking center that are separated by  (Fig. 3 middle panel):
– The stronger source (HerBS-43a) is located to the west and has a flux density of S149 GHz = 2.6 ± 0.3 mJy. The 12CO (4–3) and (5–4) are very broad (FWHM ∼ 1070 km s−1) and double-peaked. The derived redshift is zspec = 3.2121. The emission in both the line and continuum is unresolved within the 3 mm  beam.
beam.
– The second source to the east (HerBS-43b) is weaker, with S149 GHz = 1.7 ± 0.3 mJy, and is also unresolved. The profile of the 12CO (4–3), (5–4), and (6–5) emission lines (the last line is shown in Fig. 7) is distinct from that of HerBS-43a, also double-peaked but slightly narrower (800 km s−1). The derived redshift is different from HerBS-43a, with zspec = 4.0543. The galaxies HerBS-43a and b are hence unrelated.
– HerBS-44 displays a well-defined 2 mm continuum with S149 GHz = 1.7 ± 0.3 mJy, and strong broad (∼520 km s−1) emission lines of 12CO (3–2) and (5–4), yielding a redshift of zspec = 2.9268 (Fig. 3 bottom panel). The source is resolved in the 12CO (3–2) emission line with an estimated size of  .
.
– HerBS-54 shows a weak 2 mm continuum with a flux density of S134 GHz = 1.6 ± 0.2 mJy (Fig. 4 top panel). The 12CO (3–2) and (4–3) emission lines are very broad (∼1020 km s−1), and the spectroscopic redshift is zspec = 2.4417. The source is resolved in the 12CO (3–2) line with a size of  and a velocity gradient along a position angle of ∼150 deg (Fig. 8).
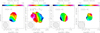 |
Fig. 8. Velocity field maps of HerBS-54, HerBS-58, HerBS-89a, and HerBS-113. The maps were obtained for the emission lines of 12CO (4–3), [CI] (3P1–3P2), and 12CO (5–4) above thresholds of 30%, 20%, 10%, and 20% of the peak emission in the zeroth moment map for HerBS-54, HerBS-58, HerBS-89a, and HerBS-113, respectively. Contours are in units of 50 km s−1 for HerBS-54 and HerBS-113, and of 100 km s−1 for HerBS-58 and HerBS-89a. The synthesized beams are shown in the lower left corner of each panel. |
– HerBS-58 shows slightly extended continuum emission with a flux density of S159 GHz = 1.71 ± 0.05 mJy. The emission lines of 12CO (3–2) and [CI] (3P1–3P0) (Fig. 4 middle panel) are clearly detected. The 12CO (4–3) line is also detected, but shows a lower signal-to-noise ratio (see Table 4); its spectral profile is not shown here, as the line is located at the intersection of two correlator basebands. The lines are double-peaked and very broad with widths of ∼970 km s−1. The redshift of HerBS-58 is zspec = 2.0842 (Fig. 4 middle panel). The line emission is resolved with a size of  , and shows a hint of a velocity gradient in the east–west direction (Fig. 8). The possibility of a binary system cannot be disregarded for this particular object.
– HerBS-70 is a binary system in which both sources are at the same redshift and have a large separation of ∼16 (Fig. 6 upper panel). The eastern source (HerBS-70E) has a 2 mm continuum flux density of S159 GHz = 0.94 ± 0.04 mJy and is resolved with a size of 0.5″. The source to the west (HerBS-70W) is weaker, with a primary beam corrected flux density of S159 GHz = 0.18 ± 0.06 mJy. The source HerBS-70E has strong double-peaked asymmetrical emission lines of 12CO (3–2) and (4–3) with widths of ∼770 km s−1. In contrast, HerBS-70W displays significantly narrower (∼140 km s−1) single-peaked emission lines, suggesting a face-on inclination. Both sources are at the same redshift with zspec = 2.31, implying a projected distance of ∼140 kpc between HerBS-70E and HerBS-70W.
– HerBS-79 shows a weak 2 mm continuum that is barely detected at the sensitivity of the current observations (S149 GHz = 0.8 ± 0.3 mJy). The very broad (∼870 km s−1) emission lines of 12CO (3–2) and (4–3) display similar double-peaked profiles, with the red component being about three times more intense than the blue one (Fig. 4 bottom panel). The derived redshift is zspec = 2.0782. The source is resolved in the 12CO (3–2) emission line with an estimated size of  .
.
– HerBS-89 is a system composed of two objects, of which HerBS-89a is the strongest 2 mm continuum source in the sample, with a flux density of S159 GHz = 4.56 ± 0.05 mJy (Fig. 5 top panel). The 2 mm continuum emission is resolved by the  beam, with an extension of
  . The 12CO (3–2) and (5–4) emission lines are also the broadest in the sample (∼1080 km s−1), displaying a double-peaked profile. The redshift of HerBS-89a is zspec = 2.9497. The CO line emission is also extended and displays an east–west velocity gradient (Fig. 8). Follow-up observations with NOEMA at higher frequency, with an angular resolution of
  , reveal a nearly complete Einstein ring in the 1 mm dust continuum and the 12CO (9–8) and para-H2O (202–111) line emission, showing that HerBS-89a is gravitationally lensed (Berta et al., in prep.). To the east of HerBS-89a is a weak unresolved source (HerBS-89b) with a flux density of S159 GHz = 0.24 ± 0.05 mJy. Although there is no corresponding source in the SDSS catalogue at that position, its authenticity is confirmed by the higher frequency measurements (Berta et al., in prep.). Further observations are needed to constrain the properties of HerBS-89b.
– HerBS-95 is another binary system in which both sources are at the same redshift with a separation of  (Fig. 6 lower panel). The eastern source (HerBS-95E) exhibits a continuum flux density at 2 mm of S159 GHz = 1.52 ± 0.04 mJy and a size of
  , whereas the western source (HerBS-95W) has a primary beam corrected flux density of S159 GHz = 2.28 ± 0.08 mJy. Both sources show strong emission lines of 12CO (3–2) and (5–4), with linewidths of 870 and 540 km s−1 for HerBS-95E and W, respectively. The lines are at nearly the same frequencies, indicating that both galaxies are at a redshift of zspec = 2.97. At this redshift the projected distance between the two galaxies is ∼140 kpc.
– HerBS-113 has a weak 2 mm continuum with a flux density of S149 GHz = 1.4 ± 0.3 mJy (Fig. 5 middle panel). The 12CO (3–2) and (5–4) emission lines are well detected, displaying broad profiles with widths of ∼900 km s−1. Both emission lines are resolved with an elongation along a position angle of 20 deg over a region of ∼1 (Fig. 8). The derived redshift is zspec = 2.7870.
– HerBS-154 is a compact source with a size of  in continuum and line emission (Fig. 5 bottom panel). The source is robustly detected in the continuum with S149 GHz = 1.92 ± 0.04 mJy, and in the lines of 12CO (6–5) and H2O (211–202), and in [CI] (3P1–3P0) (shown in Fig. 7), although with lower signal-to-noise ratio. The spectral profiles, which are single-peaked with linewidths of ∼300 km s−1, yield a redshift of zspec = 3.7070.
– The sources HerBS-173 and HerBS-204 have the weakest 500 μm flux densities in the Pilot Program sample (Table 3).
– HerBS-173 was tentatively detected in the individual 3 mm sidebands. Stacking these sidebands results in a 3 mm flux density of S100 GHz = 0.22 ± 0.03 mJy. However, no emission line was detected at 3 mm and no 2 mm observations were performed. Hereafter, we adopt the photometric redshift zphot = 2.38 (see Table 1).
– In the case of HerBS-204, stacking the line-free part of the 3 mm spectra observed on Aug 6 and 7, 2019, in both sidebands (LSB and USB), reveals a complex source with two continuum emission peaks (HerBS-204E and HerBS-204W) separated by ∼7″ (Fig. 9) and with fluxes of S96 GHz = 0.10 ± 0.03 mJy and S96 GHz = 0.13 ± 0.03 mJy, respectively. In addition, a strong emission line is detected at 102.584 GHz with a linewidth of ∼400 km s−1 and an integrated line flux of 3.9 Jy km s−1 (Table 4). Like the continuum emission, the line emission is extended with two emission peaks separated by  along a position angle of ∼18 deg. Both the continuum and line emission peaks show excellent spatial coincidence. Based on the photometric redshift of zphot = 3.61, this emission line could correspond either to the 12CO (4–3) transition, in which case the source would be at a spectroscopic redshift of zspec = 3.49, or to the 12CO (3–2) transition, in which case zspec = 2.37. The higher value (zspec = 3.49) would imply a dust temperature of 40 K, which is at the high end of the dust temperatures found for all the other sources of the Pilot Program. This suggests the value of zspec = 2.37, for which the estimated dust temperature is 29 K, is the more likely redshift (see Table 5 and footnote). However, further observations are needed to detect a second CO transition and derive a reliable spectroscopic redshift for this source. Based on the photometric redshift and the potential range in the spectroscopic redshift, the projected separation between the two emission peaks corresponds to a linear distance of ∼60 kpc, suggesting that HerBS-204 is a merging system or a gravitationally lensed galaxy rather than an edge-on disk (cf. Emonts et al. 2018).
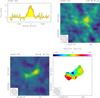 |
Fig. 9. Top panel: integrated spectrum (left) and continuum image (right) for HerBS-204. The continuum contours start at 2σ and are spaced in steps of 1σ = 31 μJy beam−1. Fits to the continuum and the integrated emission line profile are shown as dotted and solid red lines, respectively. Bottom panel: velocity integrated image of the emission line at 102.584 GHz (left) and velocity field map of HerBS-204. The velocity map was obtained for the emission line above a threshold of 20% of the peak emission in the velocity integrated image. Line contours start at 2σ and are shown in steps of 1σ = 0.15 Jy km s−1; velocity contours are in units of 50 km s−1. The synthesized beams are shown in the lower left corners. |
Infrared luminosities, dust masses, dust temperatures, and spectral emissivity indices.
Physical properties of the galaxies.
3.2. Spectroscopic redshifts and emission line properties
For all of the above sources (except HerBS-204 and HerBS-173), we detect at least two emission lines, mostly from 12CO ranging from the (3−2) to the (6−5) transition (Table 4). The CO emission lines are all relatively strong, resulting in signal-to-noise ratios > 5, providing therefore the necessary quality to derive precise and reliable redshifts, as well as significant information about properties of the molecular gas such as morphology, dynamics, and physical conditions. In addition to the CO emission lines, the atomic carbon fine-structure line [CI] (3P1–3P0) is detected in three sources, HerBS-58 (Fig. 4), and HerBS-70E and HerBS-154 (Fig. 7). For HerBS-154 we detected the para-H2O (211–202) transition (see Fig. 5).
It is noteworthy that for the majority of the bright Herschel galaxies observed in the Pilot Program, the widths of the emission lines are large. The derived linewidths are found to be 150 km s−1 < ΔV < 1100 km s−1 with most (53%) of the sources having linewidths in excess of 800 km s−1 (see Table 4 and Fig. 10 showing the distribution of the CO emission linewidths, and further discussion in Sect. 4.4).
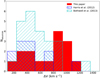 |
Fig. 10. Distribution of the full width at half maximum (FWHM) for the bright Herschel galaxies detected in 12CO described in this paper (solid red histogram) compared to the FWHM of high-z galaxies reported in Bothwell et al. (2013) (cyan right-hatched) and Harris et al. (2012) (blue left-hatched). |
3.3. Continuum
In addition to the emission lines, the continuum flux densities of the sources have been extracted from up to eight available polarization-averaged 7.744 GHz wide sidebands, centered, depending on receiver configuration, on the following frequencies: 88.3, 96.0, 103.7, 111.5, 133.5, 143.2, 149.0, and 158.6 GHz (see Tables 2 and 3). All the sources in the Pilot Program detected in at least two emission lines are also detected in the continuum in at least four sidebands, with three in all eight sidebands (one of which, HerBS-95, being double). The NOEMA continuum flux densities together with the Herschel and SCUBA-2 data are displayed in Fig. 12 for HerBS-58 and HerBS-89a. The NOEMA continuum measurements are summarized in Table 3, where the quoted flux density uncertainties account for both the noise level in the maps and the uncertainty in the absolute flux calibration scale (see Sect. 3). In Table 3, upper limits are given for sources where the continuum is detected with a signal-to-noise ratio < 4.
4. Discussion
In this section we describe the derived properties of the high-z bright Herschel galaxies studied in the Pilot Program.
4.1. Spectroscopic redshifts
The availability of at least two emission lines in the 3 and 2 mm spectral bands allowed us to derive precise redshifts for 85% of the bright high-zHerschel galaxies studied here. The Pilot Program has demonstrated that using the new correlator on NOEMA, unbiased redshift surveys can be performed efficiently using on average 100 minutes of telescope time per source, including overheads. The derived spectroscopic redshifts, zspec, for the 14 galaxies (including the binary sources) in which two or more emission lines are detected are listed in Table 4. The redshift distribution of the Pilot Program sample is displayed in Fig. 11. The redshifts are found to lie between 2.08 < zspec < 4.05, with a median redshift of z = 2.86 ± 0.56 and a tail in the distribution to z > 3. In Fig. 11, we added the redshifts of the 12 H-ATLAS galaxies that were studied by Harris et al. (2012); these sources, which are peaking at 350 μm, like the ones studied here, show a similar distribution to the Pilot Program sample, albeit with a slightly lower median redshift of z = 2.47 ± 0.11.
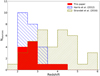 |
Fig. 11. Spectroscopic redshift distribution for the 12 bright Herschel H-ATLAS galaxies of the Pilot Program sample detected in at least two emission lines red filled histogram, (see Table 4). Shown are also the 12 H-ATLAS galaxies with reliable redshifts from Harris et al. (2012) added to the Pilot Program sample (blue left-hatched histogram) and the redshift distribution of the 38 SPT-selected galaxies from Strandet et al. (2016) (green right-hatched histogram). |
Considering the galaxies with redshifts detected by the SPT (Strandet et al. 2016; Weiß et al. 2013), we find that the redshift distributions of the H-ATLAS and SPT-selected galaxies are clearly different (Fig. 11). The SPT galaxies show a flat distribution between z = 2.5 and z = 5.0, the major fraction of the sample being at z > 3 with a median redshift of z = 3.9 ± 0.4. The SPT galaxies were selected from a survey performed at a longer wavelength than H-ATLAS; even though the spectroscopic redshift survey of the H-ATLAS galaxies is still not complete, the difference in redshifts between the SPT and H-ATLAS selected galaxies is significant, and is consistent with expectations for the selected wavelengths of the surveys (see, e.g., Strandet et al. 2016; Béthermin et al. 2015, and references therein). The systematic study of the galaxies selected from the Herschel and SPT surveys thus offers the opportunity to gather critical complementary information on galaxy populations at different epochs of cosmic evolution, with Herschel-selected sources probing the peak of star formation activity around 2 < z < 3, while the SPT-selected galaxies provide crucial information on star formation at earlier epochs.
4.2. Comparison to photometric redshifts
The spectroscopically derived redshifts significantly differ in many cases from the estimates based on the available photometric data. Deriving redshifts using submillimeter spectral energy distributions (SEDs) of galaxies with known redshifts and dust temperatures as templates indeed is uncertain (e.g., Jin et al. 2019). This is particularly true when using SPIRE data alone because the 250, 350, and 500 μm bands are close to the peak of the observed SED for 2 < z < 4 galaxies. Bakx et al. (2018) built an SED template based on the SPIRE and SCUBA-2 data for a sample of bright H-ATLAS galaxies with available measurements of zspec and a two-temperature modified blackbody (MBB) model. This template was then used to derive zphot values for the entire H-ATLAS sample of the Herschel-bright galaxies (see revised values in Bakx et al., in prep.). The zphot values derived for the sources of this Pilot Program are listed in Table 1.
Not counting HerBS-43, the values for zphot are on average consistent within 20% of the zspec value, and for two sources, HerBS-95 and HerBS-113, in agreement within 10%. The poor accuracy and reliability of redshifts derived from (sub)millimeter continuum photometry is due to the degeneracy between temperature, β, and redshift, and to the absence of well-defined features in the SEDs. The derived values of the redshifts based on continuum measurements alone is therefore indicative and, in any case, never precise enough to follow up efficiently with targeted observations of molecular or atomic gas.
4.3. Spectral energy distribution: infrared luminosity and dust properties
Combining the photometric data from SPIRE (Eales et al. 2010) and SCUBA-2 (Bakx et al. 2018, as revised in Bakx et al., in prep.) with the NOEMA continuum measurements, we assembled the SEDs of all the sources observed in the Pilot Program (see below for the cases where the sources are double). Although PACS data from the H-ATLAS survey are also available, their usefulness is limited as many of the detections are tentative with signal-to-noise ratio < 3. We have therefore plotted the PACS flux densities, when available, on the SEDs, without including them in the SED analysis (see Fig. 12). The resulting SEDs cover the observed wavelength range from 250 μm to ∼3 mm, and include sources with a minimum of 7 data points and sources with a maximum of 12.
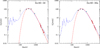 |
Fig. 12. Observed SED of two of the Pilot Program sources, HerBS-58 (z = 2.084) and HerBS-89a (z = 2.950). The data include SPIRE (black dots, from Bakx et al. 2018), the revised SCUBA-2 photometry (blue dot, see Bakx et al., in prep.), and the 3 and 2 mm continuum flux densities (red dots) extracted from the NOEMA data (Table 3). In the case of HerBS-58, the PACS data point, which is available, is shown as an open square, although it was not used to fit the SED. The figure also shows the best-fitting MBB model including (red dashed) and not including (red dotted) the effect from the CMB on the dust continuum, and the best fit to the DL07 model (blue dashed); see text for details. |
In order to derive the infrared luminosities, dust masses, and temperatures of the sources, we modeled their SEDs using two different approaches: (i) a single-temperature MBB, following Berta et al. (2016), and (ii) the Draine & Li (2007, hereafter DL07) dust models.
In the first case, the far-infrared SED of a galaxy is modeled as the emergent luminosity from a given dust mass Mdust:
 (1)
(1)
where Bν(Tdust) is the Planck function, Tdust the dust temperature, and κν = κ0(ν/ν0)β the mass absorption coefficient of dust at rest frequency ν. For κν, we adopt the values from Draine (2003), as revised from Li & Draine (2001). Ideally, the chosen reference (rest-frame) frequency ν0 should be covered by the observed data. We refer to Berta et al. (2016) and Bianchi (2013) for a thorough discussion about the proper use of κν and assumptions on β.
For the MBB fit, we limit the observed data to a rest-frame wavelength λrest > 50 μm in order to avoid biases towards warmer temperatures. From the MBB modeling, we determine the dust temperature, dust mass, and spectral emissivity index β for each source under the assumption that the dust emission is optically thin. The effects of the cosmic microwave background (CMB) discussed in da Cunha et al. (2013) were taken into account in the derivation of the galaxies’ intrinsic dust properties (see also Jin et al. 2019).
In the DL07 case, interstellar dust is described as a mixture of carbonaceous and amorphous silicate grains, whose size distributions are chosen to mimic different observed extinction laws. The result of the DL07 fit is an estimate of the dust mass and infrared luminosity; see Draine & Li (2001, 2007), Li & Draine (2001), and Berta et al. (2016) for a detailed description of the model and its implementation.
For both models, best-fit solutions are found in two ways: through χ2 minimization and through 1000 Monte Carlo (MC) realizations for each source. Uncertainties are computed based on Δχ2 or as the dispersion of all MC realizations, respectively. The two approaches lead to comparable results.
Figure 12 shows two examples of SED fits, and Table 5 summarizes our findings, comparing the results of the MBB and DL07 models. For each source, the SED fits and the derived properties are based on the available SPIRE, SCUBA-2, and NOEMA flux densities.
For the fields where two sources were detected within the NOEMA primary beam in the continuum and in at least two emission lines (namely HerBS-43, HerBS-70, and HerBS-95), the Herschel (even at 250 μm) and SCUBA-2 data do not provide enough information to separate the contributions of each component. To disentangle the flux densities, we therefore adopted the following methods. First, for the binary sources (HerBS-70 and HerBS-95) where the two components have the same redshift, we split the Herschel and SCUBA-2 flux densities using the average flux density ratio of the highest-frequency continuum measurements in the NOEMA data (see Table 3). For HerBS-70, using the average ratio of the flux densities at 158.6 and 149.0 GHz shows that HerBS-70E dominates with a contribution of 82% to the total flux density; for HerBS-95, the average ratio of the flux densities of the two components at 158.6, 149.0, 143.2, and 133.5 GHz indicates that HerBS-95E contributes 41% to the Herschel and SCUBA-2 flux densities. In the case of HerBS-43, which consists of two objects at redshift z = 3.212 (HerBS-43a) and z = 4.054 (HerBS-43b), we assumed a similar MBB spectrum for the two components, with a dust temperature equal to the average temperature of the whole Pilot Program sample from the MBB fits (Tdust = 30 K; see Table 5) and a dust emissivity index equal to that of the tabulated κν (β = 2.08; see Li & Draine 2001; Draine & Li 2007; Berta et al. 2016). Taking the two redshift values into account, we thus derive relative contributions of HerBS43a to the SPIRE flux densities of 85%, 78%, and 70% at 250, 350, and 500 μm, respectively.
The comparison between the values of Mdust derived from the two SED models (see Table 5) illustrates the relative uncertainties on the dust mass and the models’ main parameters that can be achieved with the current data. Thanks to the wide wavelength coverage, from ∼50 to ∼1000 μm in the rest frame, Mdust can be constrained for the majority of the sources to a 20−30% uncertainty (3σ), using both the MBB and DL07 models. The Tdust and β are in general estimated to better than 10%, and their averages are determined to Tdust = 29 ± 5 K and β = 2.3 ± 0.3. It is worth noting that the Pilot Program sample is statistically too small and the dust temperatures measured too low (Tdust < 60 K) to lift the degeneracy with the spectral emissivity index β. The difference between the two model estimates is a known effect (e.g., Berta et al. 2016), which is mainly due to the fact that the MBB model is a simplification of reality and that the DL07 approach includes more dust components. Here we adopt the MBB results for our subsequent analysis of the sources’ properties.
4.4. Widths and profiles of the CO emission lines
As noted previously, the distribution of the widths of the CO emission lines of the bright Herschel sources described in this work is remarkable for the number of sources displaying broad lines. The distribution of CO linewidths is shown in Fig. 10, where it is compared to the high-z SMG samples studied by Bothwell et al. (2013) and Harris et al. (2012). The mean value for the CO FWHM of the Pilot Program sample is 700 ± 300 km s−1 with a median of 800 km s−1, compared to 510 ± 80 km s−1 for the unlensed SMGs from Bothwell et al. (2013), and 525 ± 80 km s−1 for the lensed Herschel-selected galaxies from Harris et al. (2012).
The line profiles of the Pilot Program sources are also remarkable, as 8 out of 13 sources display asymmetrical or double-peaked profiles with separations between the peaks of up to ∼500 km s−1, indicating either the presence of kinematically distinct components suggestive of merger systems, or rotating disc-like components. Higher angular resolution observations are needed to further explore the nature of these sources.
4.5. CO luminosities and the  vs ΔV relationship
The CO line emission traces the kinematics of the potential well in which a galaxy’s molecular gas lies, and can therefore provide a measure of the dynamical mass of the galaxy, modulo any inclination or dispersion effects. From the integrated 12CO line intensity, it is possible to derive the 12CO luminosity of the source,  , which is related to the mass of the gas reservoir, MH2, through
 (2)
(2)
where α is a conversion factor in units of M⊙ (K km s−1 pc2)−1. In this paper we adopt a value of α = 0.8 suggested by measurements for SMGs and quasar hosts (e.g., Carilli & Walter 2013). We compute the CO luminosities of the sources (in K km s−1 pc2) using the standard relation given by Solomon & Vanden Bout (2005),
 (3)
(3)
where SCOΔV is the velocity-integrated CO line flux in Jy km s−1, νCO the rest frequency of the CO emission line in GHz, and DL the luminosity distance in Mpc in our adopted cosmology. All the CO luminosities reported in this paper are in  ; for the sources of the Pilot Program, we used the lowest available J → (J − 1) transition and corrected for excitation adopting the median brightness temperature ratios for the SMGs in Table 4 of Bothwell et al. (2013), which are compatible with the values listed in Carilli & Walter (2013), and applying similar corrections where needed for sources taken from the literature (see Fig. 13). Future measurements of the low-lying CO transitions will allow us to anchor the spectral line energy distribution for each of sources discussed in this paper and to derive precise values for
  . To homogenize the different cosmologies used in the various papers, we systematically recalculated all
  values for the cosmology adopted in this study.
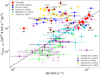 |
Fig. 13. CO luminosity |

Figure 13 displays the relation between the apparent CO luminosities,  , and the width (ΔV) of the CO emission lines for the sources presented in this work and a compilation of high-z lensed and unlensed SMGs, as well as local ULIRGs from the literature (see figure caption for details and references). This relationship has already been presented and discussed in previous studies (e.g., Harris et al. 2012; Bothwell et al. 2013; Carilli & Walter 2013; Aravena et al. 2016; Yang et al. 2017; Dannerbauer et al. 2017; Isbell et al. 2018). Figure 13 includes CO measurements of ∼160 galaxies in total; it should be noted that none of the gravitationally lensed sources in this plot was corrected for lensing magnification.
The most obvious feature in this figure is the clear dichotomy between the sources that are strongly lensed and the unlensed or weakly lensed galaxies; the lensing magnification boosts the apparent CO luminosity and lifts the lensed sources above the roughly quadratic relationship between  and ΔV that is observed for the unlensed sources. This trend was first pointed out by Harris et al. (2012). The usefulness of this effect for measuring the lensing magnification has been debated in the literature, and the consensus is that deriving exact values for the magnification factors based on unresolved CO data is unreliable (e.g., Aravena et al. 2016).
Notwithstanding this caution, the separation between strongly lensed and unlensed or weakly lensed sources is clearly present in the  versus ΔV relationship and, in principle, could be used to distinguish sources that are strongly lensed from intrinsically hyper-luminous sources. Interestingly, the sources in the Pilot Program are located in the upper part of the relationship indicating that several of the Pilot Program sources are strongly lensed, and that more than half of the sources are HyLIRGs located along or close to the quadratic relationship for the unlensed sources, akin to the hyper-luminous binary source HATLAS J084933 discussed in Ivison et al. (2013) and the hyper-luminous high-redshift galaxy HXMM01 studied by Fu et al. (2013); see identifications in Fig. 13. The proportion of these HyLIRGs is remarkable in this small sample selected as infrared-bright Herschel galaxies. However, more detailed observations are needed to verify whether these sources are lensed or not, and to derive their intrinsic properties. For instance, the source HerBS-89a is lensed, and a detailed discussion of its properties will be provided in Berta et al. (in prep.).
Finally, we explored the consistency of the H2 masses derived independently from the 12CO and [CI](3P1–3P0) emission lines for the three sources where both lines were observed, namely HerBS-58, HerBS-70E, and HerBS-154. First, we estimated the neutral carbon masses by using Eq. (1) in Weiß et al. (2005), assuming a [CI] excitation temperature equal to the derived dust temperature (see Table 5). Adopting an atomic carbon abundance of X[CI]/X[H2] of 8.4 × 10⁻⁵ (Walter et al. 2011), we derived the H2 masses of HerBS-58, HerBS-70E, and HerBS-154 to be 14.2, 12.4, and 10.6 × 10¹⁰ M⊙, respectively. The comparison between the H2 mass derived from the CO and the [CI] emission lines suggests that in the case of HerBS-70E the scaling of the high-J CO line luminosity to the equivalent J = 1−0 luminosity is most likely missing a significant fraction of subthermally excited gas, but that in the case of the two other sources the gas masses estimated via the two methods are consistent within a factor of 2. However, observations of the [CI] and lower-J CO emission lines of a larger and statistically representative sample of SMGs are needed for a more accurate comparison between the two methods.
5. Conclusion
We reported the results of a Pilot Program using NOEMA to measure reliable redshifts for a sample of 13 bright Herschel sources. The main goal of this project was to demonstrate the ability to efficiently derive redshifts and global properties of high-z galaxies using the new correlator and broad bandwidth receivers on NOEMA. The observations described here show that the main goal of this project were successfully reached. Of the 13 H-ATLAS selected sources, 11 sources were detected with good signal-to-noise ratios in the continuum and in at least two emission lines at 3 and 2 mm, with three sources showing an additional source in the field of view, allowing us to establish accurate redshifts and providing useful additional information on the nature and the properties of these galaxies. On average, about 100 min of total telescope time were needed per source in this Pilot Program to detect at least two emission lines in the selected 2 < z < 4 bright Herschel galaxies, demonstrating the feasibility and efficiency of the redshift measurements using NOEMA and opening the possibility of carrying out more complete spectroscopic redshift surveys of larger samples of Herschel-selected galaxies.
The main conclusions of this paper are as follows:
-
Precise spectroscopic redshifts (zspec) were established for 12 galaxies (including two binary systems) based on the detection of at least two emission lines, mostly from 12CO ranging from the (3−2) to the (6−5) transition. In addition, we also report for three sources the detection of the emission line of the atomic carbon fine-structure line [CI] (3P1–3P0), and in one source the detection of water in the para-H2O (211–202) transition. The derived spectroscopic redshifts are in the range 2.08 < z < 4.05 with a median value of z = 2.9 ± 0.6 and a tail in the distribution to z > 3.
-
Combining the available continuum flux densities from Herschel-SPIRE, SCUBA-2, and the 3 and 2 mm NOEMA data, we assembled the SEDs of the sources and derived their infrared luminosities, dust masses, and temperatures.
-
The values derived for the photometric redshifts (zphot) depend on the adopted photometry and the available SED coverage used in the analysis. The photometric redshifts are only indicative and are on average, for the sources studied in this paper, within 20% of the zspec values we measured.
-
Many emission lines have broad widths between 150 and 1100 km s−1, with a mean value for the CO FWHM of 700 ± 300 km s−1 and a median of 800 km s−1. About 60% of the sources display double-peaked profiles indicative of merger systems and/or rotating disks.
-
The majority of our targets are individual sources, and are unresolved or barely resolved on scales of 10 kpc. In one case, HerBS-43, there is a companion in the field, but at another redshift and hence unrelated, and in the case of HerBS-89 there is a weak 2 mm continuum source, HerBS-89b, that remains undetected in line emission. Two sources (HerBS-95 and HerBS-70) are double, and in both cases the components are at the same redshift with projected separation of ∼140 kpc.
-
Based on the location of the sources studied in this paper on the
 versus ΔV relationship, we conclude that several sources are gravitationally amplified, and that a large fraction (including the two binaries) are hyper-luminous infrared galaxies (HyLIRGs). Precise measurements of the amplification factors and the derivation of the properties of these sources will require higher resolution follow-up observations in the submillimeter, and at optical–near-infrared wavelengths to study the characteristics of the foreground amplifying galaxy.
The observations presented in this study have enabled the first systematic measurement of redshifts of high-z galaxies using NOEMA. Measurements of a larger and complete sample of galaxies selected from the Herschel surveys will provide a useful database for exploring in detail the properties of these sources and, using follow-up observations, the properties of the lensing systems in the case of gravitational amplification. Building upon the success of the Pilot Program, we started a comprehensive redshift survey of a sample of 125 of the brightest (S500 μm > 80 mJy) galaxies from the Herschel surveys. The results of this ongoing survey will be reported in a forthcoming series of papers. This extended sample will provide, together with other already available redshift measurements, a sizeable and homogeneous sample of about ∼200 bright Herschel selected galaxies with reliable redshifts, which will allow us to increase the number of known lensed galaxies at the peak of cosmic evolution, to provide the largest known sample of HyLIRGs, and to find additional rare objects.
Acknowledgments
This work is based on observations carried out under project numbers W17DM and S18CR with the IRAM NOEMA Interferometer. IRAM is supported by INSU/CNRS (France), MPG (Germany) and IGN (Spain). The authors are grateful to IRAM for making this work possible. The anonymous referee is thanked for providing useful comments. A.J.B. and A.J.Y acknowledge support from the National Science Foundation grant AST-1716585. L.D. acknowledges support from the ERC consolidator grant CosmicDust (PI: H. Gomez). C.Y. acknowledges support from an ESO Fellowship. H.D. acknowledges financial support from the Spanish Ministry of Science, Innovation and Universities (MICIU) under the 2014 Ramón y Cajal program RYC-2014-15686 and AYA2017-84061-P, the later one co-financed by FEDER (European Regional Development Funds). D.A.R. acknowledges support from the National Science Foundation under grant numbers AST-1614213 and AST-1910107 and from the Alexander von Humboldt Foundation through a Humboldt Research Fellowship for Experienced Researchers. S.J. acknowledges financial support from the Spanish Ministry of Science, Innovation and Universities (MICIU) under grant AYA2017-84061-P, co-financed by FEDER (European Regional Development Funds). The National Radio Astronomy Observatory is a facility of the National Science Foundation operated under cooperative agreement by Associated Universities, Inc.
References
- Aravena, M., Spilker, J. S., Bethermin, M., et al. 2016, MNRAS, 457, 4406 [NASA ADS] [CrossRef] [Google Scholar]
- Bakx, T. J. L. C., Eales, S. A., Negrello, M., et al. 2018, MNRAS, 473, 1751 [NASA ADS] [CrossRef] [Google Scholar]
- Berta, S., Lutz, D., Genzel, R., Förster-Schreiber, N. M., & Tacconi, L. J. 2016, A&A, 587, A73 [NASA ADS] [CrossRef] [EDP Sciences] [Google Scholar]
- Béthermin, M., De Breuck, C., Sargent, M., & Daddi, E. 2015, A&A, 576, L9 [NASA ADS] [CrossRef] [EDP Sciences] [Google Scholar]
- Bianchi, S. 2013, A&A, 552, A89 [NASA ADS] [CrossRef] [EDP Sciences] [Google Scholar]
- Blain, A. W., Smail, I., Ivison, R. J., Kneib, J.-P., & Frayer, D. T. 2002, Phys. Rep., 369, 111 [NASA ADS] [CrossRef] [Google Scholar]
- Bothwell, M. S., Smail, I., Chapman, S. C., et al. 2013, MNRAS, 429, 3047 [Google Scholar]
- Bussmann, R. S., Pérez-Fournon, I., Amber, S., et al. 2013, ApJ, 779, 25 [NASA ADS] [CrossRef] [Google Scholar]
- Bussmann, R. S., Riechers, D., Fialkov, A., et al. 2015, ApJ, 812, 43 [NASA ADS] [CrossRef] [Google Scholar]
- Carilli, C. L., & Walter, F. 2013, ARA&A, 51, 105 [NASA ADS] [CrossRef] [EDP Sciences] [Google Scholar]
- Casey, C. M., Berta, S., Béthermin, M., et al. 2012, ApJ, 761, 140 [NASA ADS] [CrossRef] [Google Scholar]
- Casey, C. M., Narayanan, D., & Cooray, A. 2014, Phys. Rep., 541, 45 [Google Scholar]
- Chapman, S. C., Blain, A. W., Smail, I., & Ivison, R. J. 2005, ApJ, 622, 772 [NASA ADS] [CrossRef] [Google Scholar]
- da Cunha, E., Groves, B., Walter, F., et al. 2013, ApJ, 766, 12 [NASA ADS] [CrossRef] [Google Scholar]
- Danielson, A. L. R., Swinbank, A. M., Smail, I., et al. 2017, ApJ, 840, 78 [NASA ADS] [CrossRef] [Google Scholar]
- Dannerbauer, H., Lehnert, M. D., Emonts, B., et al. 2017, A&A, 608, A48 [NASA ADS] [CrossRef] [EDP Sciences] [Google Scholar]
- Dannerbauer, H., Harrington, K., Díaz-Sánchez, A., et al. 2019, AJ, 158, 34 [Google Scholar]
- Draine, B. T. 2003, ARA&A, 41, 241 [NASA ADS] [CrossRef] [Google Scholar]
- Draine, B. T., & Li, A. 2001, ApJ, 551, 807 [NASA ADS] [CrossRef] [Google Scholar]
- Draine, B. T., & Li, A. 2007, ApJ, 657, 810 [NASA ADS] [CrossRef] [Google Scholar]
- Duivenvoorden, S., Oliver, S., Scudder, J. M., et al. 2018, MNRAS, 477, 1099 [NASA ADS] [CrossRef] [Google Scholar]
- Eales, S., Dunne, L., Clements, D., et al. 2010, PASP, 122, 499 [NASA ADS] [CrossRef] [Google Scholar]
- Emonts, B. H. C., Lehnert, M. D., Dannerbauer, H., et al. 2018, MNRAS, 477, L60 [NASA ADS] [CrossRef] [Google Scholar]
- Fu, H., Cooray, A., Feruglio, C., et al. 2013, Nature, 498, 338 [NASA ADS] [CrossRef] [Google Scholar]
- Griffin, M. J., Abergel, A., Abreu, A., et al. 2010, A&A, 518, L3 [Google Scholar]
- Harris, A. I., Baker, A. J., Zonak, S. G., et al. 2010, ApJ, 723, 1139 [NASA ADS] [CrossRef] [Google Scholar]
- Harris, A. I., Baker, A. J., Frayer, D. T., et al. 2012, ApJ, 752, 152 [NASA ADS] [CrossRef] [Google Scholar]
- Hughes, D. H., Serjeant, S., Dunlop, J., et al. 1998, Nature, 394, 241 [NASA ADS] [CrossRef] [Google Scholar]
- Isbell, J. W., Xue, R., & Fu, H. 2018, ApJ, 869, L37 [NASA ADS] [CrossRef] [Google Scholar]
- Ivison, R. J., Swinbank, A. M., Smail, I., et al. 2013, ApJ, 772, 137 [NASA ADS] [CrossRef] [Google Scholar]
- Ivison, R. J., Lewis, A. J. R., Weiss, A., et al. 2016, ApJ, 832, 78 [NASA ADS] [CrossRef] [Google Scholar]
- Jin, S., Daddi, E., Magdis, G. E., et al. 2019, ApJ, 887, 144 [Google Scholar]
- Li, A., & Draine, B. T. 2001, ApJ, 554, 778 [Google Scholar]
- Lupu, R. E., Scott, K. S., Aguirre, J. E., et al. 2012, ApJ, 757, 135 [NASA ADS] [CrossRef] [Google Scholar]
- Madau, P., & Dickinson, M. 2014, ARA&A, 52, 415 [NASA ADS] [CrossRef] [Google Scholar]
- Narayanan, D., Turk, M., Feldmann, R., et al. 2015, Nature, 525, 496 [NASA ADS] [CrossRef] [PubMed] [Google Scholar]
- Nayyeri, H., Keele, M., Cooray, A., et al. 2016, ApJ, 823, 17 [NASA ADS] [CrossRef] [Google Scholar]
- Negrello, M., Hopwood, R., De Zotti, G., et al. 2010, Science, 330, 800 [NASA ADS] [CrossRef] [Google Scholar]
- Negrello, M., Amber, S., Amvrosiadis, A., et al. 2017, MNRAS, 465, 3558 [NASA ADS] [CrossRef] [Google Scholar]
- Oliver, S. J., Bock, J., Altieri, B., et al. 2012, MNRAS, 424, 1614 [NASA ADS] [CrossRef] [EDP Sciences] [Google Scholar]
- Oteo, I., Ivison, R. J., Dunne, L., et al. 2016, ApJ, 827, 34 [NASA ADS] [CrossRef] [Google Scholar]
- Pilbratt, G. L., Riedinger, J. R., Passvogel, T., et al. 2010, A&A, 518, L1 [CrossRef] [EDP Sciences] [Google Scholar]
- Planck Collaboration Int. XXVII. 2015, A&A, 582, A30 [NASA ADS] [CrossRef] [EDP Sciences] [Google Scholar]
- Planck Collaboration VI. 2018, A&A, submitted [arXiv:1807.06209] [Google Scholar]
- Riechers, D. A. 2011, ApJ, 730, 108 [NASA ADS] [CrossRef] [Google Scholar]
- Riechers, D. A., Leung, T. K. D., Ivison, R. J., et al. 2017, ApJ, 850, 1 [Google Scholar]
- Smail, I., Ivison, R. J., & Blain, A. W. 1997, ApJ, 490, L5 [NASA ADS] [CrossRef] [Google Scholar]
- Solomon, P. M., & Vanden Bout, P. A. 2005, ARA&A, 43, 677 [NASA ADS] [CrossRef] [Google Scholar]
- Spilker, J. S., Marrone, D. P., Aguirre, J. E., et al. 2014, ApJ, 785, 149 [NASA ADS] [CrossRef] [Google Scholar]
- Spilker, J. S., Marrone, D. P., Aravena, M., et al. 2016, ApJ, 826, 112 [NASA ADS] [CrossRef] [Google Scholar]
- Strandet, M. L., Weiß, A., Vieira, J. D., et al. 2016, ApJ, 822, 80 [NASA ADS] [CrossRef] [Google Scholar]
- Swinbank, A. M., Smail, I., Longmore, S., et al. 2010, Nature, 464, 733 [Google Scholar]
- Tacconi, L. J., Genzel, R., Smail, I., et al. 2008, ApJ, 680, 246 [NASA ADS] [CrossRef] [PubMed] [Google Scholar]
- Vieira, J. D., Crawford, T. M., Switzer, E. R., et al. 2010, ApJ, 719, 763 [NASA ADS] [CrossRef] [Google Scholar]
- Viero, M. P., Asboth, V., Roseboom, I. G., et al. 2014, ApJS, 210, 9 [Google Scholar]
- Walter, F., Weiß, A., Downes, D., Decarli, R., & Henkel, C. 2011, ApJ, 730, 18 [NASA ADS] [CrossRef] [Google Scholar]
- Walter, F., Decarli, R., Carilli, C., et al. 2012, Nature, 486, 233 [Google Scholar]
- Wardlow, J. L., Cooray, A., De Bernardis, F., et al. 2013, ApJ, 762, 59 [NASA ADS] [CrossRef] [Google Scholar]
- Weiß, A., Downes, D., Henkel, C., & Walter, F. 2005, A&A, 429, L25 [NASA ADS] [CrossRef] [EDP Sciences] [Google Scholar]
- Weiß, A., Kovács, A., Coppin, K., et al. 2009, ApJ, 707, 1201 [NASA ADS] [CrossRef] [Google Scholar]
- Weiß, A., De Breuck, C., Marrone, D. P., et al. 2013, ApJ, 767, 88 [NASA ADS] [CrossRef] [Google Scholar]
- Yang, C., Omont, A., Beelen, A., et al. 2017, A&A, 608, A144 [NASA ADS] [CrossRef] [EDP Sciences] [Google Scholar]
- Zavala, J. A., Yun, M. S., Aretxaga, I., et al. 2015, MNRAS, 452, 1140 [NASA ADS] [CrossRef] [Google Scholar]
All Tables
Infrared luminosities, dust masses, dust temperatures, and spectral emissivity indices.
All Figures
|
Fig. 1. Spectral coverage of the 12CO (solid black) and [CI] (dashed gray) emission lines as a function of redshift in the 3 and 2 mm atmospheric windows in the frequency ranges 84−115 GHz and 130−163 GHz. The bottom colored boxes show the LSB and USB frequency settings (red and green, respectively) (see Table 2). The 2 mm frequency windows were selected to optimally cover the range of spectroscopic redshifts predicted by the 3 mm observations. The dark blue zones identify the redshift ranges where at least two emission lines are detected at 3 or 2 mm with the current settings, while the light blue zones indicate the redshift ranges where only one line is present. This wide frequency range enables the detection of at least one emission line in each band, except for a few small redshifts gaps (see Sect. 2 for details). |
| In the text | |
|
Fig. 2. Spectral setup and frequency coverage of the frequency settings in the NOEMA 3 and 2 mm bands for HerBS-89a (see Table 2). The four settings are shown in different colors. The 12CO emission lines detected in HerBS-89a are identified and the solid line is a fit to the underlying dust continuum (see Sect. 3.1 for details on the source). |
| In the text | |
|
Fig. 3. Continuum images at 2 mm and spectra from the 2 mm (top) and 3 mm (bottom) bands for the Herschel bright galaxies HerBS-34, HerBS-43, and HerBS-44. The source name, the continuum frequency, and the derived spectroscopic redshift are indicated along the top of each panel. The emission lines are identified in the upper left corner of each spectrum. The spectra are displayed with the continuum and each emission line is centered at the zero velocity corresponding to its rest frequency. Fits to the continuum and the emission line profiles are shown as dotted and solid red lines, respectively. Continuum contours are plotted starting at 3σ in steps of 5σ and 1σ for HerBS-34 [42] and HerBS-43 [284], respectively, and 2σ in steps of 1σ for HerBS-44 [283], where the numbers in brackets are the 1σ noise levels for each source in μJy beam−1. In the case of HerBS-43, the panels showing the emission lines on the left correspond to the source HerBS-43b, whereas the panels to the right show the spectra of HerBS-43a. The synthesized beam is shown in the lower left corner of each continuum image. |
| In the text | |
|
Fig. 4. Continuum images at 2 mm (right) and spectra from the 2 mm (top) and 3 mm (bottom) bands of the Herschel bright galaxies HerBS-54, HerBS-58, and HerBS-79. Continuum contours are plotted starting at 2σ in steps of 1σ for HerBS-54 [232], 3σ in steps of 2σ for HerBS-58 [52], and 2σ in steps of 1σ for HerBS-79 [297], where the numbers in brackets are the local noise levels σ for each source in μJy beam−1. See caption of Fig. 3 for further details. |
| In the text | |
|
Fig. 5. Continuum images at 2 mm (right) and spectra from the 2 mm (top) and 3 mm (bottom) bands of the Herschel bright galaxies HerBS-89, HerBS-113, and HerBS-154. In the case of HerBS-154, one of the emission lines shown is H2O (211–202). Continuum contours are plotted starting at 3σ in steps of 5σ for HerBS-89 [49], and 2σ in steps of 1σ and 2σ for HerBS-113 [308] and HerBS-154 [82], respectively, where the numbers in brackets are the local noise levels σ for each source in μJy beam−1. See caption of Fig. 3 for further details. |
| In the text | |
|
Fig. 6. Continuum images at 2 mm (center) and spectra (left and right panels) from the 3 and 2 mm bands for the Herschel bright galaxies with a second source in the field at the same redshift: HerBS-70 at z = 2.31 (top panel) and HerBS-95 at z = 2.97 (bottom panel) (see text for details). The primary beam at 50% is shown with a dashed circle. The panels showing the emission lines on the left correspond to the (a) sources near the phase centers, whereas the panels to the right show the spectra of the (b) companion sources to the west. Continuum contours are plotted starting at 3σ in steps of 5σ for both HerBS-70 [40] and HerBS-95 [43], where the numbers in brackets are the local noise levels σ for each source in μJy beam−1. The spectra are primary beam corrected (see caption of Fig. 3 for further details). |
| In the text | |
|
Fig. 7. Other emission lines detected in the sources displayed in Figs. 3–6. From top to bottom: HerBS-43b in 12CO (6–5); HerBS-58 in 12CO (4–3); HerBS-70E and HerBS-154 in [CI] (3P1–3P0). The fitted profiles are centered in velocity on the spectroscopic redshifts listed in Table 4. |
| In the text | |
|
Fig. 8. Velocity field maps of HerBS-54, HerBS-58, HerBS-89a, and HerBS-113. The maps were obtained for the emission lines of 12CO (4–3), [CI] (3P1–3P2), and 12CO (5–4) above thresholds of 30%, 20%, 10%, and 20% of the peak emission in the zeroth moment map for HerBS-54, HerBS-58, HerBS-89a, and HerBS-113, respectively. Contours are in units of 50 km s−1 for HerBS-54 and HerBS-113, and of 100 km s−1 for HerBS-58 and HerBS-89a. The synthesized beams are shown in the lower left corner of each panel. |
| In the text | |
|
Fig. 9. Top panel: integrated spectrum (left) and continuum image (right) for HerBS-204. The continuum contours start at 2σ and are spaced in steps of 1σ = 31 μJy beam−1. Fits to the continuum and the integrated emission line profile are shown as dotted and solid red lines, respectively. Bottom panel: velocity integrated image of the emission line at 102.584 GHz (left) and velocity field map of HerBS-204. The velocity map was obtained for the emission line above a threshold of 20% of the peak emission in the velocity integrated image. Line contours start at 2σ and are shown in steps of 1σ = 0.15 Jy km s−1; velocity contours are in units of 50 km s−1. The synthesized beams are shown in the lower left corners. |
| In the text | |
|
Fig. 10. Distribution of the full width at half maximum (FWHM) for the bright Herschel galaxies detected in 12CO described in this paper (solid red histogram) compared to the FWHM of high-z galaxies reported in Bothwell et al. (2013) (cyan right-hatched) and Harris et al. (2012) (blue left-hatched). |
| In the text | |
|
Fig. 11. Spectroscopic redshift distribution for the 12 bright Herschel H-ATLAS galaxies of the Pilot Program sample detected in at least two emission lines red filled histogram, (see Table 4). Shown are also the 12 H-ATLAS galaxies with reliable redshifts from Harris et al. (2012) added to the Pilot Program sample (blue left-hatched histogram) and the redshift distribution of the 38 SPT-selected galaxies from Strandet et al. (2016) (green right-hatched histogram). |
| In the text | |
|
Fig. 12. Observed SED of two of the Pilot Program sources, HerBS-58 (z = 2.084) and HerBS-89a (z = 2.950). The data include SPIRE (black dots, from Bakx et al. 2018), the revised SCUBA-2 photometry (blue dot, see Bakx et al., in prep.), and the 3 and 2 mm continuum flux densities (red dots) extracted from the NOEMA data (Table 3). In the case of HerBS-58, the PACS data point, which is available, is shown as an open square, although it was not used to fit the SED. The figure also shows the best-fitting MBB model including (red dashed) and not including (red dotted) the effect from the CMB on the dust continuum, and the best fit to the DL07 model (blue dashed); see text for details. |
| In the text | |
|
Fig. 13. CO luminosity |
| In the text | |
Current usage metrics show cumulative count of Article Views (full-text article views including HTML views, PDF and ePub downloads, according to the available data) and Abstracts Views on Vision4Press platform.
Data correspond to usage on the plateform after 2015. The current usage metrics is available 48-96 hours after online publication and is updated daily on week days.
Initial download of the metrics may take a while.