Fig. 12.
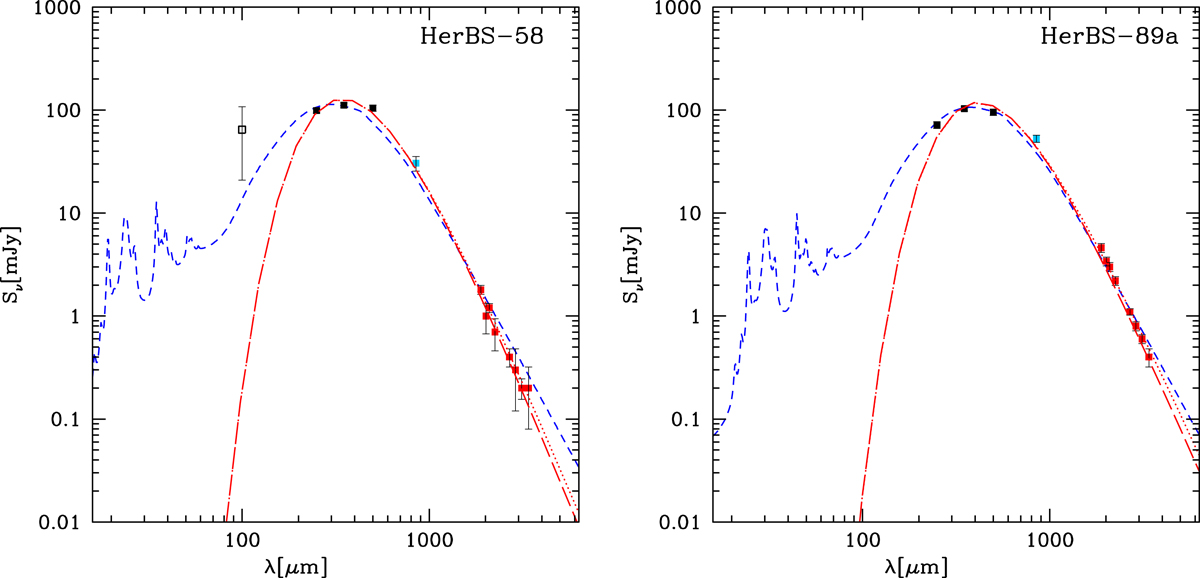
Observed SED of two of the Pilot Program sources, HerBS-58 (z = 2.084) and HerBS-89a (z = 2.950). The data include SPIRE (black dots, from Bakx et al. 2018), the revised SCUBA-2 photometry (blue dot, see Bakx et al., in prep.), and the 3 and 2 mm continuum flux densities (red dots) extracted from the NOEMA data (Table 3). In the case of HerBS-58, the PACS data point, which is available, is shown as an open square, although it was not used to fit the SED. The figure also shows the best-fitting MBB model including (red dashed) and not including (red dotted) the effect from the CMB on the dust continuum, and the best fit to the DL07 model (blue dashed); see text for details.
Current usage metrics show cumulative count of Article Views (full-text article views including HTML views, PDF and ePub downloads, according to the available data) and Abstracts Views on Vision4Press platform.
Data correspond to usage on the plateform after 2015. The current usage metrics is available 48-96 hours after online publication and is updated daily on week days.
Initial download of the metrics may take a while.