Fig. 1.
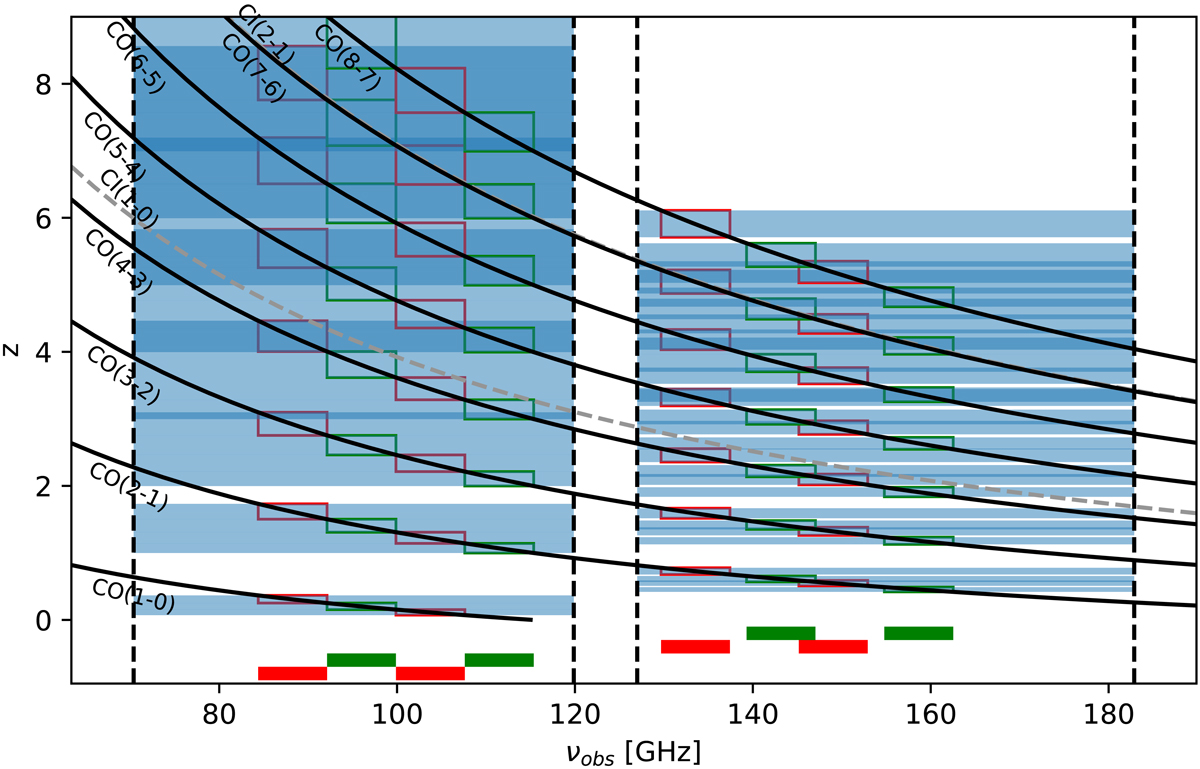
Spectral coverage of the 12CO (solid black) and [CI] (dashed gray) emission lines as a function of redshift in the 3 and 2 mm atmospheric windows in the frequency ranges 84−115 GHz and 130−163 GHz. The bottom colored boxes show the LSB and USB frequency settings (red and green, respectively) (see Table 2). The 2 mm frequency windows were selected to optimally cover the range of spectroscopic redshifts predicted by the 3 mm observations. The dark blue zones identify the redshift ranges where at least two emission lines are detected at 3 or 2 mm with the current settings, while the light blue zones indicate the redshift ranges where only one line is present. This wide frequency range enables the detection of at least one emission line in each band, except for a few small redshifts gaps (see Sect. 2 for details).
Current usage metrics show cumulative count of Article Views (full-text article views including HTML views, PDF and ePub downloads, according to the available data) and Abstracts Views on Vision4Press platform.
Data correspond to usage on the plateform after 2015. The current usage metrics is available 48-96 hours after online publication and is updated daily on week days.
Initial download of the metrics may take a while.