Fig. 6.
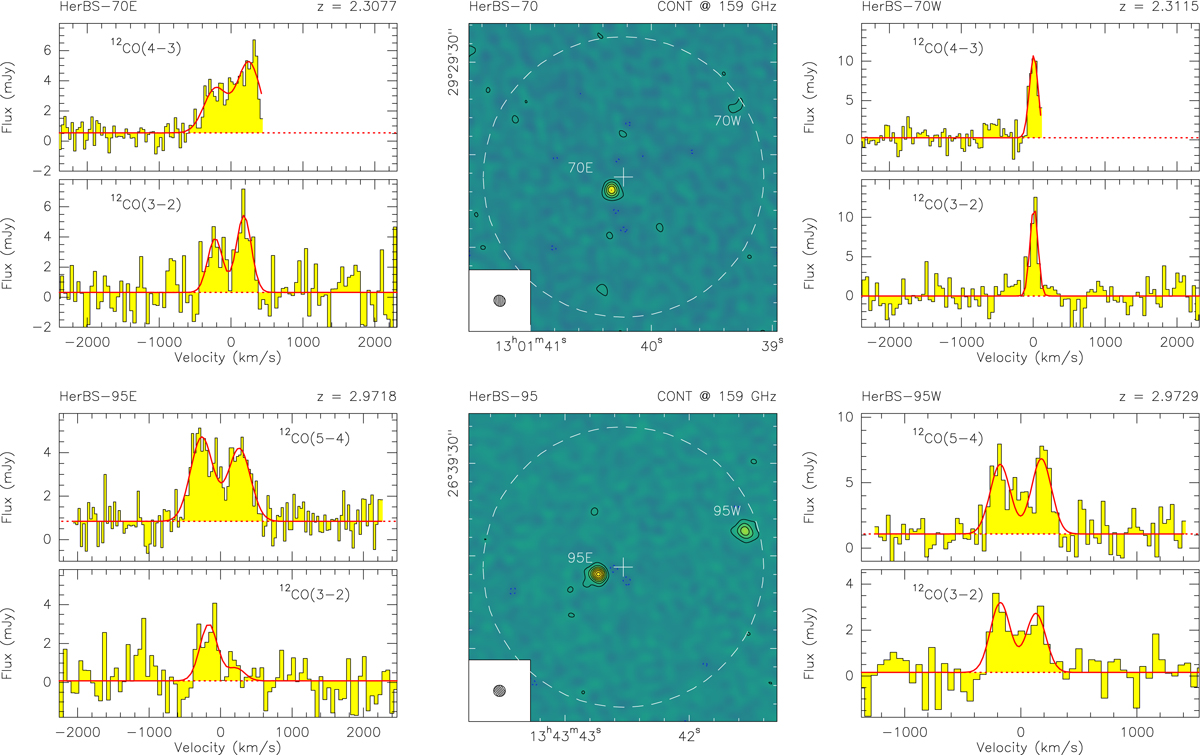
Continuum images at 2 mm (center) and spectra (left and right panels) from the 3 and 2 mm bands for the Herschel bright galaxies with a second source in the field at the same redshift: HerBS-70 at z = 2.31 (top panel) and HerBS-95 at z = 2.97 (bottom panel) (see text for details). The primary beam at 50% is shown with a dashed circle. The panels showing the emission lines on the left correspond to the (a) sources near the phase centers, whereas the panels to the right show the spectra of the (b) companion sources to the west. Continuum contours are plotted starting at 3σ in steps of 5σ for both HerBS-70 [40] and HerBS-95 [43], where the numbers in brackets are the local noise levels σ for each source in μJy beam−1. The spectra are primary beam corrected (see caption of Fig. 3 for further details).
Current usage metrics show cumulative count of Article Views (full-text article views including HTML views, PDF and ePub downloads, according to the available data) and Abstracts Views on Vision4Press platform.
Data correspond to usage on the plateform after 2015. The current usage metrics is available 48-96 hours after online publication and is updated daily on week days.
Initial download of the metrics may take a while.