Fig. 9.
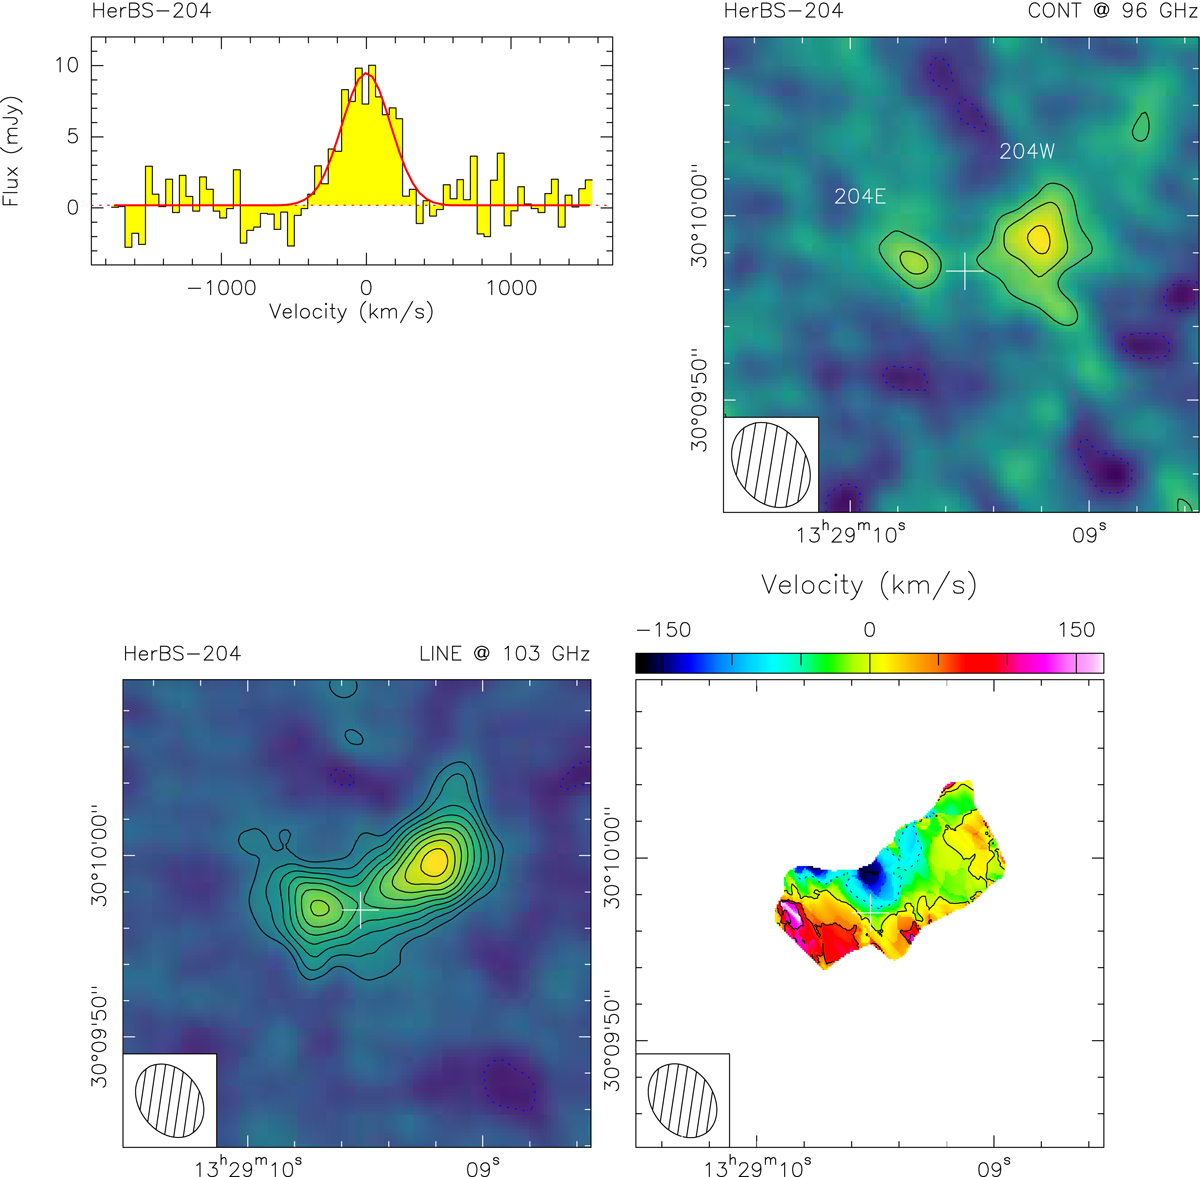
Top panel: integrated spectrum (left) and continuum image (right) for HerBS-204. The continuum contours start at 2σ and are spaced in steps of 1σ = 31 μJy beam−1. Fits to the continuum and the integrated emission line profile are shown as dotted and solid red lines, respectively. Bottom panel: velocity integrated image of the emission line at 102.584 GHz (left) and velocity field map of HerBS-204. The velocity map was obtained for the emission line above a threshold of 20% of the peak emission in the velocity integrated image. Line contours start at 2σ and are shown in steps of 1σ = 0.15 Jy km s−1; velocity contours are in units of 50 km s−1. The synthesized beams are shown in the lower left corners.
Current usage metrics show cumulative count of Article Views (full-text article views including HTML views, PDF and ePub downloads, according to the available data) and Abstracts Views on Vision4Press platform.
Data correspond to usage on the plateform after 2015. The current usage metrics is available 48-96 hours after online publication and is updated daily on week days.
Initial download of the metrics may take a while.