Fig. 8.
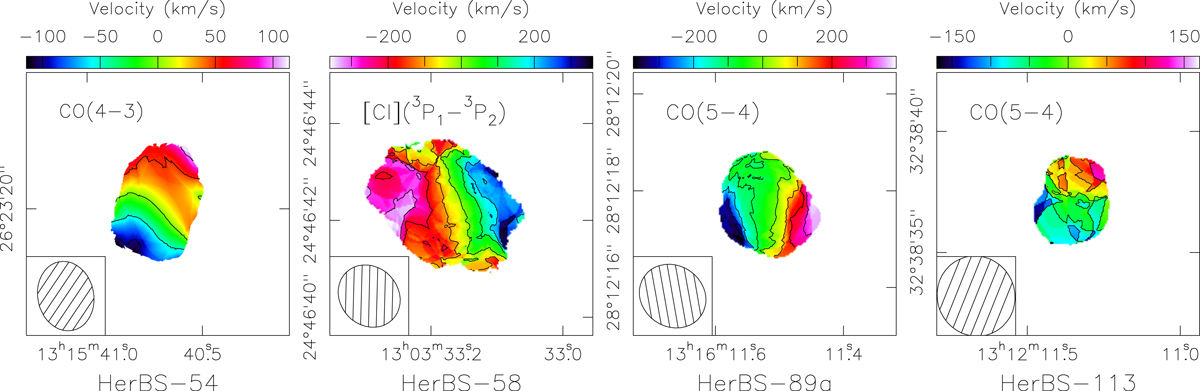
Velocity field maps of HerBS-54, HerBS-58, HerBS-89a, and HerBS-113. The maps were obtained for the emission lines of 12CO (4–3), [CI] (3P1–3P2), and 12CO (5–4) above thresholds of 30%, 20%, 10%, and 20% of the peak emission in the zeroth moment map for HerBS-54, HerBS-58, HerBS-89a, and HerBS-113, respectively. Contours are in units of 50 km s−1 for HerBS-54 and HerBS-113, and of 100 km s−1 for HerBS-58 and HerBS-89a. The synthesized beams are shown in the lower left corner of each panel.
Current usage metrics show cumulative count of Article Views (full-text article views including HTML views, PDF and ePub downloads, according to the available data) and Abstracts Views on Vision4Press platform.
Data correspond to usage on the plateform after 2015. The current usage metrics is available 48-96 hours after online publication and is updated daily on week days.
Initial download of the metrics may take a while.