Fig. 3.
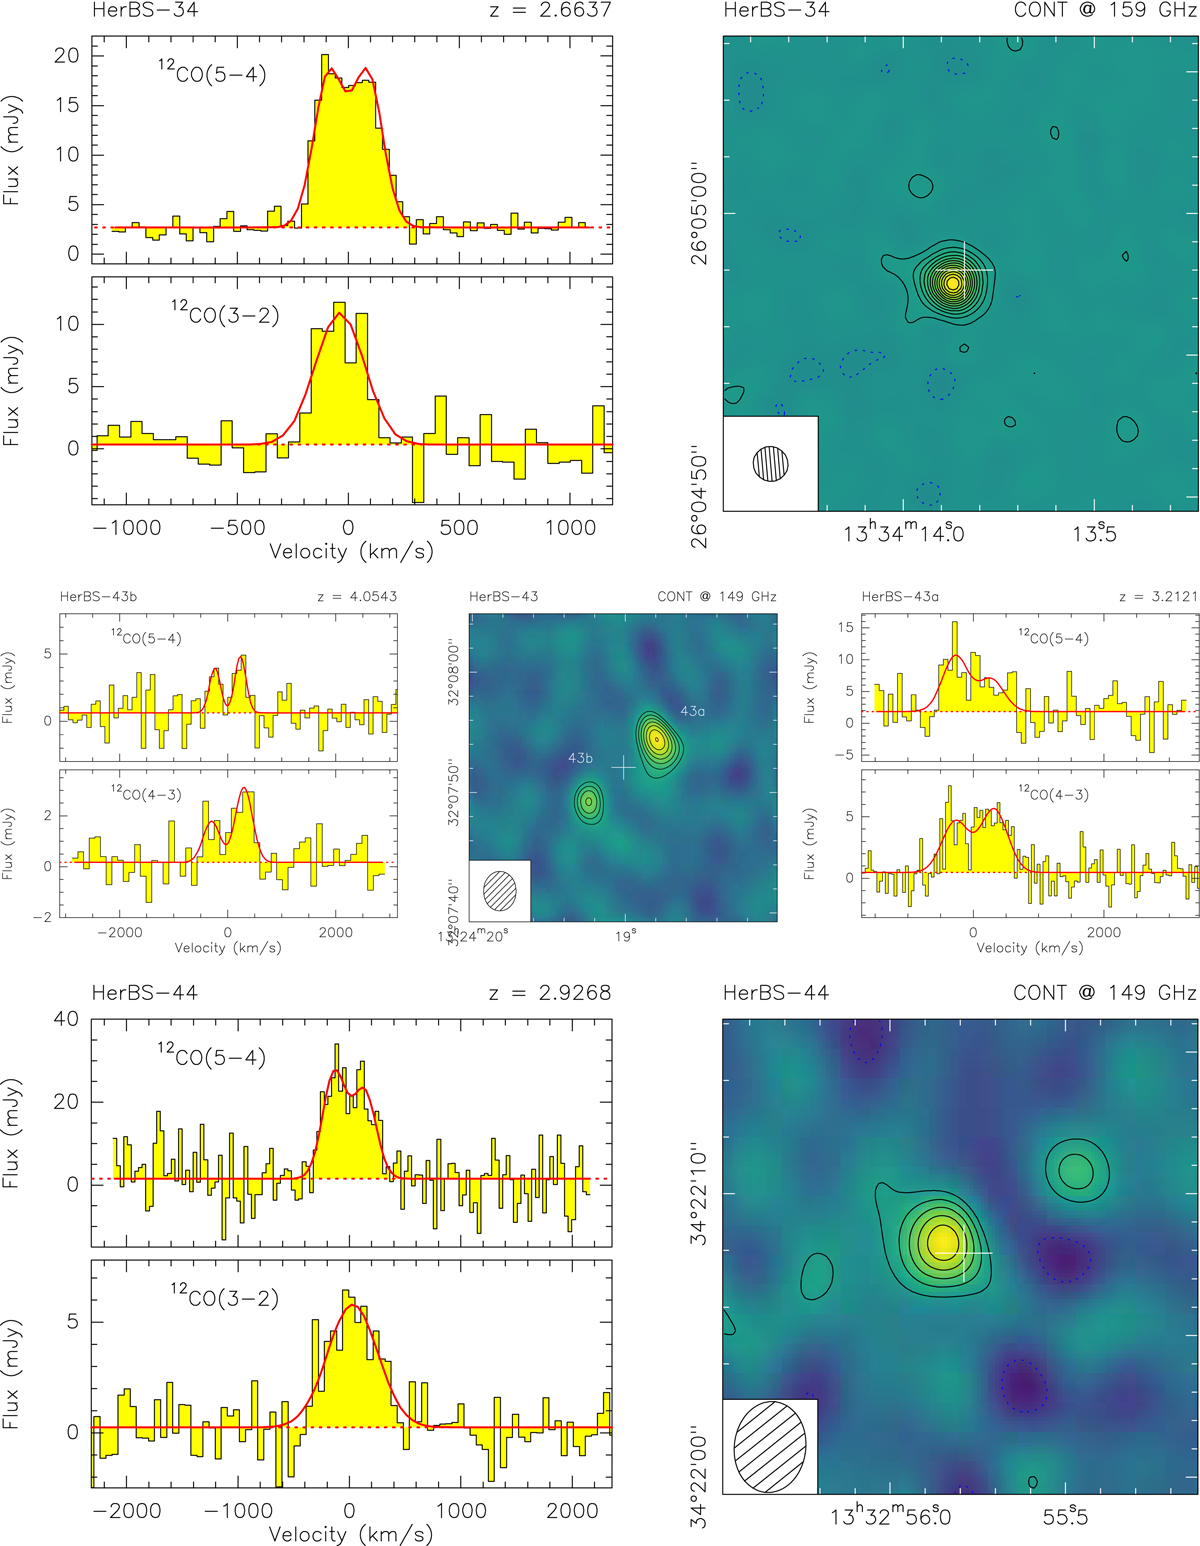
Continuum images at 2 mm and spectra from the 2 mm (top) and 3 mm (bottom) bands for the Herschel bright galaxies HerBS-34, HerBS-43, and HerBS-44. The source name, the continuum frequency, and the derived spectroscopic redshift are indicated along the top of each panel. The emission lines are identified in the upper left corner of each spectrum. The spectra are displayed with the continuum and each emission line is centered at the zero velocity corresponding to its rest frequency. Fits to the continuum and the emission line profiles are shown as dotted and solid red lines, respectively. Continuum contours are plotted starting at 3σ in steps of 5σ and 1σ for HerBS-34 [42] and HerBS-43 [284], respectively, and 2σ in steps of 1σ for HerBS-44 [283], where the numbers in brackets are the 1σ noise levels for each source in μJy beam−1. In the case of HerBS-43, the panels showing the emission lines on the left correspond to the source HerBS-43b, whereas the panels to the right show the spectra of HerBS-43a. The synthesized beam is shown in the lower left corner of each continuum image.
Current usage metrics show cumulative count of Article Views (full-text article views including HTML views, PDF and ePub downloads, according to the available data) and Abstracts Views on Vision4Press platform.
Data correspond to usage on the plateform after 2015. The current usage metrics is available 48-96 hours after online publication and is updated daily on week days.
Initial download of the metrics may take a while.