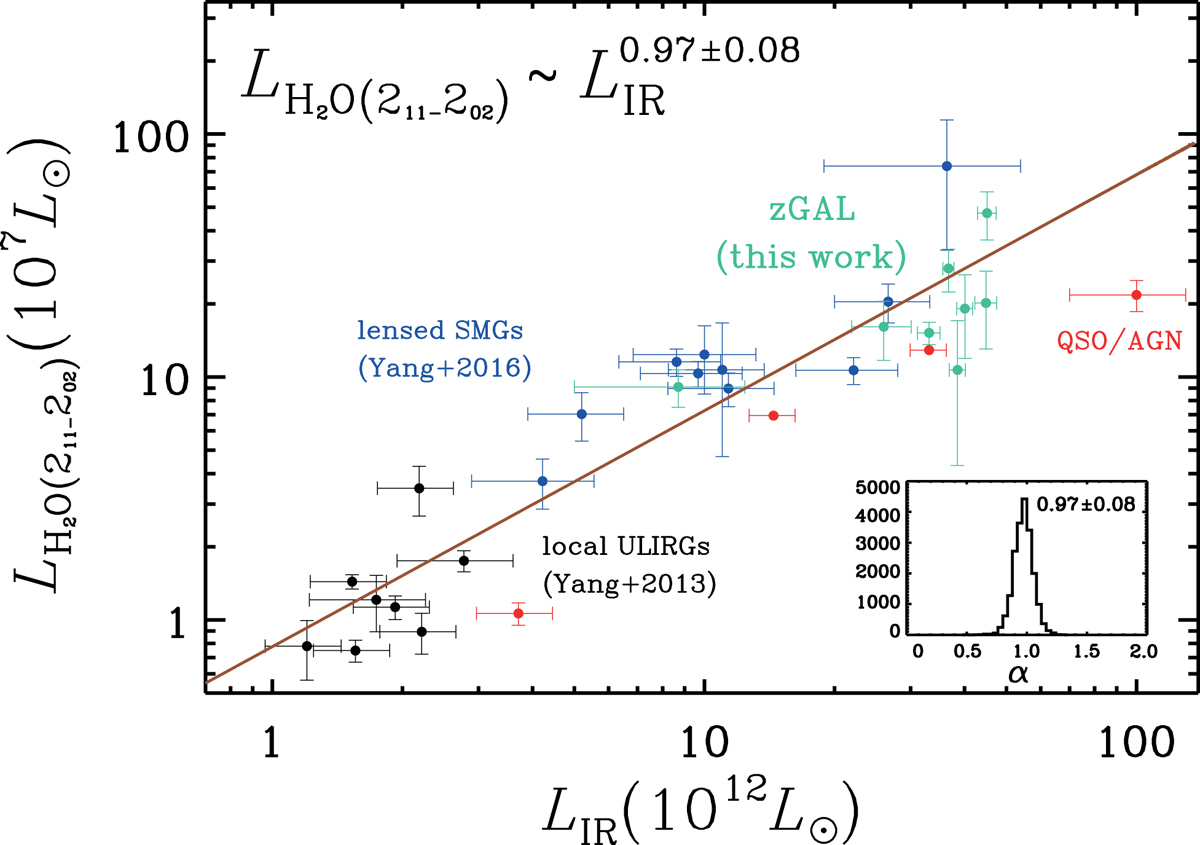
Fig. 4.
Download original image
Correlation between LIR and LH2O(211 − 202) for local (black symbols), high-redshift star-forming SMGs (blue symbols), and QSO/AGN (red). z-GAL sources are marked in green. The fitting of the correlation is represented by the solid orange line. The posterior distribution of the slope is shown in the inset. The plot is adapted from Yang et al. (2016, see references therein). The new fit is performed by including the z-GAL sources (green symbols) as well as the sources from the literature.
Current usage metrics show cumulative count of Article Views (full-text article views including HTML views, PDF and ePub downloads, according to the available data) and Abstracts Views on Vision4Press platform.
Data correspond to usage on the plateform after 2015. The current usage metrics is available 48-96 hours after online publication and is updated daily on week days.
Initial download of the metrics may take a while.