Fig. 12.
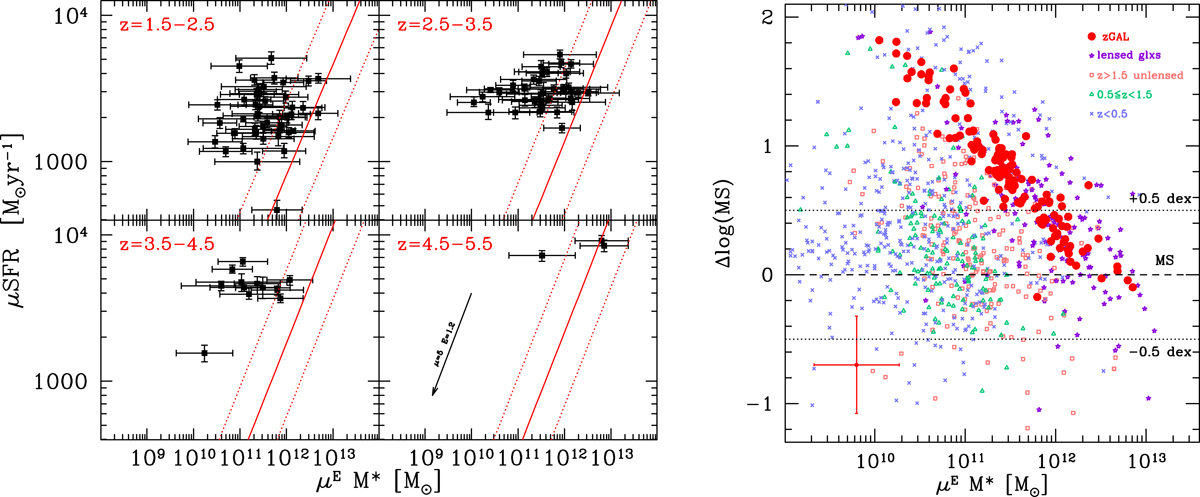
Download original image
Analysis of stellar masses, computed by inverting the τdep scaling relation by Tacconi et al. (2020) as explained in Appendix A. Left panel: Position of the z-GAL (and pilot) sources in the SFR vs. M* space. The red solid lines depict the MS of star-forming galaxies (Speagle et al. 2014) and the dotted lines mark the ±0.5 dex region around the MS. Both SFR and M* are determined modulo the unknown magnification factor μ. The arrow in the lower-right panel indicates the effect of applying a magnification correction with μ = 5 and E = 1.2. Right panel: Distance from the MS, Δlog(MS) = log(μSFR/sSFR(MS,z,M*)), as a function of stellar mass, M*. The dotted horizontal lines represent the range ±0.5 dex from the MS (dashed line). The position of z-GAL galaxies is marked with filled circles and literature data are as in Fig. 10. The median uncertainty of the quantities derived for z-GAL galaxies is shown in the bottom left. See Sect. 6 and Appendix A for more details.
Current usage metrics show cumulative count of Article Views (full-text article views including HTML views, PDF and ePub downloads, according to the available data) and Abstracts Views on Vision4Press platform.
Data correspond to usage on the plateform after 2015. The current usage metrics is available 48-96 hours after online publication and is updated daily on week days.
Initial download of the metrics may take a while.