Fig. 10.
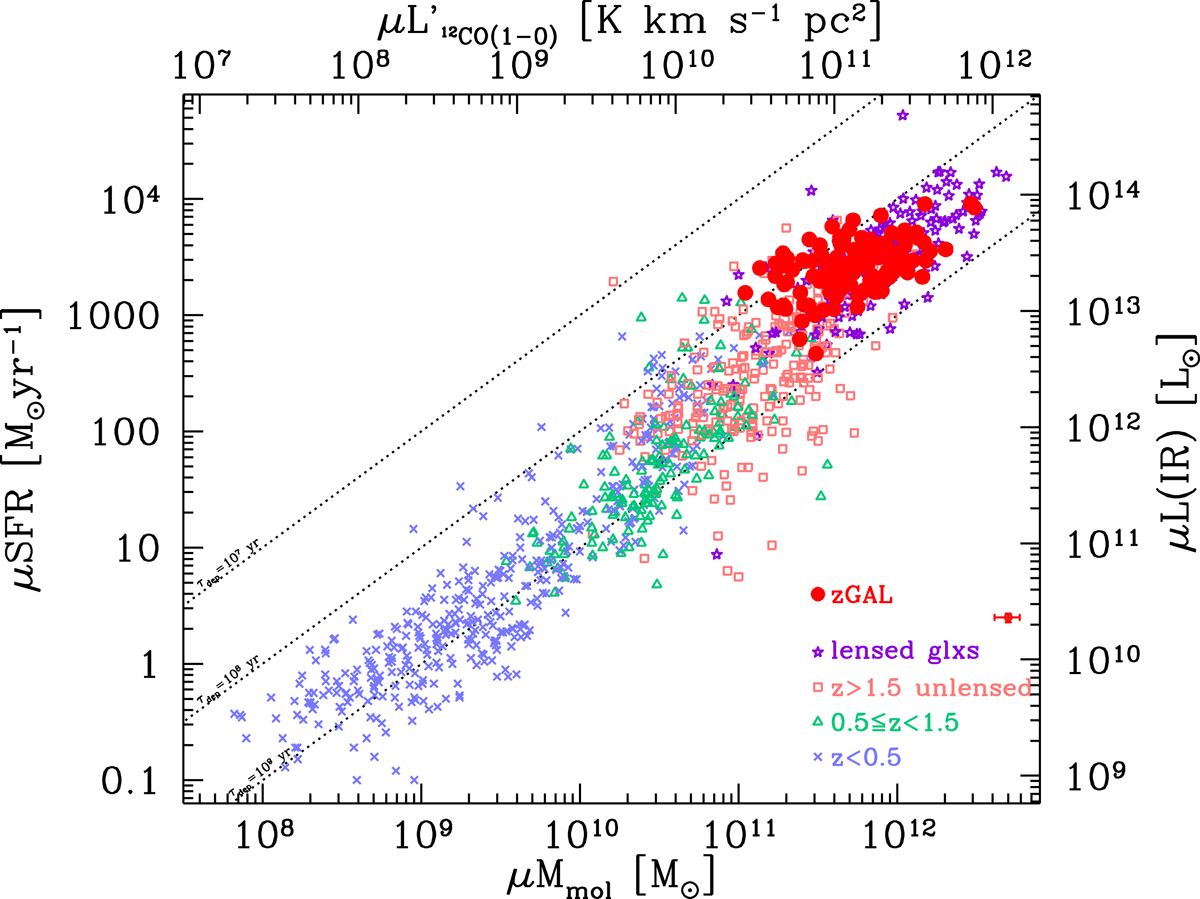
Download original image
Integrated Kennicutt-Schmidt relation, in terms of the measured luminosities (top and right axes) and of the molecular gas mass and star formation rate (bottom and left axes). The red filled circles represent the z-GAL sources, including the Pilot Programme. The open red symbol and error bar in the bottom-right corner represent the typical (median) z-GAL uncertainties. The dotted lines represent the loci of constant depletion timescales (τdep = 10 Myr, 100 Myr and 1 Gyr). The literature data to which the z-GAL sources are compared include: at z < 0.5 the sources studied by Combes et al. (2011, 2013), Chung et al. (2009), Geach et al. (2011), Solomon et al. (1997), and Villanueva et al. (2017), including local ULIRGs; at z > 0.5, the sources by Alaghband-Zadeh et al. (2013), Aravena et al. (2016, 2014, 2013), Bakx et al. (2020b), Bothwell et al. (2017), Bothwell et al. (2013), Carilli et al. (2010), Dannerbauer et al. (2019), Decarli et al. (2016, 2019), Dunne et al. (2021, 2020), Fujimoto et al. (2017), Freundlich et al. (2019), Genzel et al. (2015, 2003), George et al. (2013), Hagimoto et al. (2023), Harris et al. (2012, 2010), Ivison et al. (2013, 2011, 2010), Penney et al. (2020), Riechers et al. (2020, 2011b), Rudnick et al. (2017), Sharon et al. (2016), Tacconi et al. (2018, 2013), Thomson et al. (2012), Valentino et al. (2018), Wang et al. (2018), and Yang et al. (2017). Lensed objects at z > 1.5 are marked with empty star symbols.
Current usage metrics show cumulative count of Article Views (full-text article views including HTML views, PDF and ePub downloads, according to the available data) and Abstracts Views on Vision4Press platform.
Data correspond to usage on the plateform after 2015. The current usage metrics is available 48-96 hours after online publication and is updated daily on week days.
Initial download of the metrics may take a while.