Open Access
Fig. 8.
Download original image
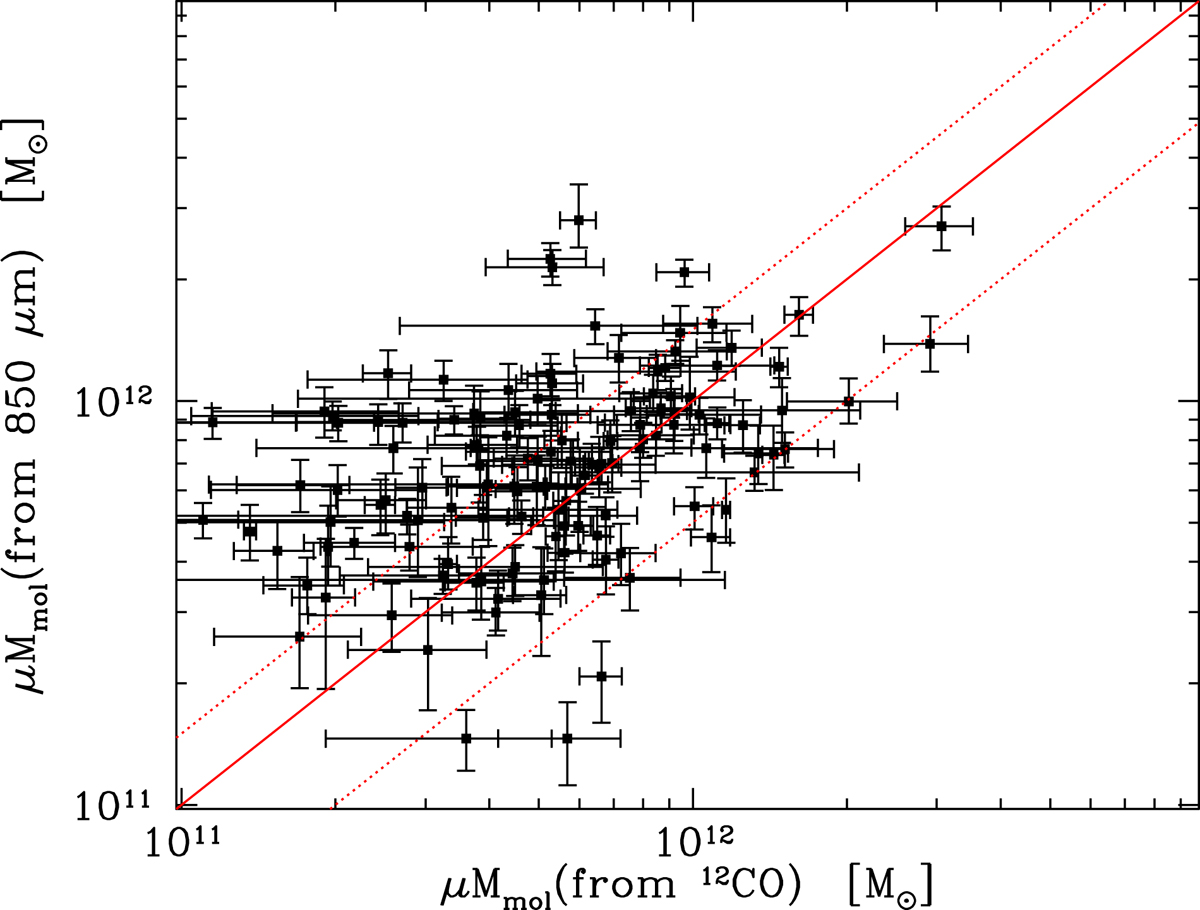
Comparison between the molecular gas masses derived from the 850 μm continuum and from the 12CO emission lines for the z-GAL sources where both tracers are available. No correction for amplification was applied. The solid red line shows the 1:1 locus and the dotted lines the ±50% region around it.
Current usage metrics show cumulative count of Article Views (full-text article views including HTML views, PDF and ePub downloads, according to the available data) and Abstracts Views on Vision4Press platform.
Data correspond to usage on the plateform after 2015. The current usage metrics is available 48-96 hours after online publication and is updated daily on week days.
Initial download of the metrics may take a while.