Fig. 11.
Download original image
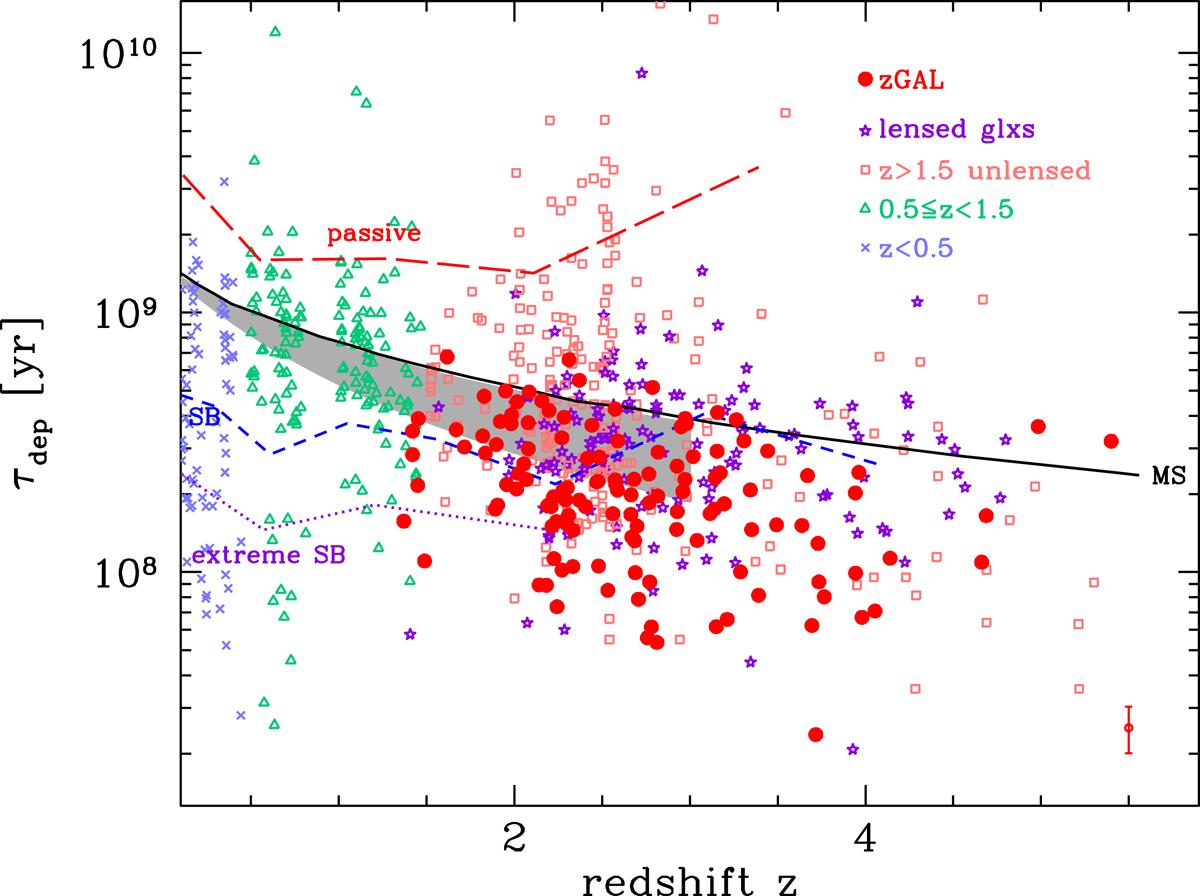
Depletion timescale as a function of redshift. The red filled circles represent the z-GAL sources, including the Pilot Programme. The small red symbol and error bar in the bottom-right corner represent the typical uncertainty on τdep. The grey shaded area is the trend found by Saintonge et al. (2013). The different lines represent the trends found by Tacconi et al. (2020) for MS galaxies (δMS = ±0.6 dex, black solid line), starburst galaxies (δMS > 0.6 dex, blue dashed line), extreme starbursts (δMS > 1.2 dex, purple dotted line), and below-MS galaxies (δMS < 0.4 dex, red long-dashed line). The collection of data from the literature includes the same data as in Fig. 10 (see references in the caption).
Current usage metrics show cumulative count of Article Views (full-text article views including HTML views, PDF and ePub downloads, according to the available data) and Abstracts Views on Vision4Press platform.
Data correspond to usage on the plateform after 2015. The current usage metrics is available 48-96 hours after online publication and is updated daily on week days.
Initial download of the metrics may take a while.