| Issue |
A&A
Volume 677, September 2023
|
|
|---|---|---|
| Article Number | A152 | |
| Number of page(s) | 14 | |
| Section | Interstellar and circumstellar matter | |
| DOI | https://doi.org/10.1051/0004-6361/202347206 | |
| Published online | 22 September 2023 | |
The extremely sharp transition between molecular and ionized gas in the Horsehead nebula★
1
Instituto de Astrofísica, Pontificia Universidad Católica de Chile,
Av. Vicuña Mackenna 4860,
7820436
Macul, Santiago, Chile
e-mail: This email address is being protected from spambots. You need JavaScript enabled to view it.
2
Núcleo Milenio de Formación Planetaria (NPF), Universidad de Valparaíso,
Av. Gran Bretaña 1111,
Valparaíso, Chile
3
Instituto de Física Fundamental (CSIC),
Calle Serrano 121,
28006,
Madrid, Spain
4
LERMA, Observatoire de Paris, PSL Research University, CNRS, Sorbonne Université,
92190
Meudon, France
5
IRAM,
300 rue de la Piscine,
38406
Saint-Martin-d’Hères, France
6
LERMA, Observatoire de Paris, PSL Research University, CNRS, Sorbonne Université,
75014
Paris, France
7
Institut d’Astrophysique Spatiale, Université Paris-Saclay, CNRS,
Bâtiment 121,
91405
Orsay Cedex, France
8
Department of Space, Earth and Environment, Chalmers University of Technology, Onsala Space Observatory,
439 92
Onsala, Sweden
9
Joint ALMA Observatory, Alonso de Cordova
3107
Vitacura, Santiago, Chile
10
Laboratoire d’Astrophysique de Bordeaux, Univ. Bordeaux, CNRS,
B18N, Allée Geoffroy Saint-Hilaire,
33615
Pessac, France
11
Space Telescope Science Institute,
3700 San Martin Drive,
Baltimore, MD
21218-2463, USA
12
Steward Observatory, University of Arizona,
Tucson, AZ
85721, USA
Received:
15
June
2023
Accepted:
10
July
2023
Abstract
Massive stars can determine the evolution of molecular clouds by eroding and photo-evaporating their surfaces with strong ultraviolet (UV) radiation fields. Moreover, UV radiation is relevant in setting the thermal gas pressure in star-forming clouds, whose influence can extend across various spatial scales, from the rims of molecular clouds to entire star-forming galaxies. Probing the fundamental structure of nearby molecular clouds is therefore crucial to understand how massive stars shape their surrounding medium and how fast molecular clouds are destroyed, specifically at their UV-illuminated edges, where models predict an intermediate zone of neutral atomic gas between the molecular cloud and the surrounding ionized gas whose size is directly related to the exposed physical conditions. We present the highest angular resolution (~0.″5, corresponding to 207 au) and velocity-resolved images of the molecular gas emission in the Horsehead nebula, using CO J = 3–2 and HCO+ J = 4−3 observations with the Atacama Large Millimeter/submillimeter Array (ALMA). We find that CO and HCO+ are present at the edge of the cloud, very close to the ionization (H+/H) and dissociation fronts (H/H2), suggesting a very thin layer of neutral atomic gas (<650 au) and a small amount of CO-dark gas (AV = 0.006–0.26 mag) for stellar UV illumination conditions typical of molecular clouds in the Milky Way. The new ALMA observations reveal a web of molecular gas filaments with an estimated thermal gas pressure of Pth = (2.3 – 4.0) × 106 K cm−3, and the presence of a steep density gradient at the cloud edge that can be well explained by stationary isobaric photo-dissociation region (PDR) models with pressures consistent with our estimations. However, in the H II region and PDR interface, we find Pth,PDR > Pth,H II suggesting the gas is slightly compressed. Therefore, dynamical effects cannot be completely ruled out and even higher angular observations will be needed to unveil their role.
Key words: astrochemistry / ISM: clouds / ISM: molecules / photon-dominated region (PDR)
Reduced image is available at the CDS via anonymous ftp to cdsarc.cds.unistra.fr (130.79.128.5) or via https://cdsarc.cds.unistra.fr/viz-bin/cat/J/A+A/677/A152
© The Authors 2023
 Open Access article, published by EDP Sciences, under the terms of the Creative Commons Attribution License (https://creativecommons.org/licenses/by/4.0), which permits unrestricted use, distribution, and reproduction in any medium, provided the original work is properly cited.
This article is published in open access under the Subscribe to Open model. This email address is being protected from spambots. You need JavaScript enabled to view it. to support open access publication.
1 Introduction
Radiative and mechanical interactions between massive stars and molecular clouds are fundamental to understand the evolution of galaxies. As a consequence of their strong radiation fields and winds, massive stars are able to trigger (Elmegreen & Lada 1977; Luisi et al. 2021) or quench (Walch et al. 2012; Kim et al. 2018; Pabst et al. 2019) the formation of new stars by compressing or disrupting their natal clouds, respectively. It is therefore of paramount importance to study the structure of molecular clouds exposed to stellar ultraviolet (UV) radiation fields, whose interaction occurs in so-called photo-dissociation regions (PDRs; Hollenbach & Tielens 1999), to assess the effects of stellar feedback. In general, molecular clouds are far from homogeneous sources; they are rather complex structures that include filaments, shells, and pillars (Hacar et al. 2023; Pineda et al. 2023), but their fundamental structure at sub-parsec scales (<0.1 pc) has been poorly constrained in the context of star formation, specifically in the feedback-impacted surface of molecular clouds in star-forming regions.
Furthermore, a chemical layering is expected at the UV-illuminated surfaces of molecular clouds. The extreme-UV (EUV, hv > 13.6 eV) photons from massive stars produce an adjacent H II region where the gas is fully ionized, while far-UV (FUV, 6 < hv < 13.6 eV) photons interact with neutral gas in the outer layers of molecular clouds, photo-dissociating molecules and thus producing a PDR (Hollenbach & Tielens 1999; Wolfire et al. 2022). The boundary between the H II region and the PDR is delimited by the ionization front, corresponding to the transition from ionized to neutral atomic hydrogen (H+/H). Deeper into the molecular cloud, FUV photons are attenuated by gas and dust (Sternberg et al. 2014). As a result, PDRs are characterized by the transitions from atomic to molecular gas (H/H2 and C+/C/CO transition zones). The relative locations of these transition zones, commonly expressed in terms of visual extinction AV, depend on the ratio between the incident FUV radiation field (G0) and the hydrogen nucleus number density (nH), as well as on the metallicity and dust grain properties (Goicoechea et al. 2022a; Wolfire et al. 2022).
Attempts to reproduce the structure of the UV-illuminated surface layer of molecular clouds and to locate the transitions between ionized, atomic, and molecular gas have been made with stationary models using, in general, a constant gas density or constant pressure (Tielens & Hollenbach 1985; Sternberg & Dalgarno 1989; Kaufman et al. 1999; Le Petit et al. 2006). However, the constant gas density assumption often predicts larger separations between the H/H2 and C+/C/CO transition zones than what has been measured empirically in recent years (Goicoechea et al. 2016). Instead, models with constant pressure are, in general, more consistent with the observations but with relatively high thermal gas pressures that cannot be solely explained by the pressure equilibrium with the adjacent H II region, and thus dynamical effects such as photoevaporation are often invoked (Bron et al. 2018; Joblin et al. 2018). This has strong implications for the amount of “CO-dark H2 gas” predicted by models, which corresponds to the fraction of molecular gas that is not fully traced by CO emission (Grenier et al. 2005; Wolfire et al. 2010), and thus for predictions of the CO-to-H2 conversion factor. Therefore, performing detailed observations of molecular clouds, where we can resolve the different transition zones, is of great interest to have a good estimate of the amount of material available to form new stars, which can be linked to the star formation rate (SFR) by the Kennicutt-Schmidt law (Schmidt 1959; Kennicutt 1998) as well as to the evolution of galaxies (Tacconi et al. 2020).
Our most detailed images of the edge of a molecular cloud to date are the ones of the famous Orion Bar PDR (Goicoechea et al. 2016; Habart et al. 2023). Submillimeter observations from the Atacama Large Millimeter/submillimeter Array (ALMA) together with near-infrared (NIR) images using adaptive optics with Keck telescope, and recent James Webb Space Telescope (JWST) observations using the NIRCam instrument as part of an Early Release Science program (PDRs4All; Berné et al. 2022), revealed high-density filamentary substructures, suggesting that dynamical effects could be important at the UV-illuminated molecular cloud surface. Moreover, the observed H/H2 and C+/C/CO transitions were found to be very close and were not spatially resolved, which could be related to dynamical effects (Goicoechea et al. 2016). The Orion Bar is, however, illuminated by an extremely high-UV radiation field (Marconi et al. 1998; G0 ~ 104, where G0 equal to 1.7 is the average radiation field in the local interstellar medium; Draine 1978). Such a high radiation field is not representative of most of the UV-illuminated molecular gas in both the Milky Way and normal galaxies, which are mostly illuminated by a low to moderate radiation field. Consequently, probing the structure of gas interacting with a moderate radiation field is crucial to get a broader view of the role of photo-ionization and winds caused by massive stars in the structure and evolution of molecular clouds.
Due to its proximity (~400 pc; Anthony-Twarog 1982) and favored geometry, the PDR located at the edge of the Horsehead nebula is an excellent template for low-UV illuminated PDRs (Abergel et al. 2003). The Horsehead is located at the western side of the Orion B molecular cloud and is viewed nearly edge-on with respect to the illumination source (see Fig. 1), the massive O9.6V star σ Ori, which is located 3.5 pc away from the cloud (Abergel et al. 2003; Schirmer et al. 2020). The ionizing (EUV) photons arising from the star gave birth to the IC 434 H II region, and the FUV photons have shaped the edge of the Orion B molecular clouds giving rise to multiple PDRs, most notably the top of the Horsehead. The Horsehead is illuminated by a moderate radiation field (G0 ~ 100) and it has been studied extensively at different wavelengths. In particular, infrared H2 observations together with low-J CO isotopologues observed at millimeter wavelengths suggest that a steep density gradient must be present at the cloud edge (Habart et al. 2005). Furthermore, single-dish and interferometric observations have thoroughly characterized its molecular content, and have constrained the physical structure of the nebula at 0.01-0.02 pc spatial scales (Goicoechea et al. 2006; Pety et al. 2012; Gratier et al. 2013; Guzmán et al. 2013, 2014). These studies, however, provide a low angular resolution (5-10″) view of the nebula.
Here we present ALMA observations at 0/5 angular resolution (corresponding to 0.001 pc or 207 au at a distance of ~400 pc) of the CO and HCO+ line emission at the surface layers of the iconic Horsehead nebula. We discuss their role as a tracers of the physical conditions of gas and provide constraints for parameters commonly used in PDR models. The observations and data reduction are described in Sect. 2, whereas the observational results are presented in Sect. 3. In Sect. 4, we describe the radiative transfer modeling of the molecular emission and derive constraints on the physical conditions of the gas. In Sect. 5, we describe the PDR models that best reproduce the observations. We discuss the evidence of a steep density gradient and dynamical effects in the Horsehead in Sect. 6, and we summarize the results and conclusions in Sect. 7.
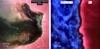 |
Fig. 1 Multiphase view of the Horsehead nebula (Barnard 33). Left: composite color image of the Horsehead nebula and part of the H II region IC 434 observed with VLT (ESO). The size of the image is about 7′ × 7′, where 1′ is equal to 0.12 pc at the Horsehead distance. Right: zoom of the edge of the molecular cloud imaged with ALMA in the CO J = 3−2 line emission (blue). The hot ionized gas coming from the H II region is traced by the Hα line emission imaged with the 0.9m KPNO telescope (Pound et al. 2003), resolving scales of about 1″ (red). The field of view in this case is approximately 50″ × 50″ or, equivalently, 0.1 pc × 0.1 pc. The synthesized beam size of the ALMA observations is shown in the bottom left corner, as well as the corresponding physical scale. The dark region between the right edge of the CO emission and the bright rim of Hα is the neutral atomic layer. |
2 Observations
The edge of the Horsehead nebula was observed with ALMA between October 7 2019 and December 12 2019, during Cycle 7 (2019.1.00558.S, PI: V.V. Guzmán). The observations were carried out in Band 7 using the 12 m array with baseline lengths between 15 and 500 m, the Atacama Compact Array (ACA) with baseline lengths between 8 and 44 m, and with the Total Power (single-dish). We observed a multiple-pointing mosaic with 39 and 14 fields, for the 12 m and ACA, respectively, both centered at α(2000) = 05h40m53s; δ(2000) = −02°27′45″, and covering a field-of-view (FoV) of approximately 50″ × 50″. Two spectral windows, centered at 345.80 and 356.73 GHz, were included in order to observe the CO J = 3−2 and HCO+ J = 4−3 lines, respectively. Other spectral windows were included in the setup targeting lines from reactive molecular ions (e.g., SH+, SO+, and HOC+), but their analysis will be discussed in a future work.
The data reduction and imaging were performed using the Common Astronomy Software Application (CASA1) version 5.6.1 (McMullin et al. 2007). The different execution blocks were calibrated following the standard pipeline of The Joint ALMA Observatory (JAO). The calibrated visibilities of the 12 m array and ACA were merged into a single Measurement Set with the concat task, and then the data was imaged with the tclean function. The spectral cubes were cleaned using a Briggs weighting with a robust parameter of 0.5. After trying different cleaning masks, we cleaned the images without any mask in order to include all the line emission from the molecular cloud and the H II region, avoiding any possible biases2. In addition, the multiscale CLEAN algorithm was used to deconvolve the dirty images in order to recover the different spatial scales of the emission. Finally, to recover the most extended emission, the Total Power observations were merged with the interfero-metric ones (corrected by the primary beam attenuation) using the feather function in CASA. After including the Total Power observations, the flux density measured in the molecular cloud increased by a factor of ~6. This emphasizes the importance of using single-dish observations as “zero-” and “short-spacing” visibilities when imaging the extended emission of molecular clouds.
The final cubes have ~0.22 km s−1 channel spacing and an average beam size of 0767 × 0.″52 (PA = −75°). The achieved rms noise measured in line-free channels is ~5 mJy beam−1, with a flux accuracy of approximately 10%. The integrated line intensity maps (see Fig. 2), as well as the peak brightness temperature map of the CO J = 3–2 line (see Fig. 7), were made with the immoments task in CASA. All the final products were rotated 14° counterclockwise to bring the exciting star direction in the horizontal δx direction. The observation parameters for each transition are detailed in Table 1.
3 Observational results
3.1 CO and HCO+ ALMA maps
We have mapped the emission from the CO J = 3−2 and HCO+ J = 4−3 molecular lines at the edge of the Horsehead PDR at high angular resolution (076). The integrated intensity maps are shown in Fig. 2, whereas the channel maps are presented in Appendix A. The red vertical line represents the horizontal zero of the maps (δx = 0), which corresponds to the empirical PDR edge commonly defined from the sharp boundary traced by start of the H2 emission (Pety et al. 2005). The two crosses represent the so-called PDR position (δx ≈ 15″, δy ≈ 1″), commonly defined as the peak of the HCO line emission (Gerin et al. 2009), and the dense core position (δx ≈ 44″, δy ≈ 17"), defined as the peak of DCO+ J = 2–1 line emission (Pety et al. 2007). With the new higher angular resolution ALMA observations we see that the location of the transition from atomic to molecular gas actually starts closer to the H II regions than previously known.
The velocity-integrated CO map reveals the structure of the molecular gas, which is characterized by the presence of bright structures embedded in an extended fainter emission pattern throughout the cloud (see top left panel in Fig. 2). The brightest structures form a web of connected filaments that are mostly parallel to the ionization front. The CO emission is present up to the edge of the cloud, and the right edge of the emission matches very well with the left side of the optical Hα emission line, which arises from the ionized gas in the H II region IC 434. The striking agreement between the edges of the CO and Hα emission in the cloud indicates a very sharp transition from ionized to molecular gas, leaving a thin layer of neutral atomic gas in between. The thickness of this layer is estimated to be a few hundred au (see Fig. 1 and Sect. 3.3). Likewise, the overlap between the CO and HCO+ maps with the H2 emission (white contours, Fig. 2) suggests that there is almost no CO-dark H2 gas.
The HCO+ line emission also shows some filamentary structure, but in contrast to CO, the emission is more concentrated in two vertical filaments (see bottom left panel in Fig. 2). We find that HCO+ traces two different environments: the cold dense gas in the FUV-shielded part of the cloud, and the warm gas in the FUV-exposed part of the cloud. To first order, the HCO+ J = 43 integrated line intensity (W in K km s−1) should scale with the gas density (Goicoechea et al. 2016), nH. Indeed, the peak of the HCO+ line emission is close to the dense core position (cyan cross, Fig. 2), which is characterized by low gas temperatures and high gas densities (T ≈ 20 K and nH > 105 cm−3; Pety et al. 2007). However, HCO+ is also bright at the edge of the cloud where the PDR is located (green cross, Fig. 2). In contrast to the dense core, the PDR is characterized by the presence of warm UV-illuminated gas with relatively high densities (T ≈ 60 K and nH ≈ 6 × 104 cm−3; Gerin et al. 2009). Therefore, the HCO+ line emission not only traces cold dense gas, but also regions exposed to the FUV radiation field. Moreover, the HCO+ filament at the PDR resembles the emission from the H2 rovibrational line and the PAH emission at 8 µm resolved by Spitzer (Schirmer et al. 2020; see bottom panels in Fig. 2), which are sensitive to the UV radiation field and the gas density (Habart et al. 2005). Indeed, the PAH emission spatially coincides with the emission of H2, which reinforces the previous expectations based on ISOCAM observations (Abergel et al. 2003), that is the mid-IR filament-shaped emission at the edge of the Horsehead nebula is mainly due to dense material illuminated by UV radiation seen nearly edge-on (Habart et al. 2005).
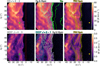 |
Fig. 2 ALMA high angular resolution images of the Horsehead nebula. Top: integrated intensity map of the CO J = 3–2 line. Bottom: integrated intensity map of the HCO+ J = 4–3 line. The green contours represent the Hα line emission (Pound et al. 2003). The cyan contours show the DCO+ J = 2–1 line emission (Pety et al. 2007). The white contours represent the H2 2.12 µm rovibrational line emission (Habart et al. 2005) and the yellow contours represent the PAH 8 µm emission (Schirmer et al. 2020). The horizontal zero (red vertical line) delineates the PDR edge. The cyan and green crosses show the dense core (Pety et al. 2007) and PDR (Gerin et al. 2009) positions, respectively. Maps have been rotated 14° counterclockwise to bring the illuminating star direction in the horizontal direction. The angular resolution of ALMA observations is shown in the bottom left corner. |
3.2 Integrated intensity profiles
To quantify the spatial distribution of the CO J = 3−2 and HCO+ J = 4−3 line emission, we extracted horizontal cuts of the emission along the Horsehead PDR. For this, we averaged and normalized the integrated line intensity of the maps over 1″ in the δy direction at different vertical positions to resolve the variation of the emission across δy. To illustrate this, the profiles of two relevant vertical positions are shown in Fig. 3: the dense core and the PDR3.
We also extracted horizontal cuts of other tracers to determine the different transition zones and the physical conditions of the emitting gas as a function of the vertical position δy. In particular, we included observations from the Hα line emission taken with the 0.9m Kitt Peak National Observatory (KPNO) telescope (Pound et al. 2003), which trace the hot ionized gas in the H II region adjacent to the Horsehead nebula with an approximate angular resolution of 1″. We also included observations from the H2 2.12 µm rovibrational line, taken with the Son Of Isaac (SOFI) infrared imager-spectrometer at the New Technology Telescope (NTT; Habart et al. 2005), which trace the molecular hydrogen excited by interactions with the UV radiation field at the edge of the nebula resolving also up to scales of ~1″. The emission of the DCO+ J = 2–1 line observed by the IRAM-30m telescope (Pety et al. 2007) was also included in order to trace the dense gas that is shielded from FUV photons. Finally, we included the emission from polycyclic aromatic hydrocarbons (PAHs) observed with the Infrared Array Camera (IRAC) from Spitzer at 8 µm (Schirmer et al. 2020). PAHs have been found to be bright at the surface layers of the Horsehead, similar to the H2 line (Abergel et al. 2003; Habart et al. 2005), and trace the atomic layer in other PDRs. The normalized profiles extracted from the other tracers at the vertical position of the PDR and dense core are also shown in Fig. 3. An example of the region covered by a single horizontal cut is shown in the right panel of Fig. 4, for the particular case of the PDR position.
The integrated intensity of both CO and HCO+ lines increases rapidly from the edge of the nebula inward, similar to the H2 line intensity (see Fig. 3). Interestingly, in both cuts (PDR and dense core vertical positions), there is a small but visible shift between the rise of H2 emission and the rise of CO emission, which indicates that we are effectively resolving the separation between the H/H2 and C+/C/CO transitions. The Hα emission, however, is rather flat inside the H II region and decreases inwards the molecular cloud but with a smaller slope. It is important to notice that the Horsehead edge is not viewed completely edge-on, but with a small inclination estimated to be ~6º (Habart et al. 2005). We are therefore seeing a fraction of the surface of the cloud in these observations.
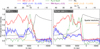 |
Fig. 3 Normalized integrated intensity profiles of the CO J = 3–2 (solid red curve) and HCO+ J = 4–3 (solid blue curve) lines along the direction of the exciting star at the PDR (left) and dense core positions (right), averaged over 1″ in the δy direction (see right panel in Fig. 4). The emission from other species such as DCO+ J = 2–1 (orange curve; Pety et al. 2007), Hα (black curve; Pound et al. 2003), H2 2.12 µm (green curve; Habart et al. 2005), and PAH 8 µm (purple curve; Schirmer et al. 2020) are also included. The spatial resolution of the observations is plotted in the top right corner. The dotted red and blue lines display the ±1σ significance levels for CO and HCO+, respectively, corresponding to the standard deviation of the average in the δy direction. |
3.3 Transition zones
The CO J = 3–2 integrated line intensity can be used to locate the region where CO starts to form, and hence of the C+/C/CO transition zone (or C/CO, in short), which can be compared with the position of the ionization front (H+/H transition traced by Hα) and the dissociation front (H/H2 transition traced by H2). The spatial coincidence between the line emission of CO and H2 at the surface layers of the molecular cloud implies that the H/H2 and C/CO transition zones are spatially very close, being apparently separated by no more than ~1200 au (approximately 3″ in Fig. 2). A similar finding was previously observed in the case of the Orion Bar PDR (Goicoechea et al. 2016), which contradicts historical constant density PDR models that commonly predict the C/CO transition to be located significantly deeper inside the cloud compared to the H/H2 transition (Hollenbach & Tielens 1999).
Based on the Hα, H2, and CO emission profiles we quantified the location of the different transition zones, by assuming a fully edge-on geometry. The ionization front is defined as the location of the peak of the Hα emission and the dissociation front is defined as the location where the derivative of the H2 profile is maximum. Similarly, the C/CO transition was defined as the location where the slope of the CO profile reaches its maximum value. It is important to keep in mind that the above definitions are rough approximations of the different transition zones, especially for the ionization front, since the Hα profile is much smoother than in the cases of H2 and CO emission, which follow very similar sharp rises with a spatial shift that is easy to define. Therefore, the accuracy of the position of the ionization front is probably not as good as in the case of the H/H2 and C/CO transition zones, but it is still a reasonable approximation.
Figure 4 shows the relevant profiles and the location of the different transition zones at the vertical position of the PDR. Additionally, to compare with predictions from PDR models, we estimated the distance projected in the plane of the sky of the dissociation front and C/CO transition zone, both with respect to the position of the ionization front. Replicating the same procedure but now for the profiles extracted at different vertical positions, we were able to derive the variation of the transition zones as a function of δy, as shown in Fig. 5.
We grouped the distance values into distributions (see top left panel, Fig. 5), and based on the 16th, 50th, and 84th percentiles, we determined the median value and the uncertainties for the distance of the different transition zones, which are illustrated by the colored areas in the bottom left panel of Fig. 5. In the case of the dissociation front (green histogram, Fig. 5) there is a bimodal distribution, with a clear peak around ~ 100 au and another less prominent one centered at ~500 au. Taking the median of the distribution, we estimate that a representative value of the distance between the H+/H and H/H2 transition zones (defined as the atomic layer) is  au, where the two modes of the distribution mentioned above are included in the uncertainties. Similarly, we estimate the separation between the H+/H and C/CO transition zones to be
  au (red histogram, Fig. 5). If we take into account the Horsehead PDR is not fully edge-on, then the real distances should be slightly smaller. Still, considering the small inclination angle, we do not expect these projected distances to change significantly. However, given the uncertainties in the estimates of the front positions, and taking into account that a significant fraction of the measured distances between the H+/H and H/H2 transitions is around ~100 au, we consider that our measurement of the length of the atomic layer should be interpreted only as an upper limit, as with ALMA we can resolve physical scales up to ~200 au.
Based on the derived distances, we can estimate the width of the CO-dark H2 gas (DG) layer between the H/H2 and C/CO transition zones. According to the median value of each distribution, the size of the DG layer is estimated to be ℓDG ~ 830 au = 1.24 × 1016 cm. The above implies a gas column density of about NH ~ (0.12–4.96) × 1020 cm−2, assuming a gas density between nH = 103 − 4 × 104 cm−3, where the minimum and maximum values correspond to estimates from our ALMA CO observations (see Sect. 6.1 for more details) and from previous C+ observations (Pabst et al. 2017), respectively. Assuming the relation NH = 1.9 × 10²¹ AV cm−2 for the local Galaxy, then the width of the DG layer in terms of visual extinction should be AV = 0.006 − 0.26 mag, which is lower than the AV = 0.6 − 0.8 mag value estimated by previous DG models, although at slightly lower G0 values (Wolfire et al. 2010). Therefore, our results are consistent with a very thin atomic layer and demonstrate that there is a small amount of CO-dark H2 gas between the molecular CO and the ionized gas in the Horsehead nebula.
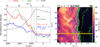 |
Fig. 4 Definition of the different transition zones. Left: zoom in version of the normalized integrated intensity profiles shown in the left panel of Fig. 3 at the vertical position of the PDR, but only including the HCO+ J = 4–3 (solid blue curve), the CO J = 3–2 (solid red curve), the Hα (solid black curve), and the H2 lines (solid green curve). The location of the ionization front, the dissociation front, and the C+/C/CO transition zone are shown by the black, green, and red vertical dashed lines, respectively. The dotted red and blue lines display the ±1σ significance levels for CO and HCO+, respectively, corresponding to the standard deviation of the average in the δy direction. Right: CO J = 3–2 integrated intensity map, showing the horizontal cut used to extract the intensity profiles at the vertical position of the PDR. The yellow rectangle shows the area where the emission of the different tracers was averaged, but in the zoom in version shown in the left panel this area was restricted between δx = −3″ to 15″ for the purpose of defining the transition zones. The two crosses, the red vertical line, and the different contours are the same as in Fig. 2. The angular resolution is plotted in the bottom left corner. |
4 Physical conditions of the gas
The peak brightness temperature (Tpeak in K) of a line can be approximated as Tpeak = [J(Tex) − J(Tbg)]![Mathematical equation: $\left( {1 - {{\rm{e}}^{ - {\tau _{{\rm{line}}}}}}} \right) \approx J\left( {{T_{{\rm{ex}}}}} \right)\left( {1 - {{\rm{e}}^{{ - ^{ - {\tau _{{\rm{line}}}}}}}}} \right) = {{{E_{{\rm{up}}}}} \mathord{\left/ {\vphantom {{{E_{{\rm{up}}}}} {{k_{\rm{B}}}}}} \right. \kern-\nulldelimiterspace} {{k_{\rm{B}}}}} \times \left[ {\exp \,\left( {{{{E_{{\rm{up}}}}} \mathord{\left/ {\vphantom {{{E_{{\rm{up}}}}} {{k_{\rm{B}}}{T_{{\rm{ex}}}}}}} \right. \kern-\nulldelimiterspace} {{k_{\rm{B}}}{T_{{\rm{ex}}}}}}} \right) - 1} \right]^{-1}\,\left( {1 - {{\rm{e}}^{{ - ^{ - {\tau _{{\rm{line}}}}}}}}} \right) $](/articles/aa/full_html/2023/09/aa47206-23/aa47206-23-eq3.png) , where Tex and Tbg are the excitation and background temperature, respectively (Tex ≫ Tbg for CO in warm gas), Eup is the upper level energy for a given transition, and τline is the optical depth of the line. However, if the line is optically thick, then we have
, where Tex and Tbg are the excitation and background temperature, respectively (Tex ≫ Tbg for CO in warm gas), Eup is the upper level energy for a given transition, and τline is the optical depth of the line. However, if the line is optically thick, then we have  , and thus Tpeak only depends on Tex. Therefore, the peak brightness temperature of optically thick lines (τline ≫ 1) is a powerful tracer of the gas temperature, Tkin, provided that the gas density is well above the critical density of the line in question (nH ≫ ncr). In particular, CO transitions corresponding to low rotational levels are optically thick (τCO3-2 ≫ 1) and have relatively low critical densities, falling between ncr = (0.22 − 3.73) × 104 cm−3 for the first three radiative transitions. Consequently, for gas densities above ~104 cm−3, the low-J CO lines should be thermalized and
  approximate the excitation temperature (Goicoechea et al. 2016).
On the other hand, the integrated intensity of the HCO+ J = 4−3 line ( ) can be used to trace the gas density if the line opacity is low, since it has a relatively high critical density (ncr > 5 × 106 cm−3) compared to typical gas density values found in the Horsehead. In particular, when there is subthermal excitation,
  is approximately linearly proportional to the column density, which can be written as a function of the gas density as N(HCO+) = x(HCO+)nHℓ, where ℓ is the cloud length along the line of sight. Therefore, for
  the line is subthermally excited, and
  should be linearly proportional to nH (Goicoechea et al. 2016).
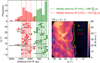 |
Fig. 5 Location of the ionization, dissociation, and C+/C/CO transition zones. Left: distances of the dissociation front (H/H2, green dots) and C+/C/CO transition zone (C/CO, red dots) with respect to the ionization front (IF) for different δy vertical positions. The distributions of the distances are shown in the top panel, where the solid vertical lines represent the median values, and the dashed lines represent the uncertainties based on the 16th and 84th percentiles of each distribution. Right: IF (yellow), H/H2 (green), and C/CO (red) transition zones overlaid on top of the CO J = 3–2 integrated intensity map. The two crosses mark the PDR and dense core positions. The angular resolution is plotted in the bottom left corner. |
4.1 Radiative transfer models
To assess the physical conditions (temperature and density) of the emitting gas at the edge of the Horsehead nebula, we ran a grid of models using the nonlocal thermodynamic equilibrium (non-LTE) radiative transfer code RADEX4 (van der Tak et al. 2007). We explored a range of gas temperatures and densities, with fixed CO and HCO+ column densities, and compare the observed  and
and  values with those predicted by RADEX. We included the inelastic collisional rates of CO with both H (Walker et al. 2015) and H2 (with ortho- and para-H2 distinction; Yang et al. 2010), and of HCO+ with H2 (Flower 1999). In the case of HCO+, collisional rates are also available for electrons (Faure & Tennyson 2001) but they do not have a strong impact on the results even though the ionization fraction is high in the Horsehead PDR (Goicoechea et al. 2009) and, therefore, they were not included in the models. Alternatively, collisions with atomic H can have a meaningful contribution in PDRs since the gas is not fully molecular (f < 1, where f = 2n(H2)/[n(H) + 2n(H2)] is the molecular gas fraction). We tried a range of values for the molecular fraction (f = 0.5−1), and found that the results did not change significantly. We therefore adopted a value of f = 0.8, similar to other PDRs (Goicoechea et al. 2016). The temperature of the cosmic microwave background was fixed at TCMB = 2.73 K and we assumed a line width of FWHM = 1 km s−1 based on the observed line profiles. We ran our grid of models varying the H2 density from 5 × 10³ to 1 × 107 cm−3, with a fixed gas temperature when modeling the HCO+ line, and varying the temperature from 20 to 100 K for fixed values of
  when modeling the CO line.
Regarding the column densities, they were fixed based on previous estimates. In the case of HCO+, a column density of about N(HCO+) ~ 8 × 1012 cm−2 was determined from multi-J observations with IRAM-30m telescope in the Horsehead (M.G. Santa-Maria, priv. comm.). To take into account possible beam dilution effects, since our observations have higher angular resolution, we ran our models with a range of column densities that include larger values of N(HCO+) = (0.8−1.2) × 1013 cm−2. In the case of CO, a column density of about N(CO) ~ 1018 cm−2 was found at the PDR position based on C18O observations with the IRAM Plateau de Bure Interferometer (PdBI; Pety et al. 2005) and the standard isotopic ratio of 16O/18O = 560 (Wilson & Rood 1994). We used a slightly lower range of column densities of N(CO) = (1−5) × 1017 cm−2. Indeed, previous C+ observations show an extended emission from the neutral atomic layer (Pabst et al. 2017; Bally et al. 2018) that coincides with part of the CO emission. Thus, part of the carbon inventory in the molecular cloud may be in its atomic form (either in C or C+), and therefore the column density of CO could be lower than that estimated from C18O, in particular at the cloud edge. The model predictions for  and
and  are shown in Fig. 6.
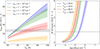 |
Fig. 6 Non-LTE radiative transfer models for different gas physical conditions at the PDR. Left: expected CO J = 3−2 peak brightness temperature as a function of the gas temperature for N(CO) = (1.0−5.0) × 1017 cm−2 and different gas densities (colored lines). Right: expected HCO+ J = 4−3 integrated line intensity as a function of the gas density for N(HCO+) = (0.8−1.2) × 1013 cm−2 and different gas temperatures (colored lines). The solid lines display the model predictions for N(CO) = 3 × 1017 cm−2 and N(HCO+) = 1 × 1013 cm−2, and the colored areas represent the possible range of values for the assumed range of column densities. In both panels, the gray shaded areas represent the observations at the PDR position, with a ±1σ uncertainty. |
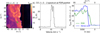 |
Fig. 7 CO J = 3−2 peak brightness temperature. Left: |


4.2 Gas temperature
We find that  is very sensitive to changes in Tkin as was expected (see left panel in Fig. 6) and is not very sensitive to the density when the gas density is high (≳ 4 × 104 cm−3). However, as soon as the gas density drops below 104 cm−3,
  is no longer a good tracer of the gas temperature since the line is no longer thermalized. Our ALMA observations show that
  45 K at the Horsehead edge (see left panel, Fig. 7), however, the observed value at the PDR position is only
  K (δx ≈ 15″ in right panel, Fig. 7). To reproduce the observed
  , the gas temperature would have to be ≲ 40 K if we consider the gas density of 6 × 104 cm−3, which has been previously inferred from lower angular resolution observations (blue line, left panel in Fig. 6). This is lower than what has been previously estimated, also from low angular resolution observations, which suggests temperatures of about 60 K at the PDR position (Pety et al. 2005). We note that the ALMA single-dish observations presented here of the CO J = 3−2 line are consistent with previous observations from Caltech Submillimeter Observatory (CSO) and the Atacama Pathfinder Experiment (APEX) telescope (Philipp et al. 2006; Bally et al. 2018).
To understand the lower than expected gas temperature, we inspected the line profiles at different positions in the observed field of view. We found that near the PDR position the line profiles are not Gaussian, show asymmetries, and present evidence of self-absorption at the source velocity (~10.5 km s−1) that can be associated with CO-emitting layers with lower densities, suggesting the presence of a density gradient in the line of sight. The middle panel in Fig. 7 shows the extracted spectra at the PDR position, where a dip in emission is clearly seen at the line center. The same behaviour has been previously reported for the CO J = 1−0 and J = 2−1 lines with both single-dish (Abergel et al. 2003) and interferometric (Pety et al. 2005) observations. A similar effect has been found in the anomalous HCN J = 1 − 0 hyperfine line ratios toward the Horsehead PDR, which has been attributed to self-absorption produced by resonant scattering through a diffuse cloud envelope (Goicoechea et al. 2022b). Indeed, considering that the Horsehead is not fully edge-on, the presence of density gradients along the line of sight cannot be discarded. Therefore, we conclude that the gas temperatures inferred from the observed  values should be interpreted only as lower limits, since the CO emission could be affected by low density gas in the line of sight.
4.3 Gas density
We find that  is indeed proportional to nH with a characteristic behavior for a linear dependence on a linear-log plot (see right panel in Fig. 6, where the x-axis is on logarithmic scale). The observed HCO+ J = 4−3 integrated line intensity is about
  ≈ 1.28 ± 0.06 K km s−1 at the PDR position (located at δx ~ 15″; see Fig. 3). In order to reproduce the observed
  , our models predict a gas density of nH = (3.9−6.6) × 104 cm−3 for a gas temperature of Tkin = 60 K (red line, right panel in Fig. 6), whereas for the lower limit that we obtained from
  in the PDR (Tkin ≳ 40 K), we estimate an upper limit for the gas density of about nH ≲ 105 cm−3 (green line, right panel in Fig. 6). This is in good agreement with the estimated value from lower angular resolution observations (Gerin et al. 2009) of nH = 6 × 104 cm−3, suggesting the PDR would not be strongly compressed compared to the ambient cloud. Interestingly, the HCO+ integrated intensity is particularly bright in the surface layers of the Horsehead PDR compared to its surroundings (see Fig. 2 and profiles in Fig. 3). More precisely, there is a “gap” in the emission between the PDR and dense core positions (δx ~ 25–30″ in our figures), which could be a direct sign of compression at the edge of the Horsehead nebula, if we assume that
  is proportional to nH.
To quantify the compression factor, we estimated the gas density in the gap. As one moves deeper into the molecular cloud toward the dense core position, Tkin is expected to decrease (Pety et al. 2007; Gratier et al. 2013) while N(HCO+) should increase (Goicoechea et al. 2009). Thus, by running RADEX with conservative physical conditions expected for the gas between the PDR and the dense core (namely, for δx ~ 25–30″ we assumed intermediate values of Tkin = 20–40 K and N(HCO+) = 5 × 1013 cm−2), and assuming a FWHM = 0.7 km s−1 based on the observations, then the gas density that best reproduces the observed  K km s−1 integrated intensity in the gap is nH = (0.5 − 2.4) × 104 cm−3. By comparing the densities derived from
  for the PDR and the gap, we estimate a compression factor between 2–13, which is in the lower range compared to other strongly illuminated PDRs, like the Orion Bar (compression factor of about 5–30; Goicoechea et al. 2016). The difference could be related to the order of magnitude difference in their respective UV radiation fields. Therefore, the gas at the Horsehead PDR is apparently not as highly compressed, which is consistent with the rather smooth HCO+ line emission observed near the PDR position (see the bottom left panel in Fig. 2).
4.4 Gas pressure
To further investigate the gas compression at the Horsehead PDR, we compared the thermal and nonthermal components of the gas pressure at different locations. In the case of the PDR position (δx ~ 15), our estimates for the gas density, together with previous temperature measurements, would imply a thermal pressure of Pth = nHTkin ≈ (2.3 – 4.0) × 106 K cm−3 that is consistent with previous estimates (Habart et al. 2005). On the other hand, the assumed temperatures and the estimated range of densities for the gap imply thermal pressures of about Pth ≈ (2.0 − 4.8) × 105 K cm−3, which are lower than the values at the PDR position. Instead, the above values agree with the thermal pressures predicted at the adjacent H II region IC 434 (Bally et al. 2018), where Pth,H II ≈ neTe = (2.4 − 8.0) × 105 K cm−3. This difference in thermal pressures between the PDR position and its surroundings is consistent with a compression scenario.
Furthermore, based on the gas density values derived from HCO+, along with the observed line profiles, we also estimated the turbulent ram pressure at different positions. This nonthermal component of the pressure could be defined as  , where the turbulent (nonthermal) velocity dispersion (σnth) can be measured from the observed HCO+ line profiles as
  , where
  . At the PDR position, we measured
  , which for Tkin = 60 K implies a nonthermal pressure of approximately Pnth ≈ 106 K cm−3. Likewise, close to the gap of HCO+ we obtained ∆υFWHM ≈ 0.71 km s−1, which for Tkin = 30 K leads to Pnth ≈ 105 K cm−3. In both positions, we find that Pth ~ Pnth, which implies that the different pressure components are in equipartition.
4.5 Estimated magnetic field strength
If we extend the equipartition between thermal and turbulent (nonthermal) components of the pressure to the magnetic field component (PB = B2/8πk), then we can estimate the magnetic field strength in the Horsehead. By assuming that the magnetic pressure at the PDR position is on the order of  , then we infer a magnetic field strength of about B ~ 60 µG in that part of the molecular cloud. Our estimation is in good agreement with previous measurements in other sources of the Orion B molecular cloud, such as NGC 2024 (Crutcher 1999; Roshi et al. 2014) and NGC 2071 (Matthews et al. 2002), and with observations from polarized dust taken with the James Clerk Maxwell Telescope (JCMT) that recently deduced a magnetic field strength of B = 56 ± 9 µG in the Horse-head PDR (Hwang et al. 2023), indicating that the equipartition assumption is reasonable for the Horsehead conditions.
5 PDR modeling
To assess whether the extremely small separations that we observe between the ionization front (IF), the dissociation front (H/H2), and the C+/C/CO transition (C/CO) are consistent with the traditional stationary view of PDRs or are actually evidence of important dynamical effects, like photoevaporation as predicted by models (Maillard et al. 2021), we compare the measured distances between the fronts to the predictions of the Meudon PDR code5 (Le Petit et al. 2006). The Meudon PDR code computes the radiative transfer in UV lines and thus the photo-destruction rates of H2 and CO, as well as their formation rates on grains and in the gas (Goicoechea & Le Bourlot 2007; Le Bourlot et al. 2012). The chemical abundances of these species in the cloud can then be determined as well as the locations of the H/H2 and C/CO transitions. We use as observational constraints a distance of  au between the IF and C/CO transition, and an upper limit of <650 au for the distance between the IF and H/H2 dissociation front (see Fig. 5). We use an upper limit for the latter distance since after considering the uncertainties the distance is comparable to the beam size of the CO observations.
We explore a range of radiation field intensities G0 = 50–186 in Habing units (or, equivalently, χ = 30–110 in Draine units), in agreement with previous studies of the Horsehead (Habart et al. 2005). As a first approximation for dust extinction, we use the standard Galactic extinction curve (Fitzpatrick & Massa 1986). Particularly, for the Horsehead conditions, the absorption of dissociating photons is dominated by H2 electronic absorption lines and not dust extinction (Sternberg et al. 2014), so that the choice of dust extinction properties is not expected to affect the position of the dissociation front significantly. For each produced PDR model, we determine the locations of the H/H2 and C/CO transitions and compare their distances from the IF to the ones deduced from the observations. With the Meudon PDR code, we can simulate a medium with constant density or with constant thermal pressure (isobaric case). Alternatively, it can also read user defined density profiles. In the Horsehead PDR case, the presence of a strong density gradient had already been suggested by lower angular resolution observations (Habart et al. 2005; Guzmán et al. 2011), where different prescriptions for a density profile were proposed. For instance, using H2 and low− J CO observations, a steep density gradient was found at the edge of the Horsehead and suggested a density profile represented as a power law followed by a constant density medium at nH = 2 × 105 cm−3 (Habart et al. 2005). A similar density profile was then used to reproduce observations of H2CO (Guzmán et al. 2011). Indeed, we verified that the PDR models with constant density cannot reproduce the observations. However, the comparison to the observed distances also shows that PDR models using previous density profile prescriptions are incompatible with the observations. The H/H2 transition is too deep in the PDR by at least a factor 2 compared with the upper limit found with the observations, and the C/CO transition is too far by at least a factor 3.
These profiles were initially proposed to emulate the density gradient that counterbalances the decreasing temperature gradient in an isobaric PDR. Indeed, recent ALMA and Herschel observations of molecular tracers at the edge of PDRs strongly suggest that the warm layer of PDRs is isobaric with relatively large thermal pressures controlled by the intensity of the incident dissociating radiation field (Marconi et al. 1998; Goicoechea et al. 2016; Joblin et al. 2018; Wu et al. 2018; Bron et al. 2018; Maillard et al. 2021). We thus also compared the measured front distances to isobaric PDR models. In this case, at each position the code solves the thermal balance and deduces the gas temperature based on the given thermal pressure and radiation field intensity. Since Pth = nHTkin, then the density is derived at each position, creating a natural gradient of the density (Joblin et al. 2018). We produced a grid of PDR models with a range of pressures between Pth = 2 × 10⁵ to 107 K cm−3, based on our estimations (see Sect. 4.4). Figure 8 summarizes the range of parameters for which the models are found to be compatible with the observations presented in this paper. Models with Pth between (3.7−9.2) × 106 K cm−3 can reproduce the observational constraints on the distances between the fronts, which is also consistent with our estimates for the thermal gas pressure. We also checked that these models are compatible with the intensity of the CO J = 3−2 line. This demonstrates that it is possible to explain the short distances between the IF, the H/H2, and C/CO transition zones in the frame of stationary models.
6 Discussion
6.1 Steep density gradient
The ALMA images imply a narrow neutral atomic layer at the surface of the Horsehead nebula (≲ 600 au). This intermediate zone between the H II region and the molecular gas appears to be much thinner than in the case of the Orion Bar PDR, where the separation between the ionization and dissociation fronts is about 6000 au (approximately 15″ at a distance of 414 pc; Goicoechea et al. 2016). Nevertheless, previous infrared observations at 15″ resolution show extended C+ emission along the Horsehead and IC 434 front (Pabst et al. 2017; Bally et al. 2018). Since C+ observations are a direct tracer of the PDR edge, then some of the CO emission we detect toward the cloud edge probably arises from gas layers where not all carbon is in its molecular form but in either C or C+.
The above is consistent with what we see at the edge of the Horsehead, beyond the PDR position (δx ≲ 5″ in our figures). In that part of the cloud, the emission does not seem to be very affected by self-absorption effects, since the line profiles are approximately Gaussian. Still, if the CO J = 3−2 line is ther-malized, we would expect  values as high as ~80–90 K since the more exposed layers should present higher temperatures (Pety et al. 2005), on the order of Tkin ≳ 100 K (see Fig. 6). Since we do not recover such high temperatures at the cloud edge (see Fig. 7), we conclude that nH < ncr. Indeed, towards the surface layers of the Horsehead, a lower CO column density is expected (Pety et al. 2005), and we found that the observed values of
  at the edge of the cloud are compatible with the expected temperatures for gas densities of about nH ~ 103 cm−3 and N(CO) ~ 1 × 1017 cm−2 (red line, left panel in Fig. 6). Both values are lower than those foreseen at the PDR position from C18O observations (Pety et al. 2005), which supports the presence of a steep density gradient as previously suggested for the Horsehead edge (Habart et al. 2005). The approximation of
  to Tkin is therefore no longer valid in this region.
Predictions from PDR models also suggest a similar scenario. We verified that stationary cloud models with constant gas density can reproduce the observed distance between the ionization and dissociation fronts in the Horsehead, but fail to reproduce the location of the C/CO transition zone. This suggests that the density is not constant but a steep density gradient is present at the edge of the PDR. Indeed, isobaric stationary models can reproduce the separation between the different transition zones with a representative thermal pressure of Pth = 6 × 10⁶ K cm−3 for a radiation field of G0 = 100 (see Fig. 8), consistent with our estimates from the ALMA images and the presence of a density gradient (Habart et al. 2005). Other PDRs are also generally best modeled with a constant thermal pressure (Marconi et al. 1998; Joblin et al. 2018). In particular, highly UV-illuminated and denser PDRs are best modeled with an isobaric prescription but with larger thermal pressures (Pth ~ 108 K cm−3; Joblin et al. 2018).
Stationary models are, however, a simplification of real PDRs which are most likely affected by dynamical processes induced by the UV radiation field (Goicoechea et al. 2016; Joblin et al. 2018). Actually, different star formation and stellar feedback numerical codes that simulate the expansion of an H II region using hydrodynamics agree that strong density contrasts are present close to the IF (Bisbas et al. 2015), consistent with what we observe here thanks to the high angular resolution. Dynamical effects have also been proposed to explain the discrepancy between the modeled and observed H2 line intensities in PDRs (Habart et al. 2011). Indeed, the intensities of the rotationally excited H2 lines can be underestimated in low and moderately excited PDRs (Habart et al. 2004, 2011).
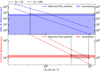 |
Fig. 8 Range of parameters compatible with the distances measured in the observations. Top: distance between the ionization front (IF) and the H/H2 transition (dissociation front). The blue zone represents the upper limit that has been derived for the distance between the IF and the dissociation front. The blue dashed lines indicates the distance found by the Meudon PDR code for two radiation fields (G0 = 50 and 186) and different thermal pressures (Pth). The models compatible with the observations are those in the blue zone. Bottom: same but for the distance between the IF and C/CO transition. The domain of parameters that reproduce the distances is represented by the black dashed squares. |
6.2 Dynamical effects
Far-ultraviolet radiation plays an important role in setting the thermal gas pressure in star-forming clouds at all spatial scales, which is illustrated by the apparent G0 − Pth correlation found in diverse environments, from local PDRs located at the rims of molecular clouds to entire star-forming galaxies (Wolfire et al. 2022). In the Horsehead case, we estimate the thermal pressure at the PDR position to be Pth = nPDRTPDR = (2.3 − 4.0) × 106 K cm−3, which agrees with estimations toward other PDRs spanning different values of G0 (Joblin et al. 2018). However, our Pth value is higher than what is expected in an H II region and PDR interface that is at pressure equilibrium (Seo et al. 2019). In fact, by comparing with the estimated pressure in the IC 434 H II region (Bally et al. 2018), we find Pth,PDR > Pth,H II. Based on these out of equilibrium values, and the compression factor that we estimated in Sect. 4.3, we conclude that dynamical effects are probably relevant in the Horsehead PDR, and that compression and photoevaporation may be at work, as previously suggested by observations of the ionized gas (Bally et al. 2018) and dynamical PDR models (Maillard et al. 2021).
Moreover, according to our definition of the different transition zones (see Fig. 4), there seems to be a correlation between the position of the fronts and the variation of the edge of the cloud (see right panel, Fig. 5). Interestingly, the above correlation has an apparent vertical oscillation with a certain periodicity. Indeed, by using a Lomb-Scargle periodogram, we detected a periodic signal with a period of approximately 23″, equivalent to physical scales of about 0.05 pc. A similar kind of oscillatory behavior has been witnessed before on the surface of the Orion molecular cloud, which is likely associated with a Kelvin-Helmholtz instability (Berné et al. 2010). Another possible explanation could be the presence of a thin shell instability, where the shell of an spherical expanding shock undergoes an oscillatory fragmentation due to dynamic and gravitational perturbations (Vishniac 1983). Thus, our results could be an observational proof of dynamical effects at the edge of the Horsehead nebula.
Even though our results show that stationary models are compatible with the observations, the distance between the IF and the H/H2 front measured with the observations presented here is only an upper limit, then any model predicting a smaller separation between these two fronts would also be compatible. In particular, PDR models that include dynamical effects have found that the size of the atomic layer can be significantly reduced compared to stationary models. The IF and H/H2 transition can even merge in a single front (Maillard et al. 2021). Low excitation PDRs, like the Horsehead, have been found to be more affected. We therefore cannot discriminate between a stationary PDR model and a dynamical PDR with a reduced IF-H/H2 distance (or even merged fronts). Consequently, we cannot rule out that dynamical effects are at play in the Horsehead. Higher angular resolution observations are needed to better estimate the distances between the H/H2 and H+/H transition fronts, and determine the importance of dynamical effects. Future observations with the Mid-InfraRed Instrument (MIRI) on board JWST of the H2 rotational lines will also be key to assess the importance of dynamical effects in the Horsehead as well as in other PDRs (Berné et al. 2022).
7 Summary
We have obtained the sharpest images of the molecular gas emission in the Horsehead nebula. The new ALMA images have revealed the fundamental, small scale, structure of the gas at the mildly UV-illuminated rim of a molecular cloud, which is characterized by a web of bright filaments embedded in an extended fainter cloud emission. Under stellar UV irradiation conditions and dust content typical of Milky Way star-forming regions, the rims of molecular clouds such as the Horsehead nebula show steep density gradients and a very sharp transition between the molecular gas and the ionized gas. This emphasizes the role of CO as a powerful tracer of the bulk molecular gas physical conditions. Based on the measured distances between the different transition zones, our observations suggest that the atomic layer is very thin (<650 au) and the amount of CO-dark H2 gas in the Horsehead PDR is very small (AV = 0.006 − 0.26 mag). The observed distances between the ionization and dissociation fronts, as well as between the ionization front and the C+/C/CO transition zone, are well reproduced by isobaric stationary models with a UV radiation field between G0 = 50 – 186, based on previous estimates, and thermal gas pressures of Pth,model = (3.7 − 9.2) × 106 K cm−3, which is consistent with our estimates from the physical conditions of the gas, Pth,obs = (2.3 – 4.0) × 106 K cm−3. However, based on the pressure imbalance between the H II region and the molecular cloud surface, we cannot rule out dynamical effects with the current observations. Future JWST observations of the intensity of the H2 rotational lines will help to determine the importance of dynamical effects in PDRs. Additionally, taking into account the evidence of compression, possible ALMA observations of other molecular lines could be explored to determine the temperature and density in the compressed area, such as H2CO which has quite strong lines that can be combined to get either the gas density or the gas temperature (e.g., Guzmán et al. 2011).
Acknowledgements
The authors thank the referee for the constructive comments that improved the content of this work. We also thank the ALMA Data Analysts and Support Scientists from the North American ALMA Science Center (NAASC) for their support in data reduction. This paper makes use of the following ALMA data: ADS/JAO.ALMA#2019.1.00558.S. ALMA is a partnership of ESO (representing its member states), NSF (USA) and NINS (Japan), together with NRC (Canada), MOST and ASIAA (Taiwan), and KASI (Republic of Korea), in cooperation with the Republic of Chile. The Joint ALMA Observatory is operated by ESO, AUI/NRAO and NAOJ. The National Radio Astronomy Observatory is a facility of the National Science Foundation operated under cooperative agreement by Associated Universities, Inc. C.H.-V. acknowledges support from the National Agency for Research and Development (ANID) – Scholarship Program through the Doctorado Nacional grant no. 2021-21212409. V.V.G. gratefully acknowledges support from FONDECYT Regular 1221352, ANID BASAL projects ACE210002 and FB210003, and ANID – Millennium Science Initiative Program – NCN19_171. J.R.G. thanks the Spanish MICINN forfunding support under grant PID2019-106110GB-I00. V.M., J.P.,F.L.P., M.G., E.B., E.R., P.G. acknowledge support by the Programme National “Physique et Chimie du Milieu Interstellaire” (PCMI) of CNRS/INSU with INC/INP, co-funded by CEA and CNES.
Appendix A Channel maps
Several filamentary structures can be distinguished in the channel maps (see Fig. A.1). For example, a bright filament is clearly seen at the north of the image at 9.84 km s−1 in both CO and HCO+. Another one is seen towards the south of the image at 10.94 km s−1, close to the PDR position, that is almost parallel to the ionization front. A few compact structures are also seen in CO, for example the one near the center of the image at low velocities (between 9.6 − 10.0 km s−1). The edge of the Horse-head is seen at intermediate velocities, near the systemic velocity of about 10.5 km s−1. HCO+ is brighter in the UV-shielded part of the cloud, close to the dense core position, but the line also shines at the UV-illuminated edge of the cloud, tracing a filament of dense gas that is parallel to the ionization front.
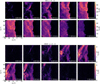 |
Fig. A.1 Slices of the full ALMA data cubes, showing the CO J = 3−2 (top) and HCO+ J = 4−3 (bottom) line emission at different velocities, ranging from 9.62 km s−1 to 11.60 km s−1 with a spectral resolution of 0.22 km s−1. Data cubes were rotated 14° counterclockwise to bring the illuminating star direction in the horizontal direction. The synthesized beam size and the kinematic local standard of rest (LSRK) velocities are shown in the bottom left and right corner of each panel, respectively. |
References
- Abergel, A., Teyssier, D., Bernard, J. P., et al. 2003, A&A, 410, 577 [CrossRef] [EDP Sciences] [Google Scholar]
- Anthony-Twarog, B. J. 1982, AJ, 87, 1213 [NASA ADS] [CrossRef] [Google Scholar]
- Bally, J., Chambers, E., Guzman, V., et al. 2018, AJ, 155, 80 [Google Scholar]
- Berné, O., Marcelino, N., & Cernicharo, J. 2010, Nature, 466, 947 [CrossRef] [Google Scholar]
- Berné, O., Habart, É., Peeters, E., et al. 2022, PASP, 134, 054301 [CrossRef] [Google Scholar]
- Bisbas, T. G., Haworth, T. J., Williams, R. J. R., et al. 2015, MNRAS, 453, 1324 [NASA ADS] [CrossRef] [Google Scholar]
- Bron, E., Agúndez, M., Goicoechea, J. R., & Cernicharo, J. 2018, ArXiv e-prints [arXiv:1801.01547] [Google Scholar]
- Crutcher, R. M. 1999, ApJ, 520, 706 [NASA ADS] [CrossRef] [Google Scholar]
- Draine, B. T. 1978, ApJS, 36, 595 [Google Scholar]
- Elmegreen, B. G., & Lada, C. J. 1977, ApJ, 214, 725 [Google Scholar]
- Faure, A., & Tennyson, J. 2001, MNRAS, 325, 443 [NASA ADS] [CrossRef] [Google Scholar]
- Fitzpatrick, E. L., & Massa, D. 1986, ApJ, 307, 286 [NASA ADS] [CrossRef] [Google Scholar]
- Flower, D. R. 1999, MNRAS, 305, 651 [Google Scholar]
- Gerin, M., Goicoechea, J. R., Pety, J., & Hily-Blant, P. 2009, A&A, 494, 977 [NASA ADS] [CrossRef] [EDP Sciences] [Google Scholar]
- Goicoechea, J. R., & Le Bourlot, J. 2007, A&A, 467, 1 [NASA ADS] [CrossRef] [EDP Sciences] [Google Scholar]
- Goicoechea, J. R., Pety, J., Gerin, M., et al. 2006, A&A, 456, 565 [NASA ADS] [CrossRef] [EDP Sciences] [Google Scholar]
- Goicoechea, J. R., Pety, J., Gerin, M., Hily-Blant, P., & Le Bourlot, J. 2009, A&A, 498, 771 [NASA ADS] [CrossRef] [EDP Sciences] [Google Scholar]
- Goicoechea, J. R., Pety, J., Cuadrado, S., et al. 2016, Nature, 537, 207 [Google Scholar]
- Goicoechea, J. R., Cuadrado, S., & Le Petit, F. 2022a, in Eur. Phys. J. Web Conf., 265, 00003 [CrossRef] [EDP Sciences] [Google Scholar]
- Goicoechea, J. R., Lique, F., & Santa-Maria, M. G. 2022b, A&A, 658, A28 [NASA ADS] [CrossRef] [EDP Sciences] [Google Scholar]
- Gratier, P., Pety, J., Guzmán, V., et al. 2013, A&A, 557, A101 [CrossRef] [EDP Sciences] [Google Scholar]
- Grenier, I. A., Casandjian, J.-M., & Terrier, R. 2005, Science, 307, 1292 [Google Scholar]
- Guzmán, V., Pety, J., Goicoechea, J. R., Gerin, M., & Roueff, E. 2011, A&A, 534, A49 [NASA ADS] [CrossRef] [EDP Sciences] [Google Scholar]
- Guzmán, V. V., Goicoechea, J. R., Pety, J., et al. 2013, A&A, 560, A73 [Google Scholar]
- Guzmán, V. V., Pety, J., Gratier, P., et al. 2014, Faraday Discuss., 168, 103 [Google Scholar]
- Habart, E., Boulanger, F., Verstraete, L., Walmsley, C. M., & Pineau des Forêts, G. 2004, A&A, 414, 531 [NASA ADS] [CrossRef] [EDP Sciences] [Google Scholar]
- Habart, E., Abergel, A., Walmsley, C. M., Teyssier, D., & Pety, J. 2005, A&A, 437, 177 [NASA ADS] [CrossRef] [EDP Sciences] [Google Scholar]
- Habart, E., Abergel, A., Boulanger, F., et al. 2011, A&A, 527, A122 [NASA ADS] [CrossRef] [EDP Sciences] [Google Scholar]
- Habart, E., Le Gal, R., Alvarez, C., et al. 2023, A&A, 673, A149 [NASA ADS] [CrossRef] [EDP Sciences] [Google Scholar]
- Hacar, A., Clark, S. E., Heitsch, F., et al. 2023, ASP Conf. Ser., 534, 153 [NASA ADS] [Google Scholar]
- Hollenbach, D. J., & Tielens, A. G. G. M. 1999, Rev. Mod. Phys., 71, 173 [Google Scholar]
- Hwang, J., Pattle, K., Parsons, H., Go, M., & Kim, J. 2023, AJ, 165, 198 [NASA ADS] [CrossRef] [Google Scholar]
- Joblin, C., Bron, E., Pinto, C., et al. 2018, A&A, 615, A129 [NASA ADS] [CrossRef] [EDP Sciences] [Google Scholar]
- Kaufman, M. J., Wolfire, M. G., Hollenbach, D. J., & Luhman, M. L. 1999, ApJ, 527, 795 [Google Scholar]
- Kennicutt, Robert C. J. 1998, ApJ, 498, 541 [NASA ADS] [CrossRef] [Google Scholar]
- Kim, J.-G., Kim, W.-T., & Ostriker, E. C. 2018, ApJ, 859, 68 [NASA ADS] [CrossRef] [Google Scholar]
- Le Bourlot, J., Le Petit, F., Pinto, C., Roueff, E., & Roy, F. 2012, A&A, 541, A76 [NASA ADS] [CrossRef] [EDP Sciences] [Google Scholar]
- Le Petit, F., Nehmé, C., Le Bourlot, J., & Roueff, E. 2006, ApJS, 164, 506 [NASA ADS] [CrossRef] [Google Scholar]
- Luisi, M., Anderson, L. D., Schneider, N., et al. 2021, Sci. Adv., 7, eabe9511 [NASA ADS] [CrossRef] [Google Scholar]
- Maillard, V., Bron, E., & Le Petit, F. 2021, A&A, 656, A65 [NASA ADS] [CrossRef] [EDP Sciences] [Google Scholar]
- Marconi, A., Testi, L., Natta, A., & Walmsley, C. M. 1998, A&A, 330, 696 [NASA ADS] [Google Scholar]
- Matthews, B. C., Fiege, J. D., & Moriarty-Schieven, G. 2002, ApJ, 569, 304 [Google Scholar]
- McMullin, J. P., Waters, B., Schiebel, D., Young, W., & Golap, K. 2007, ASPConf. Ser., 376, 127 [NASA ADS] [Google Scholar]
- Pabst, C. H. M., Goicoechea, J. R., Teyssier, D., et al. 2017, A&A, 606, A29 [NASA ADS] [CrossRef] [EDP Sciences] [Google Scholar]
- Pabst, C., Higgins, R., Goicoechea, J. R., et al. 2019, Nature, 565, 618 [NASA ADS] [CrossRef] [Google Scholar]
- Pety, J., Teyssier, D., Fossé, D., et al. 2005, A&A, 435, 885 [NASA ADS] [CrossRef] [EDP Sciences] [Google Scholar]
- Pety, J., Goicoechea, J. R., Hily-Blant, P., Gerin, M., & Teyssier, D. 2007, A&A, 464, L41 [NASA ADS] [CrossRef] [EDP Sciences] [Google Scholar]
- Pety, J., Gratier, P., Guzmán, V., et al. 2012, A&A, 548, A68 [NASA ADS] [CrossRef] [EDP Sciences] [Google Scholar]
- Philipp, S. D., Lis, D. C., Güsten, R., et al. 2006, A&A, 454, 213 [NASA ADS] [CrossRef] [EDP Sciences] [Google Scholar]
- Pineda, J. E., Arzoumanian, D., André, P., et al. 2023, ASP Conf. Ser., 534, 233 [NASA ADS] [Google Scholar]
- Pound, M. W., Reipurth, B., & Bally, J. 2003, AJ, 125, 2108 [NASA ADS] [CrossRef] [Google Scholar]
- Roshi, D. A., Goss, W. M., & Jeyakumar, S. 2014, ApJ, 793, 83 [NASA ADS] [CrossRef] [Google Scholar]
- Schirmer, T., Abergel, A., Verstraete, L., et al. 2020, A&A, 639, A144 [NASA ADS] [CrossRef] [EDP Sciences] [Google Scholar]
- Schmidt, M. 1959, ApJ, 129, 243 [NASA ADS] [CrossRef] [Google Scholar]
- Seo, Y. M., Goldsmith, P. F., Walker, C. K., et al. 2019, ApJ, 878, 120 [NASA ADS] [CrossRef] [Google Scholar]
- Sternberg, A., & Dalgarno, A. 1989, ApJ, 338, 197 [Google Scholar]
- Sternberg, A., Le Petit, F., Roueff, E., & Le Bourlot, J. 2014, ApJ, 790, 10 [CrossRef] [Google Scholar]
- Tacconi, L. J., Genzel, R., & Sternberg, A. 2020, ARA&A, 58, 157 [NASA ADS] [CrossRef] [Google Scholar]
- Tielens, A. G. G. M., & Hollenbach, D. 1985, ApJ, 291, 722 [Google Scholar]
- van der Tak, F. F. S., Black, J. H., Schöier, F. L., Jansen, D. J., & van Dishoeck, E. F. 2007, A&A, 468, 627 [NASA ADS] [CrossRef] [EDP Sciences] [Google Scholar]
- Vishniac, E. T. 1983, ApJ, 274, 152 [NASA ADS] [CrossRef] [Google Scholar]
- Walch, S. K., Whitworth, A. P., Bisbas, T., Wünsch, R., & Hubber, D. 2012, MNRAS, 427, 625 [NASA ADS] [CrossRef] [Google Scholar]
- Walker, K. M., Song, L., Yang, B. H., et al. 2015, ApJ, 811, 27 [NASA ADS] [CrossRef] [Google Scholar]
- Wilson, T. L., & Rood, R. 1994, ARA&A, 32, 191 [Google Scholar]
- Wolfire, M. G., Hollenbach, D., & McKee, C. F. 2010, ApJ, 716, 1191 [Google Scholar]
- Wolfire, M. G., Vallini, L., & Chevance, M. 2022, ARA&A, 60, 247 [NASA ADS] [CrossRef] [Google Scholar]
- Wu, R., Bron, E., Onaka, T., et al. 2018, A&A, 618, A53 [NASA ADS] [CrossRef] [EDP Sciences] [Google Scholar]
- Yang, B., Stancil, P. C., Balakrishnan, N., & Forrey, R. C. 2010, ApJ, 718, 1062 [Google Scholar]
To help the cleaning process, we initially included a cleaning mask defined in two different ways. First, a mask was created manually by selecting regions with line emission in each channel. Then, we tried the auto-masking procedure implemented in CASA. However, in both cases the weak line emission present in the H II region was filtered out.
The PDR is located at α(2000) = 05h40m53.936s; δ(2000) = −02º28′00″ and the dense core is located at α(2000) = 05h40m55.61s; δ(2000) = −02º27′38″.
All Tables
All Figures
|
Fig. 1 Multiphase view of the Horsehead nebula (Barnard 33). Left: composite color image of the Horsehead nebula and part of the H II region IC 434 observed with VLT (ESO). The size of the image is about 7′ × 7′, where 1′ is equal to 0.12 pc at the Horsehead distance. Right: zoom of the edge of the molecular cloud imaged with ALMA in the CO J = 3−2 line emission (blue). The hot ionized gas coming from the H II region is traced by the Hα line emission imaged with the 0.9m KPNO telescope (Pound et al. 2003), resolving scales of about 1″ (red). The field of view in this case is approximately 50″ × 50″ or, equivalently, 0.1 pc × 0.1 pc. The synthesized beam size of the ALMA observations is shown in the bottom left corner, as well as the corresponding physical scale. The dark region between the right edge of the CO emission and the bright rim of Hα is the neutral atomic layer. |
| In the text | |
|
Fig. 2 ALMA high angular resolution images of the Horsehead nebula. Top: integrated intensity map of the CO J = 3–2 line. Bottom: integrated intensity map of the HCO+ J = 4–3 line. The green contours represent the Hα line emission (Pound et al. 2003). The cyan contours show the DCO+ J = 2–1 line emission (Pety et al. 2007). The white contours represent the H2 2.12 µm rovibrational line emission (Habart et al. 2005) and the yellow contours represent the PAH 8 µm emission (Schirmer et al. 2020). The horizontal zero (red vertical line) delineates the PDR edge. The cyan and green crosses show the dense core (Pety et al. 2007) and PDR (Gerin et al. 2009) positions, respectively. Maps have been rotated 14° counterclockwise to bring the illuminating star direction in the horizontal direction. The angular resolution of ALMA observations is shown in the bottom left corner. |
| In the text | |
|
Fig. 3 Normalized integrated intensity profiles of the CO J = 3–2 (solid red curve) and HCO+ J = 4–3 (solid blue curve) lines along the direction of the exciting star at the PDR (left) and dense core positions (right), averaged over 1″ in the δy direction (see right panel in Fig. 4). The emission from other species such as DCO+ J = 2–1 (orange curve; Pety et al. 2007), Hα (black curve; Pound et al. 2003), H2 2.12 µm (green curve; Habart et al. 2005), and PAH 8 µm (purple curve; Schirmer et al. 2020) are also included. The spatial resolution of the observations is plotted in the top right corner. The dotted red and blue lines display the ±1σ significance levels for CO and HCO+, respectively, corresponding to the standard deviation of the average in the δy direction. |
| In the text | |
|
Fig. 4 Definition of the different transition zones. Left: zoom in version of the normalized integrated intensity profiles shown in the left panel of Fig. 3 at the vertical position of the PDR, but only including the HCO+ J = 4–3 (solid blue curve), the CO J = 3–2 (solid red curve), the Hα (solid black curve), and the H2 lines (solid green curve). The location of the ionization front, the dissociation front, and the C+/C/CO transition zone are shown by the black, green, and red vertical dashed lines, respectively. The dotted red and blue lines display the ±1σ significance levels for CO and HCO+, respectively, corresponding to the standard deviation of the average in the δy direction. Right: CO J = 3–2 integrated intensity map, showing the horizontal cut used to extract the intensity profiles at the vertical position of the PDR. The yellow rectangle shows the area where the emission of the different tracers was averaged, but in the zoom in version shown in the left panel this area was restricted between δx = −3″ to 15″ for the purpose of defining the transition zones. The two crosses, the red vertical line, and the different contours are the same as in Fig. 2. The angular resolution is plotted in the bottom left corner. |
| In the text | |
|
Fig. 5 Location of the ionization, dissociation, and C+/C/CO transition zones. Left: distances of the dissociation front (H/H2, green dots) and C+/C/CO transition zone (C/CO, red dots) with respect to the ionization front (IF) for different δy vertical positions. The distributions of the distances are shown in the top panel, where the solid vertical lines represent the median values, and the dashed lines represent the uncertainties based on the 16th and 84th percentiles of each distribution. Right: IF (yellow), H/H2 (green), and C/CO (red) transition zones overlaid on top of the CO J = 3–2 integrated intensity map. The two crosses mark the PDR and dense core positions. The angular resolution is plotted in the bottom left corner. |
| In the text | |
|
Fig. 6 Non-LTE radiative transfer models for different gas physical conditions at the PDR. Left: expected CO J = 3−2 peak brightness temperature as a function of the gas temperature for N(CO) = (1.0−5.0) × 1017 cm−2 and different gas densities (colored lines). Right: expected HCO+ J = 4−3 integrated line intensity as a function of the gas density for N(HCO+) = (0.8−1.2) × 1013 cm−2 and different gas temperatures (colored lines). The solid lines display the model predictions for N(CO) = 3 × 1017 cm−2 and N(HCO+) = 1 × 1013 cm−2, and the colored areas represent the possible range of values for the assumed range of column densities. In both panels, the gray shaded areas represent the observations at the PDR position, with a ±1σ uncertainty. |
| In the text | |
|
Fig. 7 CO J = 3−2 peak brightness temperature. Left: |
| In the text | |
|
Fig. 8 Range of parameters compatible with the distances measured in the observations. Top: distance between the ionization front (IF) and the H/H2 transition (dissociation front). The blue zone represents the upper limit that has been derived for the distance between the IF and the dissociation front. The blue dashed lines indicates the distance found by the Meudon PDR code for two radiation fields (G0 = 50 and 186) and different thermal pressures (Pth). The models compatible with the observations are those in the blue zone. Bottom: same but for the distance between the IF and C/CO transition. The domain of parameters that reproduce the distances is represented by the black dashed squares. |
| In the text | |
|
Fig. A.1 Slices of the full ALMA data cubes, showing the CO J = 3−2 (top) and HCO+ J = 4−3 (bottom) line emission at different velocities, ranging from 9.62 km s−1 to 11.60 km s−1 with a spectral resolution of 0.22 km s−1. Data cubes were rotated 14° counterclockwise to bring the illuminating star direction in the horizontal direction. The synthesized beam size and the kinematic local standard of rest (LSRK) velocities are shown in the bottom left and right corner of each panel, respectively. |
| In the text | |
Current usage metrics show cumulative count of Article Views (full-text article views including HTML views, PDF and ePub downloads, according to the available data) and Abstracts Views on Vision4Press platform.
Data correspond to usage on the plateform after 2015. The current usage metrics is available 48-96 hours after online publication and is updated daily on week days.
Initial download of the metrics may take a while.