Fig. 7
Download original image
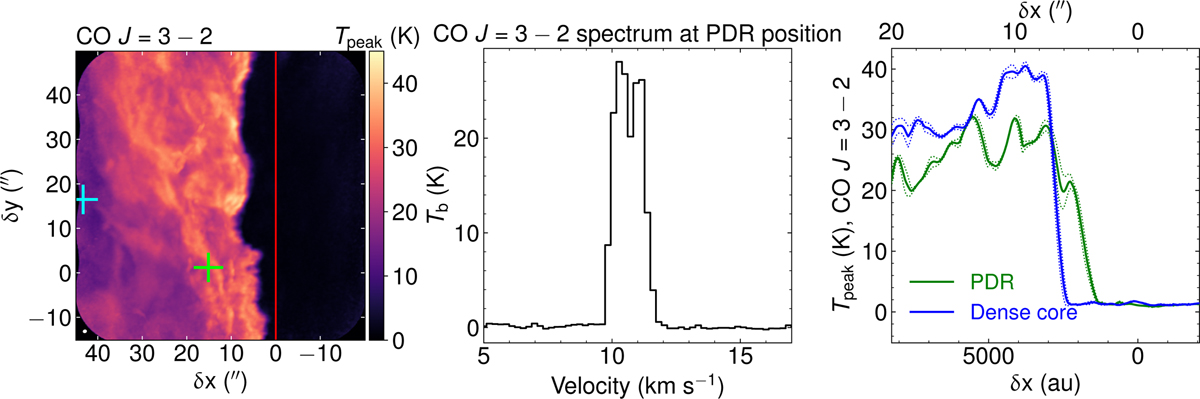
CO J = 3−2 peak brightness temperature. Left: ![]() map rotated 14° counterclockwise to bring the illuminating star direction in the horizontal direction. The two crosses and the red vertical line are the same as in Fig. 2, and the angular resolution is plotted in the bottom left corner. Middle: spectrum of the CO J = 3−2 line at the PDR position. Right:
map rotated 14° counterclockwise to bring the illuminating star direction in the horizontal direction. The two crosses and the red vertical line are the same as in Fig. 2, and the angular resolution is plotted in the bottom left corner. Middle: spectrum of the CO J = 3−2 line at the PDR position. Right: ![]() profiles at the vertical position of the PDR (solid green curve) and dense core (solid blue curve), averaged over 1″ in the δy direction. The dotted green and blue lines display the ±1σ significance levels, corresponding to the standard deviation of the average in the δy direction.
profiles at the vertical position of the PDR (solid green curve) and dense core (solid blue curve), averaged over 1″ in the δy direction. The dotted green and blue lines display the ±1σ significance levels, corresponding to the standard deviation of the average in the δy direction.
Current usage metrics show cumulative count of Article Views (full-text article views including HTML views, PDF and ePub downloads, according to the available data) and Abstracts Views on Vision4Press platform.
Data correspond to usage on the plateform after 2015. The current usage metrics is available 48-96 hours after online publication and is updated daily on week days.
Initial download of the metrics may take a while.