Fig. 2
Download original image
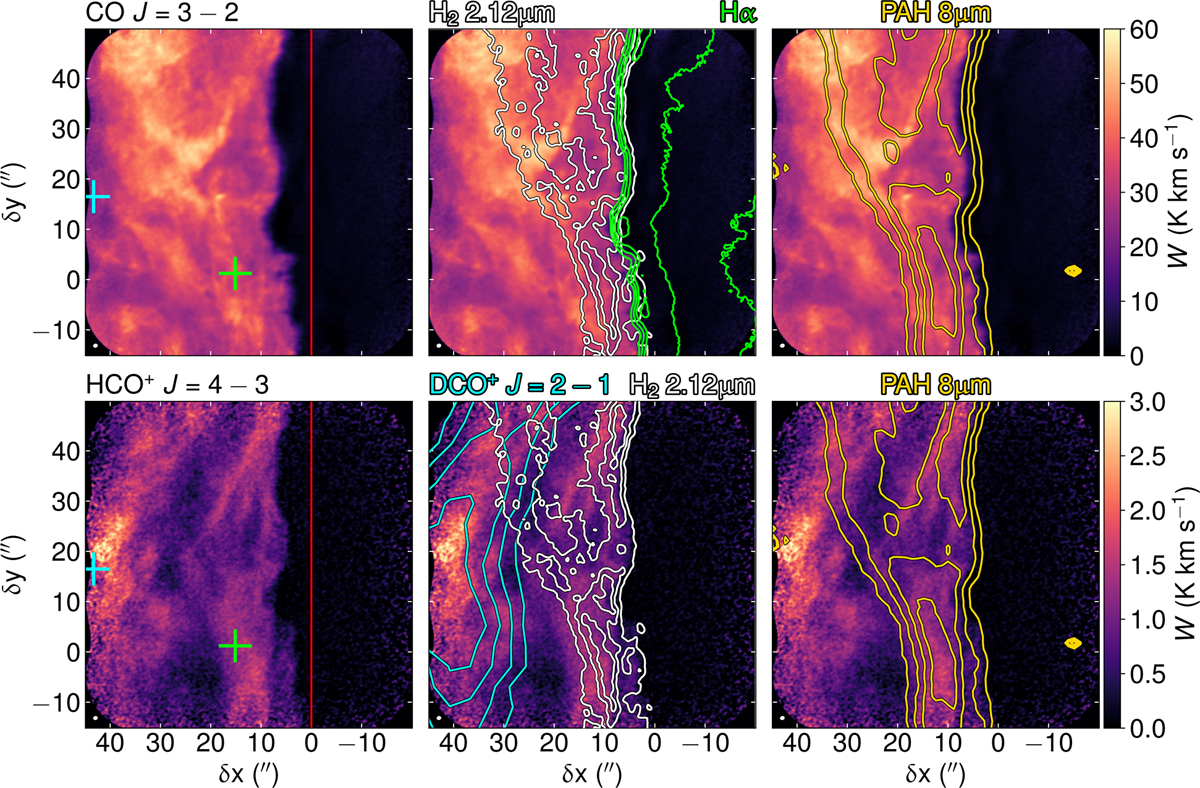
ALMA high angular resolution images of the Horsehead nebula. Top: integrated intensity map of the CO J = 3–2 line. Bottom: integrated intensity map of the HCO+ J = 4–3 line. The green contours represent the Hα line emission (Pound et al. 2003). The cyan contours show the DCO+ J = 2–1 line emission (Pety et al. 2007). The white contours represent the H2 2.12 µm rovibrational line emission (Habart et al. 2005) and the yellow contours represent the PAH 8 µm emission (Schirmer et al. 2020). The horizontal zero (red vertical line) delineates the PDR edge. The cyan and green crosses show the dense core (Pety et al. 2007) and PDR (Gerin et al. 2009) positions, respectively. Maps have been rotated 14° counterclockwise to bring the illuminating star direction in the horizontal direction. The angular resolution of ALMA observations is shown in the bottom left corner.
Current usage metrics show cumulative count of Article Views (full-text article views including HTML views, PDF and ePub downloads, according to the available data) and Abstracts Views on Vision4Press platform.
Data correspond to usage on the plateform after 2015. The current usage metrics is available 48-96 hours after online publication and is updated daily on week days.
Initial download of the metrics may take a while.