Fig. 4
Download original image
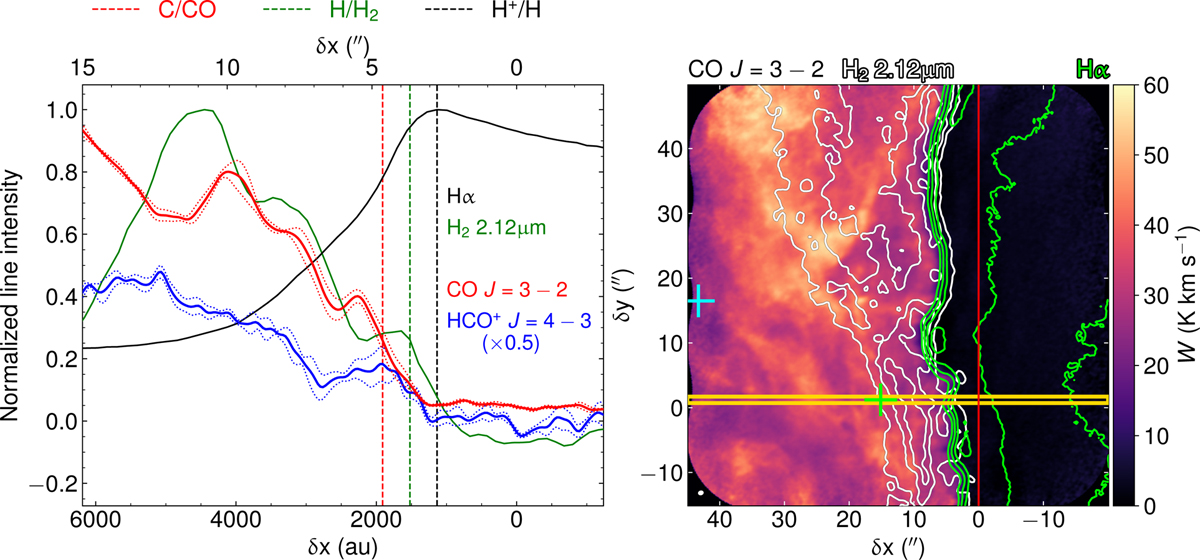
Definition of the different transition zones. Left: zoom in version of the normalized integrated intensity profiles shown in the left panel of Fig. 3 at the vertical position of the PDR, but only including the HCO+ J = 4–3 (solid blue curve), the CO J = 3–2 (solid red curve), the Hα (solid black curve), and the H2 lines (solid green curve). The location of the ionization front, the dissociation front, and the C+/C/CO transition zone are shown by the black, green, and red vertical dashed lines, respectively. The dotted red and blue lines display the ±1σ significance levels for CO and HCO+, respectively, corresponding to the standard deviation of the average in the δy direction. Right: CO J = 3–2 integrated intensity map, showing the horizontal cut used to extract the intensity profiles at the vertical position of the PDR. The yellow rectangle shows the area where the emission of the different tracers was averaged, but in the zoom in version shown in the left panel this area was restricted between δx = −3″ to 15″ for the purpose of defining the transition zones. The two crosses, the red vertical line, and the different contours are the same as in Fig. 2. The angular resolution is plotted in the bottom left corner.
Current usage metrics show cumulative count of Article Views (full-text article views including HTML views, PDF and ePub downloads, according to the available data) and Abstracts Views on Vision4Press platform.
Data correspond to usage on the plateform after 2015. The current usage metrics is available 48-96 hours after online publication and is updated daily on week days.
Initial download of the metrics may take a while.