Fig. 5
Download original image
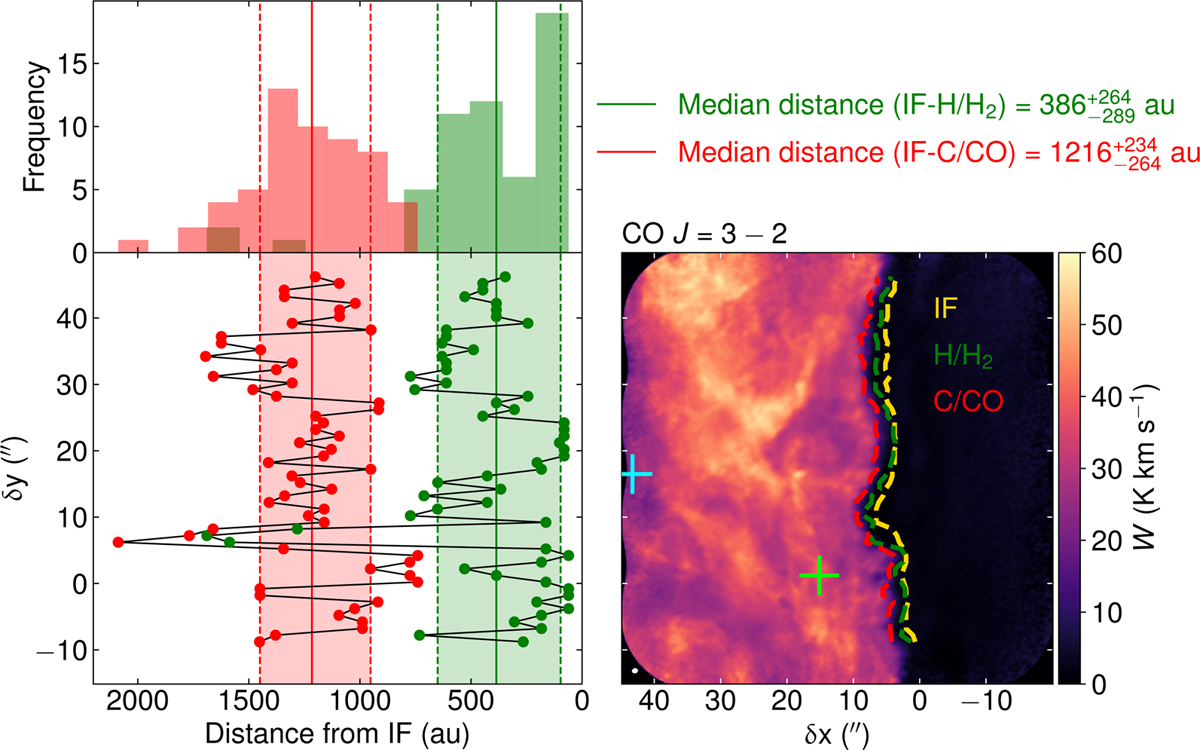
Location of the ionization, dissociation, and C+/C/CO transition zones. Left: distances of the dissociation front (H/H2, green dots) and C+/C/CO transition zone (C/CO, red dots) with respect to the ionization front (IF) for different δy vertical positions. The distributions of the distances are shown in the top panel, where the solid vertical lines represent the median values, and the dashed lines represent the uncertainties based on the 16th and 84th percentiles of each distribution. Right: IF (yellow), H/H2 (green), and C/CO (red) transition zones overlaid on top of the CO J = 3–2 integrated intensity map. The two crosses mark the PDR and dense core positions. The angular resolution is plotted in the bottom left corner.
Current usage metrics show cumulative count of Article Views (full-text article views including HTML views, PDF and ePub downloads, according to the available data) and Abstracts Views on Vision4Press platform.
Data correspond to usage on the plateform after 2015. The current usage metrics is available 48-96 hours after online publication and is updated daily on week days.
Initial download of the metrics may take a while.