Fig. 6
Download original image
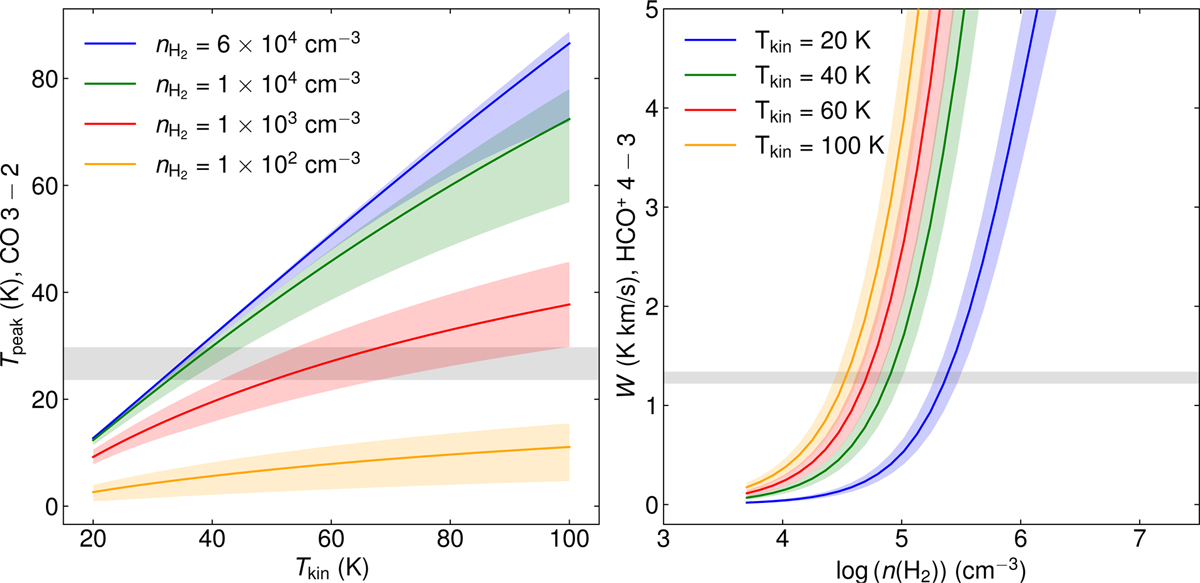
Non-LTE radiative transfer models for different gas physical conditions at the PDR. Left: expected CO J = 3−2 peak brightness temperature as a function of the gas temperature for N(CO) = (1.0−5.0) × 1017 cm−2 and different gas densities (colored lines). Right: expected HCO+ J = 4−3 integrated line intensity as a function of the gas density for N(HCO+) = (0.8−1.2) × 1013 cm−2 and different gas temperatures (colored lines). The solid lines display the model predictions for N(CO) = 3 × 1017 cm−2 and N(HCO+) = 1 × 1013 cm−2, and the colored areas represent the possible range of values for the assumed range of column densities. In both panels, the gray shaded areas represent the observations at the PDR position, with a ±1σ uncertainty.
Current usage metrics show cumulative count of Article Views (full-text article views including HTML views, PDF and ePub downloads, according to the available data) and Abstracts Views on Vision4Press platform.
Data correspond to usage on the plateform after 2015. The current usage metrics is available 48-96 hours after online publication and is updated daily on week days.
Initial download of the metrics may take a while.