Fig. 3
Download original image
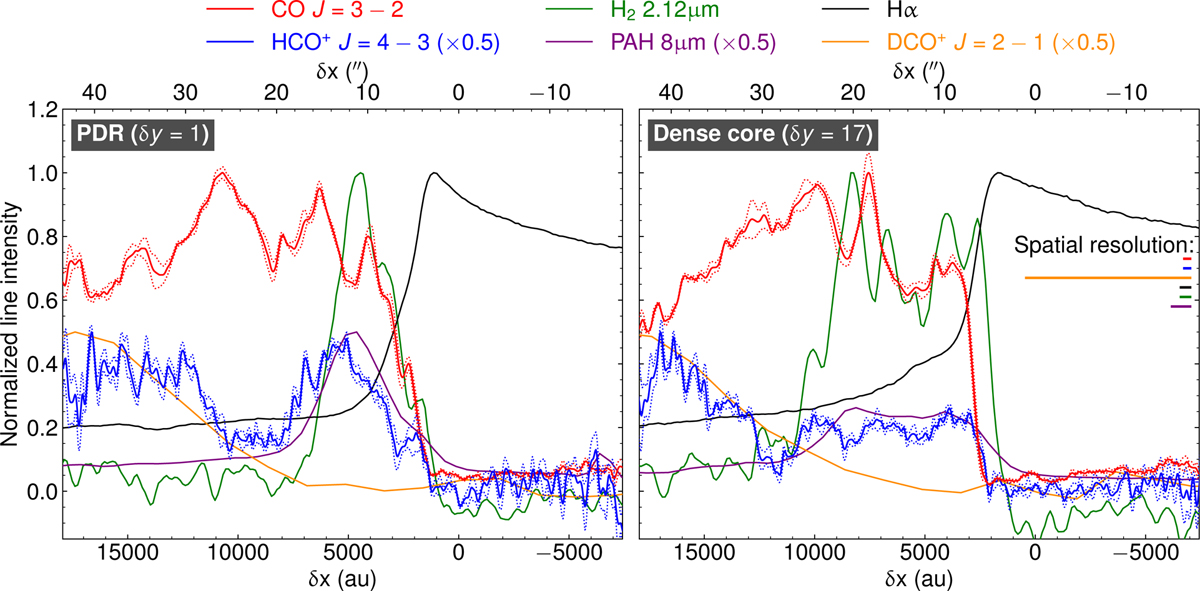
Normalized integrated intensity profiles of the CO J = 3–2 (solid red curve) and HCO+ J = 4–3 (solid blue curve) lines along the direction of the exciting star at the PDR (left) and dense core positions (right), averaged over 1″ in the δy direction (see right panel in Fig. 4). The emission from other species such as DCO+ J = 2–1 (orange curve; Pety et al. 2007), Hα (black curve; Pound et al. 2003), H2 2.12 µm (green curve; Habart et al. 2005), and PAH 8 µm (purple curve; Schirmer et al. 2020) are also included. The spatial resolution of the observations is plotted in the top right corner. The dotted red and blue lines display the ±1σ significance levels for CO and HCO+, respectively, corresponding to the standard deviation of the average in the δy direction.
Current usage metrics show cumulative count of Article Views (full-text article views including HTML views, PDF and ePub downloads, according to the available data) and Abstracts Views on Vision4Press platform.
Data correspond to usage on the plateform after 2015. The current usage metrics is available 48-96 hours after online publication and is updated daily on week days.
Initial download of the metrics may take a while.