| Issue |
A&A
Volume 677, September 2023
|
|
|---|---|---|
| Article Number | A18 | |
| Number of page(s) | 18 | |
| Section | Interstellar and circumstellar matter | |
| DOI | https://doi.org/10.1051/0004-6361/202346053 | |
| Published online | 28 August 2023 | |
The edge-on protoplanetary disk HH 48 NE
II. Modeling ices and silicates
1
Leiden Observatory, Leiden University,
PO Box 9513,
2300 RA
Leiden, The Netherlands
e-mail: This email address is being protected from spambots. You need JavaScript enabled to view it.
2
Department of Chemistry, University of California,
Berkeley, CA
94720-1460, USA
3
Institute of Astronomy, Department of Physics, National Tsing Hua University,
Hsinchu, Taiwan
4
Institut des Sciences Moléculaires d’Orsay, CNRS, Univ. Paris-Saclay,
91405
Orsay, France
5
Center for Space and Habitability, Universität Bern,
Gesellschaftsstrasse 6,
3012,
Bern, Switzerland
6
Center for Interstellar Catalysis, Department of Physics and Astronomy, Aarhus University,
Ny Munkegade 120,
Aarhus C
8000, Denmark
7
Center for Astrophysics | Harvard & Smithsonian,
60 Garden St.,
Cambridge, MA
02138, USA
8
INAF–Osservatorio Astrofisico di Catania,
via Santa Sofia 78,
95123
Catania, Italy
9
Department of Physics, University of Central Florida,
Orlando, FL
32816, USA
10
Laboratory for Astrophysics, Leiden Observatory, Leiden University,
PO Box 9513,
2300 RA
Leiden, The Netherlands
11
TMT International Observatory,
100 W Walnut St, Suite 300,
Pasadena, CA USA
12
National Astronomical Observatory of Japan, National Institutes of Natural Sciences (NINS),
2-21-1 Osawa, Mitaka,
Tokyo
181-8588, Japan
Received:
1
February
2023
Accepted:
29
April
2023
Abstract
Context. The abundance and distribution of ice in protoplanetary disks is critical for an understanding of the link between the composition of circumstellar matter and the composition of exoplanets. Edge-on protoplanetary disks are a useful tool for constraining this ice composition and its location in the disk because the spectral signatures of the ice can be observed in absorption against the continuum emission that arises from the warmer regions in the central disk.
Aims. The aim of this work is to model ice absorption features in protoplanetary disks and to determine how well the abundance of the main ice species throughout the disk can be determined within the uncertainty of the physical parameter space. The edge-on proto-planetary disk around HH 48 NE, a target of the James Webb Space Telescope Early Release program Ice Age, is used as a reference system.
Methods. We used the full anisotropic scattering capabilities of the radiative transfer code RADMC-3D to ray-trace the mid-infrared continuum. Using a constant parameterized ice abundance, we added ice opacities to the dust opacity in regions in which the disk was cold enough for the main carbon, oxygen, and nitrogen carriers to freeze out.
Results. The global abundance relative to the dust content of the main ice carriers in HH 48 NE can be determined within a factor of 3 when the uncertainty of the physical parameters is taken into account. Ice features in protoplanetary disks can be saturated at an optical depth of ≲1 due to local saturation. Ices are observed at various heights in the disk model, but in this model, spatial information is lost for features at wavelengths >7 µm when observing with James Webb Space Telescope because the angular resolution decreases towards longer wavelengths. Spatially observed ice optical depths cannot be directly related to column densities, as would be the case for direct absorption against a bright continuum source, because of radiative transfer effects. Vertical snowlines will not be a clear transition because the height of the snow surface increases radially, but their location may be constrained from observations using radiative transfer modeling. Radial snowlines are not really accessible. Not only the ice abundance, but also the inclination, the settling, the grain size distribution, and the disk mass have a strong impact on the observed ice absorption features in disks. Relative changes in the ice abundance can only be inferred from observations if the source structure is well constrained.
Key words: protoplanetary disks / radiative transfer / scattering / planets and satellites: formation / astrochemistry
© The Authors 2023
 Open Access article, published by EDP Sciences, under the terms of the Creative Commons Attribution License (https://creativecommons.org/licenses/by/4.0), which permits unrestricted use, distribution, and reproduction in any medium, provided the original work is properly cited.
This article is published in open access under the Subscribe to Open model. This email address is being protected from spambots. You need JavaScript enabled to view it. to support open access publication.
1 Introduction
Ices constitute the bulk reservoir of volatiles such as C, N, and O in cold protoplanetary disks (Pontoppidan et al. 2014) and are thought to be the carriers and precursors of astrophysically complex organic molecules (Boogert et al. 2015). Ices on dust grains and the macromolecular residues formed from their processing in space environments are often recognized as important carriers of organic compounds of astrobiological relevance (e.g., Baratta et al. 2019; Johansen et al. 2021; Sossi et al. 2022). It is crucial to investigate the processing of small molecules, such as CO and CO2, and the origin of the diversity of complex organics in planet-forming regions in protoplanetary disks to understand the origin of the chemical complexity in planets.
Previously, the thermal snow surfaces of the molecules CO, CS, and H2O have been traced directly in protoplanetary disks using observations of their gas emission lines (Qi et al. 2013; Pinte et al. 2018; van’t Hoff et al. 2020; Podio et al. 2020).
Ices have also been traced indirectly in studies focusing on radial transport of volatiles that are frozen out on large dust grains in the disk midplane (Zhang et al. 2020; Sturm et al. 2022) and through their physical imprint on the grain properties (Banzatti et al. 2015; Cieza et al. 2016). H2O ice is observed directly toward multiple class II disks (e.g., Terada et al. 2007; Aikawa et al. 2012; Terada & Tokunaga 2012, 2017; McClure et al. 2015) using ground-based observations of the Infrared Camera and Spectrograph (IRCS) on the Subaru telescope and the AKARI and Herschel Space Telescopes. However, until the advent of the recently launched James Webb Space Telescope (JWST), direct observations of ices other than H2O in disks were hardly possible because Earth’s atmosphere efficiently absorbs radiation at these wavelengths, and previous space-based instruments lacked enough sensitivity and spatial resolution. CO2, and tentatively CO, ice features have been detected previously in a handful of edge-on class II disks with the AKARI space telescope (Aikawa et al. 2012). Other ices have been observed toward multiple young class 0/I protostars with edge-on disks (e.g., Pontoppidan et al. 2005 and Aikawa et al. 2012), but it is hard to determine the fraction of ices the disk in these systems that contributes to the absorption bands because the ice absorption can be dominated by the envelope and foreground cloud.
Observations with the JWST Near Infrared Spectrograph (NIRSpec, 0.6–5.3 µm; Jakobsen et al. 2022) and Mid-InfraRed Instrument (MIRI, 4.9–28.1 µm; Rieke et al. 2015) of the later-stage edge-on disks (>2 Myr), where the envelope has long dissipated, will shed light on the composition of ices in proto-planetary disks and on their spatial distribution in the disk. The space-based JWST is sensitive enough to observe many more ice species in protoplanetary disks and has the resolving capability to spatially constrain absorption strengths throughout the disk. However, detailed modeling of these edge-on disks is necessary to interpret what the observations reveal about the physical and chemical structure of these disks. Ices in edge-on protoplanetary disks are revealed in absorption against the continuum of the inner disk and/or the scattered light. Stellar photons and photons emitted from warm dust in the (<5 au) inner regions of the disk are both emitted or scattered off small dust grains on the surface of the outer disk, and they are absorbed at specific wavelengths by ices located in the cold regions in the disk (see Appendix A for a detailed breakdown of the observed continuum emission). For a sketch of the basic principles, we refer to Fig. 3 in Terada et al. (2007).
Ballering et al. (2021) used advanced chemical modeling to show that the main ice species could likely be detected with JWST. Their work focused on the observability of chemical differences with the current generation of observatories and reported that the strength of the absorption features might reveal whether the ices are inherited from the protostellar phase or are formed after a molecular reset upon entering the disk. Arabhavi et al. (2022) implemented ice opacities in the protoplanetary disk model (ProDiMo) and studied the impact of the chemistry and ice distribution on the dust grains on the spectral ice features in the JWST wavelength range. Dartois et al. (2022) modeled the influence of grain growth on the spectroscopic profiles of the ice features in dense clouds and disk observations. In this work, we extend the modeling analysis of ices in protoplanetary disks and focus on how the physical disk parameters affect the JWST spectra in edge-on protoplanetary disks. We also quantify how robustly we can constrain ice abundances.
While we apply our modeling to one specific disk, HH 48 NE, this work can readily be generalized to all edge-on disks. HH 48 NE is part of the JWST early-release science program Ice Age (proposal ID: 1309, PI: McClure), which studies the evolution of ices during star formation from dark clouds (McClure et al. 2023) until protoplanetary disks. The disk geometry and stellar parameters are explored in Paper I of this paper series (Sturm et al. 2023). HH 48 NE is a nearly edge-on disk that was first observed with Hubble Space Telescope (HST; Stapelfeldt et al. 2014) and subsequently with Atacama Large (sub-)Millimeter Array (ALMA; Villenave et al. 2020). In Paper I, we showed that the spectrum is consistent with a stellar spectral type K7, and a luminosity of 0.4 L⊙. The 200 au scattered light disk is inclined at 82.3° and likely has a 55 au cavity in which dust is depleted by two orders of magnitude.
In this work, we use a simple parameterized abundance structure for the main ice species H2O, CO, CO2, NH3, CH4, and CH3OH to reveal the physical parameters of the disk that are required to assess the ice abundances and chemistry, and how accurately we can constrain the chemistry in HH 48 NE given the uncertainty in the disk geometry. The structure of this paper is as follows: we first describe our model setup in Sect. 2. In Sect. 3, we present the ice spectrum in the fiducial model and the sensitivity of the ice features to various parameters. In Sect. 4, we discuss the implications of these results in the analysis of HH 48 NE and edge-on disks in general. Section 5 summarizes the results and gives our final conclusions.
2 Modeling
2.1 Continuum model
Our modeling is based on the full anisotropic scattering radiative transfer capabilities of RADMC-3D (Dullemond et al. 2012). In the first stage, the temperature is determined, after which we distribute the ices in cold disk regions and ray-trace the model to simulate observations. The specific steps of our modeling procedure are described in the following sections. All parameters are adopted from the best-fitting model in Paper I, which reproduces the spectral energy distribution well. They are listed in Table 1.
2.1.1 Model setup
The model setup we used is fully parameterized, assuming an azimuthally symmetric disk with a power-law density structure and an exponential outer taper (Lynden-Bell & Pringle 1974),
![Mathematical equation: $\sum\nolimits_{{\rm{dust}}} { = {{\sum\nolimits_{\rm{c}} {} } \over }{{\left( {{r \over {{R_{\rm{c}}}}}} \right)}^{ - \gamma }}\exp \,\left[ { - {{\left( {{r \over {{R_{\rm{c}}}}}} \right)}^{2 - \gamma }}} \right]} ,$](/articles/aa/full_html/2023/09/aa46053-23/aa46053-23-eq1.png) (1)
(1)
where r is the radial distance to the star in the plane of the disk in au, Σc is the surface density at the characteristic radius Rc in g cm−2, γ is the power-law index, and e is the gas-to-dust ratio.
The height of the disk is described by
 (2)
(2)
where h is the aspect ratio, hc is the aspect ratio at the characteristic radius, and ψ is the flaring index. The dust has a vertical Gaussian distribution,
![Mathematical equation: ${\rho _{\rm{d}}} = {{\sum\nolimits_{{\rm{dust}}} {} } \over {\sqrt {2\pi } rh}}\exp \,\left[ { - {1 \over 2}{{\left( {{{{\pi \mathord{\left/ {\vphantom {\pi {2 - \theta }}} \right. \kern-\nulldelimiterspace} {2 - \theta }}} \over h}} \right)}^2}} \right],$](/articles/aa/full_html/2023/09/aa46053-23/aa46053-23-eq3.png) (3)
(3)
where θ is the opening angle from the midplane as seen from the central star. The dust sublimation radius is determined using  , assuming a dust sublimation temperature of 1600 K, which corresponds to 0.045 au.
Dust settling is parameterized by introducing a second dust population containing large grains that is limited in height to Xh, where X is a constant between 0 and 1. The mass fraction of the total dust mass that resides in the large grain population is defined as fℓ. We assumed a grain composition consistent with inter stellar matter (ISM) dust, consisting of a mass fraction of 85% amorphous pyroxene Mg0.8Fe0.2SiO3, 15% amorphous carbon, and a porosity of 25%. The two dust populations follow a power-law size distribution with a fixed slope of -3.5 (see, e.g., Weingartner & Draine 2001 and Andrews et al. 2011 for an observational justification of these parameters). The grain size limits of the small dust population are amin = 0.4 µm and amax = 7 µm, as determined with Markov chain Monte Carlo (MCMC) fits using the spectral energy distribution (SED) and the resolved HST and ALMA observations in Paper I. The minimum grain size of the large dust population is the same as the minimum size of the small dust population. The maximum grain size of the large dust population is adopted to be 1 mm. Dust and ice opacities were calculated with OpTool (Dominik et al. 2021), using the distribution of hollow spheres (DHS; Min et al. 2005) approach to account for grain shape effects. The phase function was truncated at 3°, which means that forward scattering within this range was treated as if the photon package did not have any interaction with the grain at all.
2.1.2 Dust scattering
We used the full anisotropic scattering capabilities of RADMC-3D because isotropic scattering assumptions can have a significant impact on the amount of observed scattered light in the near- to mid-infrared (Pontoppidan et al. 2007). Additionally, the direction from which the scattered light originates is important for modeling the ices in the disk. The spectral range in which most ice absorption features occur is dominated by scattered light that is emitted in the warm inner region of the disk and scattered off in the outer disk (see Fig. A.1). As the ices are localized in the lower layers in the disk, directional dependence is critically important for the amount of light that is absorbed by the ices.
2.2 Ice distribution
To evaluate the ices in the model, we assumed a constant molecular abundance throughout the disk to separate the effect on the ice features of physical disk parameters from chemistry. The molecular abundances were adopted from the initial abundances in the inheritance model in Ballering et al. (2021) based on dark cloud ice surveys (Öberg et al. 2011; Boogert et al. 2015) to facilitate the comparison between their approach and ours. All molecules were assumed to be frozen out when the dust temperature was below the desorption temperature of that particular species (see Table 2 for details). The ice was limited vertically by a visual extinction (Av) limit from the star, supported by both dark cloud observations (Boogert et al. 2015) and protoplanetary disk models (Visser et al. 2018; Arabhavi et al. 2022). This limit was set to Av = 1.5 mag in the fiducial model based on the lower limit at which ices are observed in dark clouds toward background stars (Boogert et al. 2015). We did not include a background radiation field because no early spectral type stars lie in the vicinity of HH 48. For sources with a strong background radiation field, the ice can be photo-desorbed in a significant area of the disk because this radiation will encounter the cold translucent parts of the disk first. Future JWST observations of ices in a larger sample of protoplanetary disks will shed more light on the effect of the external radiation field on ices in disks.
To ray-trace the ice features and to time and efficiently compute in RADMC-3D, we divided the disk into seven regions, one for each considered ice species. To do this, we added ices toward cooler regions in the disk based on their respective absorption temperature (see Table 2 and Fig. 1). The average density of the dust and ice composite was then calculated in every region using
 (4)
(4)
where x is the abundance, and M the mean molecular weight. The gas predominantly consists of H2 and He and has an abundance of xgas = 0.64 and a mean molecular weight of 2.44.
The ice is distributed throughout the small and large grain population according to their surface area, following the description in Ballering et al. (2021),
 (5)
(5)
where amax,s is the maximum grain size of the small dust population, amax,ℓ is the maximum grain size of the large dust population, and fdust,ℓ is the mass fraction of grains in the large dust population. In each of the two dust populations, the ice is distributed throughout the grains assuming a constant core-mantle mass ratio. This approach is consistent with dust grains that are a coagulation of small dust grains covered in ice and for preferred freezeout on large grains due to a lower surface energy barrier (Powell et al. 2022). We would like to note that the choice of ice partitioning for large grains does not significantly influence the results because most ice absorption occurs in the optically thin upper regions of the disk where the large dust population is excluded by settling. A distribution throughout the grains assuming a constant mantle thickness in the small dust population would have a significant effect, as was shown recently by Arabhavi et al. (2022).
Table 2 lists the laboratory-measured ice optical constants we used for the opacity calculation, which are available through OpTool. We mixed the optical constants together in each of the regions using the Bruggeman rule (Bruggeman 1935), assuming homogeneous mixing of the ice components in an icy mantle on top of the dust core. We assumed only pure ice components, measured at a singular temperature (see Table 2 for the references), and thus did not take into account how the precise shape of the feature and peak position vary with temperature and the ice matrix. A more detailed analysis on the shape of the absorption features and the dependence on the chemical environment in protoplanetary disks will be given in a forthcoming paper.
We used a well-sampled grid of 200 × 100 × 25 cells in radial, vertical, and azimuthal directions and used 108 photons (τpeak ~0.1) to determine the temperature structure in the model. After deposition of the ices, we repeated the temperature calculation to ensure that adding the reflective layer to the opacities did not change the internal temperature in the model. In theory, multiple iterations might be made over the ice deposition and temperature calculations to ensure that the regions in which the ice are distributed are determined accurately. However, to limit the computing time, we ignored the small deviations in deposition area. The temperature differences between different iterations are small and converge rapidly (Arabhavi et al. 2022).
In Fig. 2, we present the opacities in the seven different regions for the small and large grain population. In addition to molecular ice bands that arise over relatively narrow wavelength ranges, the ice addition slightly modifies the overall shape of the continuum. The total opacity of the small grains dominates that of the large grains at shorter wavelengths, while the large grains dominate at longer wavelengths.
The model is ray-traced at 309 wavelengths that were selected to resolve the mid-infrared ice features. For the ray-tracing, we used 107 photon packages per frame, with image dimensions of 300 pixels in size and a pixel size of 2 au. The 2D images were then convolved with an oversampled instrumental point spread function (PSF) for NIRSpec (<5 µm) or MIRI (>5 µm) using the Python package WebbPSF (Perrin et al. 2012) to create mock observations that can directly be compared with the observed data.
Adopted ice properties.
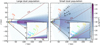 |
Fig. 1 Dust density setup in the model of the large dust population (left) and small dust population (right). The colored contours follow the dust temperature at which the considered molecules freeze out according to their desorption temperature given in Table 2. The dotted black lines denote a visual extinction (Av) of 0.1, 1, and 10 mag as measured from the stellar position. The onset of ice formation is set to Av < 1.5 mag in the fiducial model. |
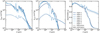 |
Fig. 2 Opacities used for the seven different regions in the disk. Left: absorption opacity. Center: effective scattering opacity. Right: asymmetry parameter g. The regions are numbered with decreasing desorption temperature, as further specified in Table 2. |
3 Results
We discuss the results of the ice modeling. We first discuss the specifics of the different ice species in the fiducial model. After this, we present various grids, for which we change one physical parameter at a time to determine the sensitivity of the optical depth of the ice features to the physical parameters and to which extent we can spatially constrain ice abundances in the disk.
3.1 Fiducial model
In Fig. 3, we present the mid-infrared spectrum of the fiducial model and compare it to the observations in the four Spitzer IRAC bands and to the dust-only model. Adding ices to the model has a minor effect on the continuum with respect to the dust-only model because of the addition of the ice scattering opacities (see also Fig. 2). The modeled spectrum is a good fit overall to the photometric data points in the considered spectral range.
3.1.1 Integrated optical depths
We fit a local continuum around the main ice absorption features using several wavelength points just outside the (known ab initio) absorption features and a second-order polynomial fit (see Fig. 3), and converted the spectrum into a logarithmic ice optical depth using
 (6)
(6)
The prominent H2O ice feature at 3 µm has a peak optical depth of 0.6 in the integrated spectrum (see Fig. 3). The feature has a minor contribution from CH4, CH3OH, and NH3 in the model compared to the H2O O-H stretching mode. The CO2 features at 4.26 and 15.2 µm are also present in the spectrum, with a similar strength as the 3 µm H2O ice feature. The feature at 15.2 µm is double peaked, as expected for a pure CO2 ice (Warren 1986). The addition of a component of CO2 in polar mixtures will change the shape of this feature drastically, but this will be discussed in a forthcoming paper. The CO feature at 4.7 µm has a peak optical depth of 0.07. Additional ice features in the spectrum are the CH4 feature at 7.7 µm and the CH3OH feature at 9.4 µm. The strength of these features is comparable to that of the CO feature. The spectrum is dominated by photons that encountered multiple scattering events (compared with the gray line in Fig. 3). The ice features in the scattering-dominated part of the spectrum (<10 µm) are substantially weaker when single scattering alone is considered because singly scattered photons will be scattered from a warm layer high up in the disk.
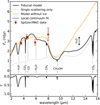 |
Fig. 3 Integrated spectrum of the fiducial model, with photometric data points (red circles) and the best-fitting dust-only model (orange line) for reference. The local continuum used to calculate the optical depths of the sharp ice features is shown in blue. The fiducial model excluding double scattering is shown in gray. The lower panel shows the optical depth of the analyzed ice features in the fiducial spectrum. |
3.1.2 Spatially resolved optical depths
We determined the optical depth of the ice features as a function of disk radius and height at a similar pixel scale as that of the NIRSpec and MIRI instruments (Fig. 4). We convolved the simulated observations with a NIRSpec or MIRI PSF, depending on the wavelength, and compared it to the original model (second and fourth column). After convolving with an instrumental PSF, the vertical changes are smoothed out over a larger area, lowering the peak optical depths up to a factor of two. The smallest resolvable scale at 4 µm (see Fig. 4) is ~20 au, while the resolvable scale at 15 µm is ~90 au. This means that at the MIRI longer wavelengths the disk will not be resolved into a lower and upper lobe.
Figure 4 illustrates that the H2O ice feature at 3 µm is expected to be present throughout the disk. The optical depth of the H2O ice feature clearly varies with the height in the disk, ranging from an optical depth of 1 at the midplane to 0.3 in the upper layers in the disk. The dark lane is offset from the midplane because of the 82.3° inclination, so that the strongest absorption features are found slightly below the central disk midplane. In the dark lane, where the dust column density is highest and temperatures are low, we trace a higher column density of ice. The optical depth of the water ice features is therefore higher there than in the disk atmosphere.
Radial variations in peak optical depth are small in the model. Even though the continuum changes over two orders of magnitude, the ice column density decreases rapidly with radius and the optical depth is not saturated. This is in contrast to dark cloud ice observations, where in general the ice column density is probed directly, and it illustrates the importance of radiative transfer for understanding edge-on disk ice absorption. The small radial variations in optical depth show that most absorption occurs in the outer disk regions that are similarly crossed by light from all lines of sight.
The CO2 ice features at 4.3 µm and 15.1 µm are predicted to absorb in similar regions of the disk as the water ice (Fig. 4). For the ice features at wavelengths >7 µm, it will be impossible to see vertical changes because of the extent of the instrumental PSF. CO is only available near the disk midplane because the ice is vertically limited by the temperature structure in the disk (see Fig. 1). The CO ice feature is strongest in the lower surface of the disk, but we note that the absorption in the upper surface of the disk contributes equally to the integrated spectrum because the continuum in the upper surface is stronger (see Fig. B.1). The vertical CO snowline is resolved in the upper surface of the disk, but the edge is smoothed out due to radiative transfer effects and PSF smoothing.
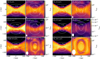 |
Fig. 4 Expected peak optical depth for the six main ice absorption features as a function of disk radius and height toward HH 48 NE. The left columns show the optical depth in the model at similar pixel resolution as NIRSpec and MIRI. The right columns show the same after convolving the model with an instrumental PSF of NIRSpec (<5 µm) or MIRI (>5 µm). The FWHM of the PSF is shown in the lower left corner. The white contours show the local continuum at 0.003 and 0.030mJy for reference. 30 µJy is the typical 3σ sensitivity of a JWST/NIRSpec exposure of ~1 h. The color scales are different for each ice feature. |
3.2 Sensitivity to parameters
In Fig. 5, we present the modeled spectra for a range of parameters compared to the fiducial model that best resembles the currently available continuum observations (see Paper I for details). The evolution of the integrated peak optical depth with these parameters is presented in Fig. 6. These peak optical depths are dominated by the disk regions with highest continuum values (see Fig. B.1), however. To compare the models at different disk locations more universally, we summed all emission in a radial slab at seven different heights in the disk and show the optical depth in Figs. B.2–B.4.
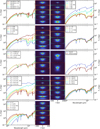 |
Fig. 5 Sensitivity of the mid-infrared spectrum to various parameters of the model, stated in the legend (large panels). Appearance of the disk in scattered light at 4 µm, convolved with the NIRSpec PSF (small panels). The panels are labeled with the same color as the legend and show to which extent changes in these parameters will be visible in the NIRSpec images. The vertical ticks indicate ±100 au. |
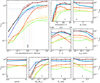 |
Fig. 6 Sensitivity to various parameters of the maximum optical depth of the six main ice features. The vertical black line is the fiducial model. The dotted lines in the large panel indicate the uncertainty of the peak optical depth (horizontal) and corresponding abundance (vertical) when taking the uncertainty of all parameters into account. The varied parameters are the ice abundance, the inclination, the Av limit, the mass fraction of small grains expressed as 1-fℓ, the minimum grain size, the existence of a cavity, the disk mass, and the characteristic disk radius. A typical deep observation of the JWST has a contrast ratio of 300 on the continuum (i.e., S/N = 300), which translates into a 3σ peak optical depth of ~10−2. |
3.2.1 Sensitivity to abundance
We varied the abundance of all molecules by two orders of magnitude from the fiducial model in nine logarithmic steps while keeping the total amount of mass the same. Figure 5 shows the integrated spectra, and the spatially resolved results are shown in Fig. B.2. In a direct observation of ice against a background source instead of a scattering continuum, we would expect a peak optical depth that is directly proportional to the abundance because the ice column density is thought to scale linearly with optical depth. In the limit of low ice abundances (lower than the ISM abundance) we recover the same trend for edge-on proto-planetary disks (see the large panel in Fig. 6). However, this slope flattens toward high abundances for all ice species before reaching total saturation of the absorption feature (see Fig. 5). This is likely a result of local saturation, meaning that the ice absorption features are saturated at the position in the disk in which the ice absorbs the light, but that additional light from the same line of sight contributes to the total flux that is not saturated because it is scattered through disk regions with less ice. The result is that low ice abundances can be inferred with great accuracy, but for abundances greater than ten times this low abundance, the ISM abundance can only be constrained with a lower limit. The optical depth of CO2, H2O, and CH3OH can reach higher values than CH4 and CO because their freeze-out region is larger and therefore their absolute absorption is higher. The maximum optical depth can vary from source to source depending on the scattering continuum and source structure.
3.2.2 Sensitivity to the fraction of settled mass
The amount of settling (expressed as the mass fraction in large settled grains: fℓ, with the corresponding fraction of material left in the atmosphere: 1-fℓ) has a direct effect on the height of the scattering surface in the disk, which is defined as the height at which the disk becomes optically thick to stellar light at each wavelength. This in turn determines which part of the disk will absorb the scattered light from the star and the warm inner disk and thus the depth of the ice absorption features. We changed the amount of settled dust mass in the model setup from 0 to 99% in five steps (see Figs. 5, B.2) to determine how this affects the ice spectrum. fℓ = 0 implies that the disk contains no grains larger than 7 µm, which means that the longer wavelengths for that model miss an important emission contribution.
Settling has a major impact on the scattered light images and on the scattering continuum. Less settling means that the upper and lower emission surfaces of the disk extend farther out in height and that the width of the dark lane increases. This is a direct result of the height of the scattering surface, which increases if the number of small grains in the disk atmosphere increases. Disks with fℓ > 99% do not fully shield the star at an inclination of 82.3°, and the source appears as a point source. Since the settling has a major effect on the resolved scattered light observations, the JWST observations provide tight constraints on the number of small dust grains in the disk atmosphere.
The ice features are strongly affected by the amount of settling (see Fig. 6). Multiple effects are at play at the same time, which results in a complicated dependence that is different for every ice feature. The amount of settled dust mass changes the position of the scattering surface, as explained earlier, which affects the amount of cold material below the scattering surface. This effect is visible in Fig. 6 as a general increase in the strength of the ice features toward less settled disks up to an order of magnitude due to an increased column density of cold material below the scattering surface. However, for all molecules except CO, the optical depth decreases again for fℓ ≳ 0.9. This turnover is due to a directional effect in which the light is scattered more through the disk surface rather than through the cold midplane. The same effect creates the increased width of the dark lane for a less settled disk. Additionally, the upper layers of the disk become increasingly optically thin due to the settling of material, which allows for more direct stellar light or singly scattered light that traces a smaller column of ice. The h2o feature at 3 µm does not follow the trend up in opacity from fℓ = 0.99 to fℓ = 0.9, which is likely because h2o has a high desorption temperature and thus is available throughout the disk. This feature at a relatively short wavelength is also less affected by direct stellar light.
3.2.3 Sensitivity to the inclination
In previous works, it has been shown that the inclination can have a strong effect on the visibility of the ices in the disk (e.g., Terada & Tokunaga 2017; Ballering et al. 2021). We varied the inclination of our model from 60° to 90° in eight steps to determine the impact on the absorption features in HH 48 NE.
We show in Fig. 5 that the total spectrum of the disk changes over an order of magnitude, but the optical depth of the ice features is not very sensitive to the inclination for most ice species (see Fig. 6) as long as the disk is sufficiently edge-on to block direct lines of sight to the star (i > 70°; see Fig. 3). This is consistent with previous modeling work that showed little variation in ice optical depths >80° (Pontoppidan et al. 2005), although that model predicts significantly more absorption close to the critical inclination of 70°. This difference is likely a result of the differences between the model setups, as Pontoppidan et al. (2005) did not include any settling of large grains nor an Av threshold for UV photodissociation of ices, which results in a larger amount of ice in the atmospheric layers that is traced in disks at an inclination of ~70° compared to our model. The sharp transition around i ~ 70° is confirmed observationally using all known water ice detections in protoplanetary disks (Terada & Tokunaga 2017). The CO ice feature in the integrated spectrum increases by an order of magnitude from 70 to 90°. This occurs primarily because at low inclination, the scattered light continuum does not reach the coldest regions in the midplane of the disk along the line of sight, but will only probe the ice in layers higher up in the disk.
At lower inclinations, the upper surface of the disk absorbs significantly less in the H2O, CO2, and CO features than the lower surface (see Fig. B.2). The asymmetry between absorption depth in the upper half versus the lower half could thus be a direct probe of the disk inclination. For low inclinations (<75°), the peak of the absorption features shifts to longer wavelengths, which is seen in all main ice features (see Fig. B.2). At these inclinations, the ice scattering opacity plays an important role and causes shifts in the peak position and changes in the absorption profiles. In extreme cases, this results in absorption features with a wing in emission in CO2 (Dartois et al. 2022).
3.2.4 Sensitivity to the Av limit
As mentioned in Sect. 2, we added a physically motivated Av limit to the height in the disk at which ice is allowed to form on the dust grains (see Fig. 1). Above this limit, ices will be easily desorbed by nonthermal processes under the intense irradiation of high-energy stellar photons (Boogert et al. 2015; Arabhavi et al. 2022). We varied the Av limit from the fiducial value of 1.5 to 0, 3, and 10 mag. Without an Av limit, the optical depth of H2O and CO2 remains fairly constant over the height of the disk, even up to 90 au from the disk midplane (Fig. B.3). With the Av limit in place, there is less absorption of H2O and CO2 (Fig. 6), and a larger variation with height (see Fig. B.3). The Av limit has no effect on the CO absorption because the regions in which the disk is cold enough for CO to freeze out are already lower than the Av limit (see Fig. 1) and the effect on the continuum is minor (Fig. 5). The ice features are not sensitive to small variations in the limit that is used. The peak of the absorption features moves with increasing Av limit to longer wavelengths. This is the case for the H2O, the CO2, and the silicate feature (see Sect. 3.3 for more details).
3.2.5 Sensitivity to the grain size
To determine the sensitivity of the ice features to the grain size distribution, we changed the minimum grain size from the fiducial model of 0.5 µm by extending it to smaller grains. The absorption features of most ice features, except CO, are slightly stronger when we include small grains up to the canonical value of ISM grains, 0.005 µm, but there is no significant difference between a minimum grain size of 0.005 µm and 0.05 µm. Ices on large grains are partly invisible, as shown in previous studies (e.g., Dartois et al. 2022). Including more small grains will therefore boost the fraction of observed ice, hence the optical depth. Any addition of grains smaller than 1 µm is enough to dominate the absorption, and including more small dust grains does not change the optical depths of the ice significantly. If only grains larger than 5 µm are used, the optical depth changes significantly by a factor of ~5 (see Fig. 6).
3.2.6 Sensitivity to a cavity
To determine the effect of a cavity on the spectrum, we ran the same model as the fiducial model, but without a dust depletion inside the cavity. The integrated continuum is suppressed by a factor of 3–4 (see Fig. 5), but the cavity has a negligible effect on the H2O and CO2 ice features (see Fig. 6). This indicates that most absorption occurs in the outer regions of the disk and that the cavity does not have a significant effect on the region in which the warm dust emission is scattered in the disk, as long as there is warm material in the inner disk. The CO feature at 4.67 µm does change by a factor of 3, which is considerable given that a similar boost could result from an elevated abundance by an order of magnitude.
3.2.7 Sensitivity to the total mass
The disk mass was varied over four orders of magnitude from 3×10⁻⁵−3×10⁻² M⊙ while keeping the gas-to-dust ratio constant. We would like to note that a lower disk mass therefore decreases the ice column densities, similar to the ice abundance grid, but also has a significant effect on the scattering continuum (see Fig. 5). Ice absorption features are sensitive to the order-of-magnitude changes, but only the features at wavelengths <5 µm change significantly if the mass increases by an order of magnitude. By changing the disk mass, the temperature structure changes, as does the column density of the material and the height of the emitting layer. The latter two dominate in the impact on the ice features. This results in a weaker change in the features at longer wavelengths, partly due to the local saturation explained in Sect. 3.2.2. This is especially true for the methanol feature at 9.4 µm and the CO2 feature at 15.2 µm. The CO2 feature at 4.27 µm is much more affected than the CO2 feature at 15.2 µm, which could serve as a direct probe of the disk mass. However, the feature at 15.2 µm can changes considerably in shape if the CO2 is in different ice matrices.
3.2.8 Sensitivity to the radial size
The physical size of the disk can play a major role in setting its temperature structure. We varied one of the parameters that determines the radial extent of the disk, Rc, between 45 and 125 au. Although the effect on the continuum is significant (Fig. 5), the ice optical depths do not change significantly (Fig. 6). We would like to note that for models with a small Rc, the 55 au cavity pushes material outward to sustain the same disk mass as the fiducial model. Increasingly small disks without a cavity are expected to show variations due to changes in the area below the snow surfaces.
3.2.9 Sensitivity to the flaring index
We varied ψ from a flat disk (ψ = 0) to an extremely flared disk (ψ = 0.275) in five steps ψ ∈ [0, 0.075, 0.127, 0.175, 0.275]. The flaring has only a minor effect on the ice features in the MIRI wavelength regime, but the optical depth of the ice features <5 µm increases for a flatter disk. The flaring of the disk (ψ) changes the temperature structure in the disk and directly affects the angle of the scattering surface toward the midplane. For disks with less flaring, this angle is smaller, and thus more light will reach the ice-rich regions of the disk. This effect is strongest for the CO ice feature at 4.7 µm because CO ice is only located near the midplane.
3.3 Silicate feature
Not only the ice absorption features, but also the shape and strength of the silicate feature at 10 µm are affected by the physical parameters of the disk model (see Figs. B.2, B.4). In the fiducial model, the silicate feature is only seen in absorption, unlike the typical emission feature seen in disks with an inclination <70° (Olofsson et al. 2009). Absorption of the silicate feature arises when the scattering surface is high up in the disk and the light has to pass through a large column of cold dust in the outer disk.
The silicate feature is very sensitive to the inclination. For inclinations <75°, an emission component is seen in addition to the silicates in absorption, and at even lower inclinations, the silicate feature appears only in emission. Very settled disks also show a silicate feature in emission because the scattering surface is low in the disk, which means that the warm dust above the scattering surface significantly adds emission to the spectrum. These changes also affect the determined CH3OH optical depths (see Fig. 6). The silicate feature varies in strength with varying ice abundance, and it is even seen in emission when the ice coating on the grains is thick enough.
Changes in the shape of the silicate absorption feature are observed in Spitzer IRS spectra toward edge-on protoplanetary disks. For comparison, we retrieved low-resolution spectra from the CASSIS archive (Lebouteiller et al. 2011) of the edge-on disks Tau 042021 and ESO-Ha 569 (see Fig. 7). The optical depth of the silicate feature was determined with a linear fit using data points between (5,6) and (11,14) µm and Eq. (6). The silicate feature in ESO-Ha 569 has a clear emission component around 8 µm, while the feature in Tau 042021 has only a component in absorption. Without detailed modeling of the sources, we over-plot the model for HH 48 NE at an inclination of 90° and 75°. The inclination of these sources can roughly be inferred from their silicate feature alone because ESO-Ha 569 is inclined at ~83° (Wolff et al. 2017), while Tau 042021 is inclined at 88° (Villenave et al. 2020). The differences in inclinations are exaggerated because of the differences in mass and settling of the two disks and HH 48 NE. An estimate of the dust mass is necessary to use this approach in observations, for example, from millimeter continuum observations. The shape and strength of the silicate feature can be crucial to break parameter degeneracies and help interpreting the ice observations.
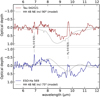 |
Fig. 7 Optical depth of the silicate feature in Spitzer spectra for Tau 042021 and ESO-Ha 569. The black lines show the optical depth of the silicate features in a model inclined at 90° and 75°. The shape of the silicate feature clearly is a function of inclination and disk mass. |
4 Discussion
The high sensitivity and resolution of the JWST will provide spatially resolved measurements of ices in class II protoplanetary disks. These observational data can only be properly interpreted with detailed modeling. This is especially true for edge-on disks because the ice absorption features are highly dependent on the physical source structure and are not easy to interpret. We have explored the effect of various parameters on the optical depth of the ice that can be directly compared to observations to interpret the results.
4.1 Constraining the ice abundances
We investigated the impact of various physical disk parameters on the optical depth of the main ice features in protoplanetary disks. We find that the molecular abundance and disk mass have the strongest effect on the observed ice features, which results primarily from a reduction of the absolute column density of ice. The optical depth increases monotonically with the abundance for all ice features, but the exact shape is dependent on the source structure and wavelength. Two other important parameters are the inclination and the amount of grain growth and settling. These parameters can change the optical depths in the same order of magnitude as the chemical abundance. It is hence crucial to have a well-constrained physical disk model to constrain the ice abundances from observations.
This work is the first to convolve the model with an instrumental PSF to determine whether we can resolve vertical changes in the ice abundance. HH 48 NE should be resolved sufficiently within the NIRSpec range to constrain vertical abundance gradients due to temperature, irradiation, and chemistry. At wavelengths >7 µm, the vertical dependences are no longer resolved because the size of the PSF increases. The vertical extent of the CO and CO2 snowline might therefore be observable in the derived observed optical depths, although the transition will be smooth because the elevation of the snow surface increases radially outward. The PSF side lobes can induce significant artifact ice-feature signatures throughout the disk, even in regions in which direct ray-tracing of the model without convolution of a PSF shows no sign of ices (e.g., at 100 au in Fig. 4). Since the radial dependence of the optical depth of the ice is largely insensitive to the disk geometry and most absorption occurs in the outer regions of the disk, it will be difficult to infer radial snowlines or abundance variations in radial direction because all photons originate from central regions in the disk, which means that all photons that are scattered in our direction have encountered a wide range of radii regardless of the line of sight they appear to come from. We would like to note that RADMC-3D uses long characteristic radiative transfer for the image reconstruction, which in general is more expensive, but gives the most accurate results. We tested another radiative transfer approach that combines both long characteristics and short characteristics radiative transfer, Hyperion (Robitaille 2011), which gives identical results (see Appendix A for more details).
We have shown that the optical depth of the ice features increases monotonically with abundance, but an accurate estimate of the source inclination, the amount of settling, and the disk mass is required to determine the conversion factor. The maximum optical depth that can be reached in our models is ~ 1 even at very high ice abundances and column densities. This illustrates that the ice features may be locally saturated in the disk, but that at least one-third of the light is scattered through the ice-free upper layers of the disk before it is scattered in our direction from a layer deeper down in the disk. The optical depths of the ice that we find in our model are relatively high compared to earlier work by Ballering et al. (2021) and Arabhavi et al. (2022). In contrast to these works, we expect to find CO in the integrated NIRSpec spectra and deeper CO2 ice features. Ballering et al. (2021) used a standard model with a high disk mass and complex gas-grain chemistry in the same radiative transfer code RADMC-3D. Their continuum for an inclination of 85° is similar to our spectrum, but their silicate feature is in emission even at an inclination of 90°. The water-ice feature in their spectrum is of similar strength as in our model, but the other species compared to water ice are much weaker. The final abundances in their inheritance model are very similar to our input abundance and are fairly constant with height and radius. The differences between their expected strength of the ice absorption features and this work are therefore largely a result of the geometry of the fiducial disk model. The observed optical depths toward the class I disk in Pontoppidan et al. (2005) are much deeper than our model, but they show that most ices are located in the envelope surrounding the disk, and only 50% of H2O and CO2 and none of the CO ice are located in the disk. Because HH 48 NE is a more evolved disk without a thick envelope, absorption from cloud ice does not play a significant role.
In Sect. 3.2 we showed that global ice abundances can be inferred from spatially integrated observations when the settling, inclination, and disk mass are known. In the case of HH 48 NE, these three parameters are well constrained (see Paper I). By treating the uncertainties as independent from each other, we can derive a first-order estimate of the uncertainty on the measured ice abundances from the parameter variation in Fig. 6. We determined the uncertainty on the optical depth expected from the 1σ uncertainty interval via interpolation for each of the considered parameters. By combining the uncertainties using  , we determined the uncertainty on the molecular abundance for each ice feature (see the vertical lines in the top left panel of Fig. 6). The uncertainty on the ice abundances is typically a factor of 2, and only the CO abundance is uncertain to a factor of 3.
4.2 Detectability of edge-on disks
Highly inclined disks (i > 70°) are statistically less often detected than their less inclined counterparts (Luhman et al. 2008; Rodgers-Lee et al. 2014). Based on this parameter study, we identify several potential explanations for this trend.
First, edge-on disks are often selected based on their SEDs and are then confirmed with scattered light imaging or resolved millimeter continuum observations. Edge-on disks typically have a high infrared excess and a characteristic dip in the mid-infrared because the silicate feature is in absorption. The spectra of these disks can look similar to those of transition disks, which show a comparable dip in the mid-infrared that is caused by a lack of warm material in the inner disk regions (van der Marel et al. 2022), or to those of class I sources that receive less stellar contribution to their SED as well. We have shown that edge-on disks with a high level of settling or with an inclination of <85° may instead show a silicate feature in emission, which means that these objects may not be recognized as edge-on disks until they are observed at high angular resolution. Complete sample studies at high angular resolution with ALMA or scattered light observatories are hence necessary to increase the fraction of detected edge-on disks. Unfortunately, very high angular resolution is necessary to determine highly inclined sources directly from the observations (Villenave et al. 2020), and the observed samples of disks in scattered light are far from complete.
Second, the radial substructure might be important for detecting edge-on disks. The HH 48 NE model without a cavity has a scattered light continuum that is lower by a factor of 3 to 4, which makes the disk harder to detect (see Fig. 5). With a cavity, the mid-infrared is boosted by the structural changes in the disk density profile.
Third, in many instances, we find that the disk disappears due to a lack of contrast between the star and the disk (see Fig. 5). This is especially true for disks with a high level of settling, a low inclination, or a low disk mass. This results in an observation bias because the average observed disk mass for edge-on disks (>25.6 M⊕ Villenave et al. 2020) is higher than the mean dust mass distribution of the full Taurus and Lupus disk populations (15 M⊕ Andrews et al. 2013; Ansdell et al. 2016), especially when we take into account that edge-on disks are much more likely to be optically thick (Villenave et al. 2020). Without sufficient material in the upper layers of the disk to block direct lines of sight to the star, it will be impossible to detect these disks in scattered light without a coronagraph (see also Wolff et al. 2017). The recent work by Angelo et al. (2023) comes to similar conclusions using a simulated population of edge-on protoplanetary disks.
5 Conclusions
We have set up a disk model using the radiative transfer code RADMC-3D that includes anisotropic scattering and opacities of the six most important ice species. The sensitivity of the optical depth of the main ice features to various physical parameters was explored to determine how well chemical abundances can be constrained in the disk. We conclude the following:
The main ice species, H2O and CO2, are likely detectable in JWST data of edge-on protoplanetary disks. Weaker features such as those from CO, CH4, CH3OH, and NH3 require a high inclination and a low amount of settling to be observed.
The optical depth of the ice features in protoplanetary disks changes monotonically, but non-linearly with ice abundance, and is saturated at an optical depth ≲1 due to the effect of local saturation. A detailed modeling of the source structure is necessary to infer the chemical effects in the disk. The abundances in the HH 48 NE disk can be constrained to within a factor of 3 with respect to the dust content when the current uncertainty on the disk geometry is taken into account.
Vertical ice abundance gradients are detectable in the NIR-Spec range (H2O, CO2, and CO), but the resolved optical depths are not linearly related to the ice column density along the line of sight. For wavelengths longer than 7 µm, resolved maps will be dominated by PSF residuals that are due to the large angular scale of the PSF.
The shape of the silicate feature and the comparison between the two CO2 bands at 4.3 and 15.1 µm might help to break the degeneracy between the total solid mass and the ice-to-rock ratio.
The low detection rate of edge-on disks can be explained by a combination of silicate features that appear in emission at inclinations <85º, radial substructure that is necessary to boost the mid-infrared continuum, and the need for a large amount of dust high up in the disk to block direct lines of sight toward the star.
We have shown that the JWST will be able to observe spatially resolved ice features in protoplanetary disks. In-depth modeling of the ice chemistry, disk geometry, and radiative transfer is crucial to interpret forthcoming observations of the JWST ERS program IceAge and edge-on disks in general.
Acknowledgements
We would like to thank the anonymous referee for suggestions that improved the manuscript. We also thank Ewine van Dishoeck for useful discussions and constructive comments on the manuscript. Astrochemistry in Leiden is supported by the Netherlands Research School for Astronomy (NOVA), by funding from the European Research Council (ERC) under the European Union’s Horizon 2020 research and innovation programme (grant agreement no. 101019751 MOLDISK). M.K.M. acknowledges financial support from the Dutch Research Council (NWO; grant VI.Veni.192.241). D.H. is supported by Center for Informatics and Computation in Astronomy (CICA) grant and grant number 110J0353I9 from the Ministry of Education of Taiwan. D.H. acknowledges support from the National Technology and Science Council of Taiwan through grant number 111B3005191. M.N.D. acknowledges the Swiss National Science Foundation (SNSF) Ambizione grant no. 180079, the Center for Space and Habitability (CSH) Fellowship, and the IAU Gruber Foundation Fellowship. This work makes use of the following software: numpy (van der Walt et al. 2011), matplotlib (Hunter 2007), astropy (Astropy Collaboration 2013, 2018), OpTool (Dominik et al. 2021), RADMC-3D (Dullemond et al. 2012), Hyperion (Robitaille 2011), WebbPSF (Perrin et al. 2012).
Appendix A Comparison between RADMC-3D and Hyperion
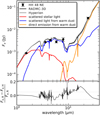 |
Fig. A.1 Comparison between ray-traced spectra by RADMC-3D and Hyperion. The top panel shows the SEDs for Hyperion and RADMC-3D. The colored lines show the contribution to the total spectrum of scattered stellar light (red), scattered light from warm dust (blue), and direct light from warm dust (orange). The direct stellar light component is negligible and is therefore not shown in this plot. The bottom panel shows the normalized difference between the two total outputs of the two codes. The dashed lines indicates the standard deviation of the difference, which is 5%. |
As a validation of the suitability of RADMC-3D for full anisotropic scattering in edge-on disk models, we ran the best-fitting model once with the radiative transfer code Hyperion (Robitaille 2011). Hyperion treats scattering internally differently. It traces each individual photon package from the source to the destination. The benefit of this is that multiple inclinations can be ray-traced at once and that the final spectrum can be dissected into four components: direct stellar light, scattered stellar light, direct dust emission, and scattered light from warm dust (see Fig. A.1). The downside is that the code is very demanding in terms of computing time and computer RAM (>500 Gb; hence only possible on high-performance clusters). The relative difference between the final output of the two codes is less than 20% everywhere in the spectrum, does not increase in the ice absorption features, and has a standard deviation of 5%. With this comparison, we demonstrate that the output can be trusted independent of the radiative transfer code that is used. In the spectral region in which the important ice absorption features are located, the continuum is dominated by the dust scattering by half an order of magnitude over direct source scattering at short wavelengths and dust emission at long wavelengths.
Appendix B Additional material
In Fig. B.1 we present the spatially resolved optical depth of the ice features, similar to Fig. 4, but weighted with the continuum emission. The maps show how much the different disk regions contribute to the disk integrated spectrum. In all absorption features, only a few pixels determine the optical depth of the ice in the disk-integrated spectrum.
Spatially resolved observations are necessary to trace any variations in abundance directly. In Figs. B.2, B.3, and B.4, we present the vertically resolved optical depth of the main ice absorption features as function of the same parameters as in Sect. 3.2
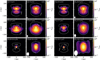 |
Fig. B.1 Same as Fig. 4, but weighted with the continuum emission and normalized to the peak contribution. This figure illustrates what part of the disk contributes mostly to the disk averaged spectrum or the radial slabs presented in Figs B.2, B.3, and B.4. |
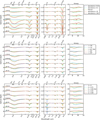 |
Fig. B.2 Dependence of the ice optical depth on the ice abundance, the inclination and the fraction of settled large grains. The modeled optical depth of the main ice features and the silicate feature are shown at 7 different vertical positions in the disk, convolved with an instrumental PSF. The resolution in height is 30 au, which corresponds to two pixels in NIRSpec/MIRI data. |
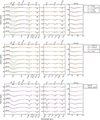 |
Fig. B.3 Same as Fig. B.2, but instead varying the Av limit and the maximum grain size, as well as with and without a dust cavity. |
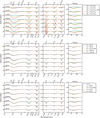 |
Fig. B.4 Same as Fig. B.2, but instead varying the total disk mass and the spatial scale of the disk as a function of Rc. |
References
- Aikawa, Y., Kamuro, D., Sakon, I., et al. 2012, A & A, 538, A57 [CrossRef] [EDP Sciences] [Google Scholar]
- Andrews, S. M., Wilner, D. J., Espaillat, C., et al. 2011, ApJ, 732, 42 [Google Scholar]
- Andrews, S. M., Rosenfeld, K. A., Kraus, A. L., & Wilner, D. J. 2013, ApJ, 771, 129 [Google Scholar]
- Angelo, I., Duchêne, G., Stapelfeldt, K., et al. 2023, ApJ, 945, 130 [NASA ADS] [CrossRef] [Google Scholar]
- Ansdell, M., Williams, J. P., van der Marel, N., et al. 2016, ApJ, 828, 46 [Google Scholar]
- Arabhavi, A. M., Woitke, P., Cazaux, S. M., et al. 2022, A & A, 666, A139 [NASA ADS] [CrossRef] [EDP Sciences] [Google Scholar]
- Astropy Collaboration (Robitaille, T. P., et al.) 2013, A & A, 558, A33 [NASA ADS] [CrossRef] [EDP Sciences] [Google Scholar]
- Astropy Collaboration (Price-Whelan, A. M., et al.) 2018, AJ, 156, 123 [Google Scholar]
- Ballering, N. P., Cleeves, L. I., & Anderson, D. E. 2021, ApJ, 920, 115 [NASA ADS] [CrossRef] [Google Scholar]
- Banzatti, A., Pinilla, P., Ricci, L., et al. 2015, ApJ, 815, L15 [Google Scholar]
- Baratta, G. A., Accolla, M., Chaput, D., et al. 2019, Astrobiology, 19, 1018 [NASA ADS] [CrossRef] [Google Scholar]
- Boogert, A. C. A., Gerakines, P. A., & Whittet, D. C. B. 2015, ARA & A, 53, 541 [NASA ADS] [CrossRef] [Google Scholar]
- Bruggeman, D. A. G. 1935, Ann. Physik, 416, 636 [CrossRef] [Google Scholar]
- Cieza, L. A., Casassus, S., Tobin, J., et al. 2016, Nature, 535, 258 [Google Scholar]
- Dartois, E., Noble, J. A., Ysard, N., Demyk, K., & Chabot, M. 2022, A & A, 666, A153 [NASA ADS] [CrossRef] [EDP Sciences] [Google Scholar]
- Dominik, C., Min, M., & Tazaki, R. 2021, Astrophysics Source Code Library, [record ascl:2104.810] [Google Scholar]
- Dullemond, C. P., Juhasz, A., Pohl, A., et al. 2012, Astrophysics Source Code Library, [record ascl:1202.015] [Google Scholar]
- Gerakines, P. A., & Hudson, R. L. 2020, ApJ, 901, 52 [NASA ADS] [CrossRef] [Google Scholar]
- Hunter, J. D. 2007, Comput. Sci. Eng., 9, 90 [NASA ADS] [CrossRef] [Google Scholar]
- Jakobsen, P., Ferruit, P., Alves de Oliveira, C., et al. 2022, A & A, 661, A80 [NASA ADS] [CrossRef] [EDP Sciences] [Google Scholar]
- Johansen, A., Ronnet, T., Bizzarro, M., et al. 2021, Sci. Adv., 7, eabc0444 [NASA ADS] [CrossRef] [Google Scholar]
- Lebouteiller, V., Barry, D. J., Spoon, H. W. W., et al. 2011, ApJS, 196, 8 [NASA ADS] [CrossRef] [Google Scholar]
- Luhman, K. L., Allen, L. E., Allen, P. R., et al. 2008, ApJ, 675, 1375 [NASA ADS] [CrossRef] [Google Scholar]
- Lynden-Bell, D., & Pringle, J. E. 1974, MNRAS, 168, 603 [Google Scholar]
- Martonchik, J. V., Orton, G. S., & Appleby, J. F. 1984, Appl. Opt., 23, 541 [NASA ADS] [CrossRef] [Google Scholar]
- McClure, M. K., Espaillat, C., Calvet, N., et al. 2015, ApJ, 799, 162 [NASA ADS] [CrossRef] [Google Scholar]
- McClure, M. K., Rocha, W. R. M., Pontoppidan, K. M., et al. 2023, Nat. Astron., 7, 431 [NASA ADS] [CrossRef] [Google Scholar]
- Min, M., Hovenier, J. W., & de Koter, A. 2005, A & A, 432, 909 [NASA ADS] [CrossRef] [EDP Sciences] [Google Scholar]
- Minissale, M., Aikawa, Y., Bergin, E., et al. 2022, ACS Earth Space Chem., 6, 597 [NASA ADS] [CrossRef] [Google Scholar]
- Öberg, K. I., Boogert, A. C. A., Pontoppidan, K. M., et al. 2011, ApJ, 740, 109 [Google Scholar]
- Olofsson, J., Augereau, J. C., van Dishoeck, E. F., et al. 2009, A & A, 507, 327 [CrossRef] [EDP Sciences] [Google Scholar]
- Palumbo, M. E., Baratta, G. A., Collings, M. P., & McCoustra, M. R. S. 2006, Phys. Chem. Chem. Phys. (Incorporating Faraday Trans.), 8, 279 [NASA ADS] [CrossRef] [Google Scholar]
- Perrin, M. D., Soummer, R., Elliott, E. M., Lallo, M. D., & Sivaramakrishnan, A. 2012, SPIE Conf. Ser., 8442, 84423D [NASA ADS] [Google Scholar]
- Pinte, C., Ménard, F., Duchêne, G., et al. 2018, A & A, 609, A47 [NASA ADS] [CrossRef] [EDP Sciences] [Google Scholar]
- Podio, L., Garufi, A., Codella, C., et al. 2020, A & A, 642, A7 [Google Scholar]
- Pontoppidan, K. M., Dullemond, C. P., van Dishoeck, E. F., et al. 2005, ApJ, 622, 463 [NASA ADS] [CrossRef] [Google Scholar]
- Pontoppidan, K. M., Stapelfeldt, K. R., Blake, G. A., van Dishoeck, E. F., & Dullemond, C. P. 2007, ApJ, 658, L111 [CrossRef] [Google Scholar]
- Pontoppidan, K. M., Salyk, C., Bergin, E. A., et al. 2014, in Protostars and PlanetsVI, eds. H. Beuther, R. S. Klessen, C. P. Dullemond, & T. Henning, 363 [Google Scholar]
- Powell, D., Gao, P., Murray-Clay, R., & Zhang, X. 2022, Nat. Astron., 6, 1147 [CrossRef] [Google Scholar]
- Qi, C., Öberg, K. I., Wilner, D. J., et al. 2013, Science, 341, 630 [Google Scholar]
- Rieke, G. H., Wright, G. S., Böker, T., et al. 2015, PASP, 127, 584 [NASA ADS] [CrossRef] [Google Scholar]
- Robitaille, T. P. 2011, A & A, 536, A79 [NASA ADS] [CrossRef] [EDP Sciences] [Google Scholar]
- Rodgers-Lee, D., Scholz, A., Natta, A., & Ray, T. 2014, MNRAS, 443, 1587 [CrossRef] [Google Scholar]
- Sossi, P. A., Stotz, I. L., Jacobson, S. A., Morbidelli, A., & O’Neill, H. S. C. 2022, Nat. Astron., 6, 951 [NASA ADS] [CrossRef] [Google Scholar]
- Stapelfeldt, K. R., Duchêne, G., Perrin, M., et al. 2014, in Exploring the Formation and Evolution of Planetary Systems, 299, eds. M. Booth, B. C. Matthews, & J. R. Graham, 99 [NASA ADS] [Google Scholar]
- Sturm, J. A., McClure, M. K., Harsono, D., et al. 2022, A & A, 660, A126 [NASA ADS] [CrossRef] [EDP Sciences] [Google Scholar]
- Sturm, J. A., McClure, M. K., Law, C. J., et al. 2023, A & A, 677, A17 (Paper I) [Google Scholar]
- Terada, H., & Tokunaga, A. T. 2012, ApJ, 753, 19 [NASA ADS] [CrossRef] [Google Scholar]
- Terada, H., & Tokunaga, A. T. 2017, ApJ, 834, 115 [NASA ADS] [CrossRef] [Google Scholar]
- Terada, H., Tokunaga, A. T., Kobayashi, N., et al. 2007, ApJ, 667, 303 [NASA ADS] [CrossRef] [Google Scholar]
- van der Marel, N., Williams, J. P., Picogna, G., et al. 2022, A & A, submitted [arXiv:2204.08225] [Google Scholar]
- van der Walt, S., Colbert, S. C., & Varoquaux, G. 2011, Comput. Sci. Eng., 13, 22 [Google Scholar]
- van’t Hoff, M. L. R., Harsono, D., Tobin, J. J., et al. 2020, ApJ, 901, 166 [Google Scholar]
- Villenave, M., Ménard, F., Dent, W. R. F., et al. 2020, A & A, 642, A164 [CrossRef] [EDP Sciences] [Google Scholar]
- Visser, R., Bruderer, S., Cazzoletti, P., et al. 2018, A & A, 615, A75 [NASA ADS] [CrossRef] [EDP Sciences] [Google Scholar]
- Warren, S. G. 1986, Appl. Opt., 25, 2650 [NASA ADS] [CrossRef] [Google Scholar]
- Warren, S. G., & Brandt, R. E. 2008, J. Geophys. Res. (Atmos.), 113, D14220 [Google Scholar]
- Weingartner, J. C., & Draine, B. T. 2001, ApJ, 548, 296 [Google Scholar]
- Wolff, S. G., Perrin, M. D., Stapelfeldt, K., et al. 2017, ApJ, 851, 56 [NASA ADS] [CrossRef] [Google Scholar]
- Zhang, K., Bosman, A. D., & Bergin, E. A. 2020, ApJ, 891, L16 [NASA ADS] [CrossRef] [Google Scholar]
All Tables
All Figures
|
Fig. 1 Dust density setup in the model of the large dust population (left) and small dust population (right). The colored contours follow the dust temperature at which the considered molecules freeze out according to their desorption temperature given in Table 2. The dotted black lines denote a visual extinction (Av) of 0.1, 1, and 10 mag as measured from the stellar position. The onset of ice formation is set to Av < 1.5 mag in the fiducial model. |
| In the text | |
|
Fig. 2 Opacities used for the seven different regions in the disk. Left: absorption opacity. Center: effective scattering opacity. Right: asymmetry parameter g. The regions are numbered with decreasing desorption temperature, as further specified in Table 2. |
| In the text | |
|
Fig. 3 Integrated spectrum of the fiducial model, with photometric data points (red circles) and the best-fitting dust-only model (orange line) for reference. The local continuum used to calculate the optical depths of the sharp ice features is shown in blue. The fiducial model excluding double scattering is shown in gray. The lower panel shows the optical depth of the analyzed ice features in the fiducial spectrum. |
| In the text | |
|
Fig. 4 Expected peak optical depth for the six main ice absorption features as a function of disk radius and height toward HH 48 NE. The left columns show the optical depth in the model at similar pixel resolution as NIRSpec and MIRI. The right columns show the same after convolving the model with an instrumental PSF of NIRSpec (<5 µm) or MIRI (>5 µm). The FWHM of the PSF is shown in the lower left corner. The white contours show the local continuum at 0.003 and 0.030mJy for reference. 30 µJy is the typical 3σ sensitivity of a JWST/NIRSpec exposure of ~1 h. The color scales are different for each ice feature. |
| In the text | |
|
Fig. 5 Sensitivity of the mid-infrared spectrum to various parameters of the model, stated in the legend (large panels). Appearance of the disk in scattered light at 4 µm, convolved with the NIRSpec PSF (small panels). The panels are labeled with the same color as the legend and show to which extent changes in these parameters will be visible in the NIRSpec images. The vertical ticks indicate ±100 au. |
| In the text | |
|
Fig. 6 Sensitivity to various parameters of the maximum optical depth of the six main ice features. The vertical black line is the fiducial model. The dotted lines in the large panel indicate the uncertainty of the peak optical depth (horizontal) and corresponding abundance (vertical) when taking the uncertainty of all parameters into account. The varied parameters are the ice abundance, the inclination, the Av limit, the mass fraction of small grains expressed as 1-fℓ, the minimum grain size, the existence of a cavity, the disk mass, and the characteristic disk radius. A typical deep observation of the JWST has a contrast ratio of 300 on the continuum (i.e., S/N = 300), which translates into a 3σ peak optical depth of ~10−2. |
| In the text | |
|
Fig. 7 Optical depth of the silicate feature in Spitzer spectra for Tau 042021 and ESO-Ha 569. The black lines show the optical depth of the silicate features in a model inclined at 90° and 75°. The shape of the silicate feature clearly is a function of inclination and disk mass. |
| In the text | |
|
Fig. A.1 Comparison between ray-traced spectra by RADMC-3D and Hyperion. The top panel shows the SEDs for Hyperion and RADMC-3D. The colored lines show the contribution to the total spectrum of scattered stellar light (red), scattered light from warm dust (blue), and direct light from warm dust (orange). The direct stellar light component is negligible and is therefore not shown in this plot. The bottom panel shows the normalized difference between the two total outputs of the two codes. The dashed lines indicates the standard deviation of the difference, which is 5%. |
| In the text | |
|
Fig. B.1 Same as Fig. 4, but weighted with the continuum emission and normalized to the peak contribution. This figure illustrates what part of the disk contributes mostly to the disk averaged spectrum or the radial slabs presented in Figs B.2, B.3, and B.4. |
| In the text | |
|
Fig. B.2 Dependence of the ice optical depth on the ice abundance, the inclination and the fraction of settled large grains. The modeled optical depth of the main ice features and the silicate feature are shown at 7 different vertical positions in the disk, convolved with an instrumental PSF. The resolution in height is 30 au, which corresponds to two pixels in NIRSpec/MIRI data. |
| In the text | |
|
Fig. B.3 Same as Fig. B.2, but instead varying the Av limit and the maximum grain size, as well as with and without a dust cavity. |
| In the text | |
|
Fig. B.4 Same as Fig. B.2, but instead varying the total disk mass and the spatial scale of the disk as a function of Rc. |
| In the text | |
Current usage metrics show cumulative count of Article Views (full-text article views including HTML views, PDF and ePub downloads, according to the available data) and Abstracts Views on Vision4Press platform.
Data correspond to usage on the plateform after 2015. The current usage metrics is available 48-96 hours after online publication and is updated daily on week days.
Initial download of the metrics may take a while.